American Journal of Molecular Biology
Vol.2 No.1(2012), Article ID:16549,10 pages DOI:10.4236/ajmb.2012.21004
Intergenic subset organization within a set of geographically-defined viral sequences from the 2009 H1N1 influenza A pandemic
![]()
1Division of Applied Mathematics and Center for Computational Molecular Biology, Brown University, Providence, USA
2Department of Medicine, Alpert/Brown University School of Medicine, Providence, USA
Email: william_thompson_1@brown.edu, #joel_weltman@brown.edu
Received 5 October 2011; revised 2 December 2011; accepted 10 December 2011
Keywords: Influenza A; H1N1; Bioinformatics; Genes; Pandemic; Epidemic; Information Entropy; Mutual InFormation; Graph; Network; Centrality; Subsets
ABSTRACT
We report a bioinformatic analysis of the datasets of sequences of all ten genes from the 2009 H1N1 influenza A pandemic in the state of Wisconsin. The gene with the greatest summed information entropy was found to be the hemagglutinin (HA) gene. Based upon the viral ID identifier of the HA gene sequence, the sequences of all of the genes were sorted into two subsets, depending upon whether the nucleotide occupying the position of maximum entropy, position 658 of the HA sequence, was either A or U. It was found that the information entropy (H) distributions of subsets differed significantly from each other, from H distributions of randomly generated subsets and from the H distributions of the complete datasets of each gene. Mutual information (MI) values facilitated identification of nine nucleotide positions, distributed over seven of the influenza genes, at which the nucleotide subsets were disjoint, or almost disjoint. Nucleotide frequencies at these nine positions were used to compute mutual information values that subsequently served as weighting factors for edges in a graph network. Seven of the nucleotide positions in the graph network are sites of synonymous mutations. Three of these sites of synonymous mutation are within a single gene, the M1 gene, which occupied the position of greatest graph centrality. It is proposed that these bioinformatic and network graph results may reflect alterations in M1-mediated viral packaging and exteriorization, known to be susceptible to synonymous mutations.
1. INTRODUCTION
It is important to elucidate the functional organization of the influenza virus in terms of molecular bioinformatics [1]. We report here an analysis of the information entropy (H) in the 10 genes of the 2009 pandemic H1N1 influenza A virus from Wisconsin, USA. These viral sequences form a well defined set that has been correlated to the clinical severity of disease and to the rate of hospitalization [2]. In the present study, the viral sequence ID identifiers for one influenza gene, the hemagglutinin (HA) gene, was used as a basis for sorting the sequences of all the other genes into subsets. The HA gene was found to be the gene of maximum entropy; the nucleotide position of maximum entropy in the gene of maximum entropy was used as the basis for a strategy for bisection of the set of sequences of each gene into subsets. Mutual information values facilitated the analysis of organization of mutations in the subsets on the intergenic level.
2. MATERIALS AND METHODS
Nucleotide sequences of the protein coding regions of the genes of H1N1 influenza viruses isolated in Wisconsin during the 2009 pandemic were downloaded from the NCBI Influenza Virus Resource Database [3] on July 27, 2011 (number of sequences in parentheses after designated gene): PB2 (318), PB1 (324), PA (331), HA (333), NP (329), NA (323), M1 (328), M2 (332), NS1 (331), NS2 (332). All sequences in the dataset were from viruses s obtained from human patients in Wisconsin between April 28, 2009 and December 17, 2009. All sequences were full-length and from the FLU project. The nucleotides of the influenza virus genes are referred to in this report with the nucleotide positions relative to the 5’-terminus of the mRNA.
Computations, except for mutual information, were performed with Python 2.6.4 [4] with SciPy 0.7.1[5], Numpy 1.3.0, matplotlib [6] and Networkx [7]. Information entropy was computed according to Shannon [8]. The reported zscore probabilities are two-tailed. Zscores were calculated using the standard deviation of the counts from 1000 pseudorandom trials. Mutual information (MI) was computed from sequence counts with R version 2.13.1 (The R Foundation for Statistical Computing) using the “entropy” package [9].
The set of nucleotide sequences of each of the 10 influenza genes was bisected into two subsets, A658 and U658, depending upon the nucleotide occupying position 658 of the HA gene.
3. RESULTS
The total information entropy (H) for each of the 10 genes of the pandemic H1N1 Wisconsin virus is shown in Figure 1. The total H of the HA gene was significantly greater than the H values for the other genes, either without (t = –27.0163, p = 3.7946e–09) or with (t = –25.2976, p = 6.3852e–09) normalization to the length of the gene polynucleotide sequence length. The position of maximum entropy in the HA gene was located at nucleotide position 658 (Figure 2). Occupation by two nucleotides, A and U, accounted for 100% of the HA gene sequences. The nucleotide occupying HA position 658, the nucleotide position of maximum entropy in the gene of maximum entropy, was used as a basis for sorting the nucleotide sequences of all of the genes according to the viral ID of the HA gene.
The set of nucleotide sequences of each gene was bi-
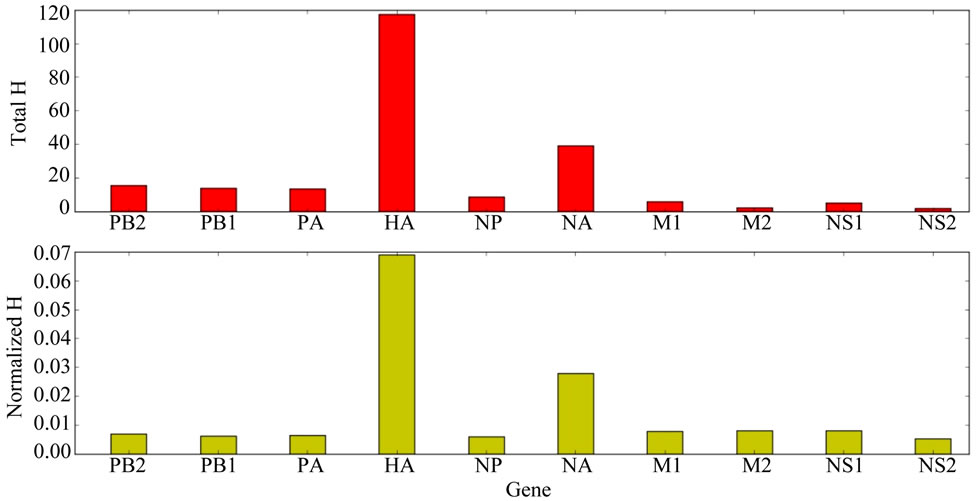
Figure 1. Information Entropy (H) of the Genes of the 2009 Pandemic Wisconsin Influenza A Viruses. (top) total, summed H for each gene (bottom) total, summed H of each gene normalized to the number of nucleotides in that gene. The HA gene is the gene of greatest entropy, both with and without normalization to gene length.
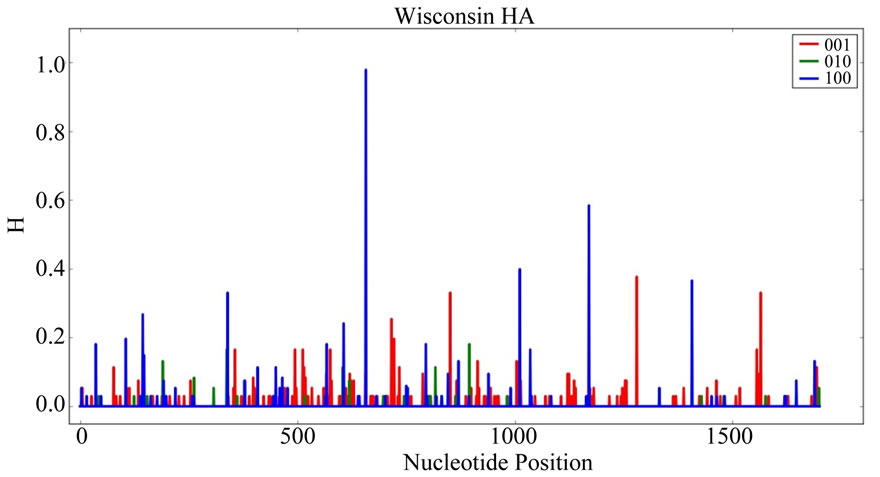
Figure 2. Information Entropy Distribution in the HA Gene of Pandemic 2009 Wisconsin Influenza A Viral Sequences. Information entropy (H) is in bits. The frame of each nucleotide position [10] is indicated by color: red (001, third codon position), green (010, second codon position) and blue (100, first codon position). The nucleotide position of greatest entropy is nucleotide position 658 (numbering is 5’-to-3’ on the (+) sense polynucleotide strand).
sected into two subsets, A658 and U658, depending upon the nucleotide occupying position 658 of the HA gene. The relations between entropy values in the A658 and U658 subsets of each influenza gene are shown in Figure 3. For each of the genes, the entropy values for the A658 subset varied from those of the corresponding U658 subset. Furthermore, the entropy values varied from those predicted for a uniform, random distribution of mutated sequences.
The information entropy in all of these genes was analyzed by determining mutual information (MI) interaction at each subset pair. As shown in Figure 4, peaks of MI values were detected in the following seven genes (nucleotide positions in parentheses): PB2 (position 2163), HA (position 658), NP (position 1248), NA (position 954), M1 (positions 492, 600 and 696), M2 (position 204) and NS1 (position 367). Subset sequence counts at these nine nucleotide positions of these seven genes are given in Table 1.
Table 1 shows the distribution of nucleotides in the A658 and U658 gene sequence subsets for each of the nine nucleotide positions displaying peak MI values. The mean sequence count observed for the predominant nucleotide, i.e., the nucleotide with the maximum count, in the nine A658 subsets was 136.8889 (standard deviation = 1.3699). In contrast, the mean for the non-predominant nucleotide count in the A658 subsets of genes was 0.2222 with standard deviation = 0.4157. (KS = 1.0, p = 5.4128e–05; t = 270.0201, p = 1.0544e–30). The mean count for the predominant nucleotide in the U658 subsets was 182.5556 (standard deviation = 12.0010). The mean count for the non-predominant nucleotide in the U658 subsets was only 8.1111 with standard deviation = 11.4741. (KS = 1.0, p = 5.4128e–05; t = –29.7167, p = 1.9913e–15). The zscores for the differences between the predominant and non-predominant nucleotide count at each nucleotide position in the subsets of the genes were all highly significant (p < 2.22E–16 for each of the nine nucleotide positions). These results show that the distributions of sequence counts at the nine nucleotide positions with peak MI values were significantly asymmetric and skewed. These sequence counts were used to compute mutual information (MI) at each, and between each, of the nine positions (MI values, in bits are in parentheses): PB2 (0.9849), HA(0.9802), NP(0.9538), NA(0.6533), M1 (0.9788699, 0.9788699, and 0.6814868), M2 (0.6766) and NS1(0.9800). The MI values shown are for the selfinformation, i.e., the entropy computed as a mutual information [reference 11, equation 2.41]. In all cases, similar values were obtained for between-position MI pairs as were obtained for self-information subset pairs (see Supplementary data). Representation of these MI values
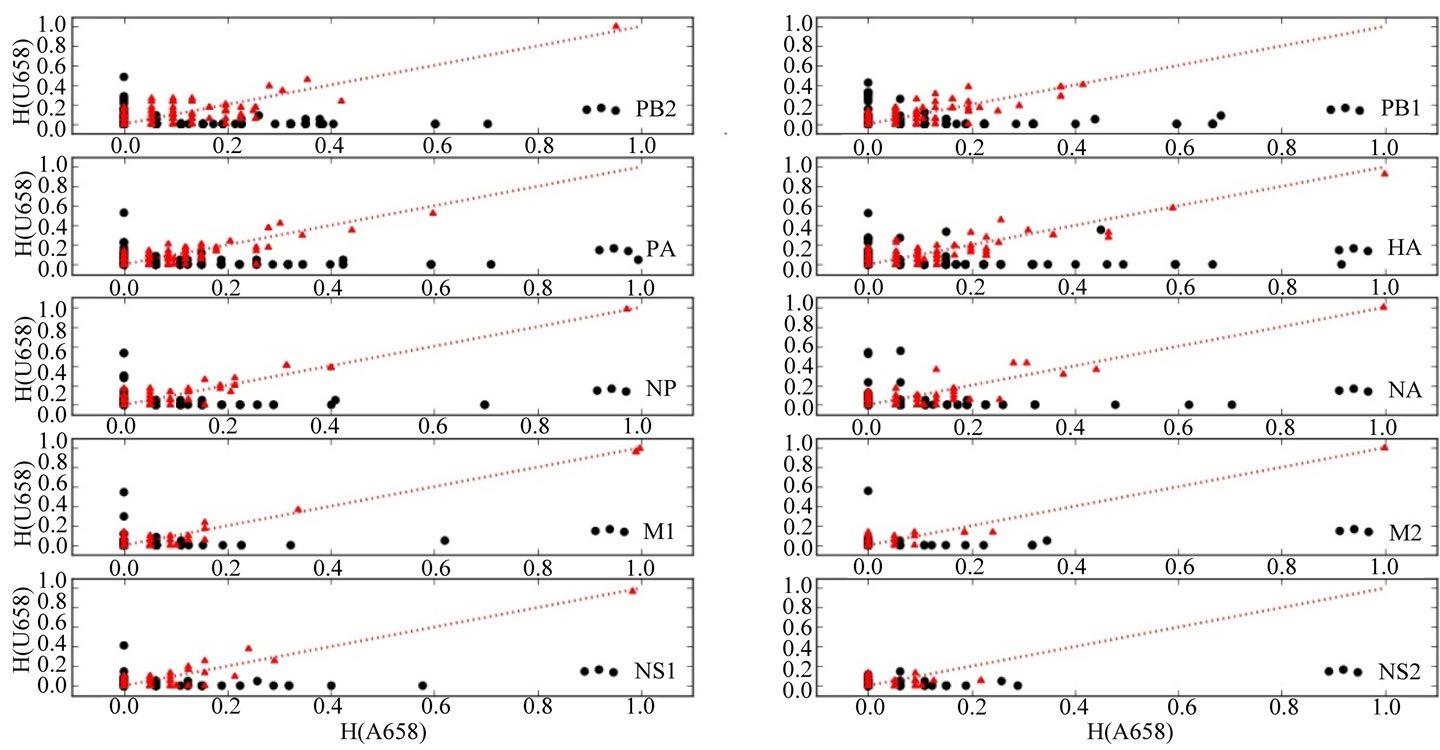
Figure 3. Relations Between Information Entropy (H) in A658 and U658 Subsets of Each Influenza Gene. H values for the A658 subset of sequences of each gene are on the abscissas; H values for the U658 subsets of sequences of each gene are on the ordinates. Genes are indicated in the lower right corner of each graph. H values for observed subsets are plotted as black circles. H values predicted for randomized sequence subsets are indicated by red triangles. The dotted red lines are straight lines with slope = 1 and intercept = 0. Entropic nucleotide positions in the A658 and U658 sequence subsets tend to vary from each other orthogonally and vary from the uniform entropic nucleotide distributions in randomly generated subsets of the sequences.

Figure 4. Mutual Information (MI) within the Genes of the Pandemic 2009 Wisconsin Influenza Viral Sequences. MI was calculated at each nucleotide position from the nucleotide counts of the A658 and U658 subsets. The influenza gene is specified in the upper left corner of each graph.

Table 1. Nucleotide Counts at Nucleotide Positions Displaying Peak Mutual Information Values. For readability, results for corresponding subsets of the same gene are similarly colored. The p value for each zscore < 2.22E-16. In each instance, the A658 and U658 nucleotide counts account for 100% of the viral sequence counts.
as a weighted graph network is shown in Figure 5. Eigenvector centrality values [12] of the genes in the graph network are (centrality values in parentheses): M1 (0.5667), PB2 (0.37704), HA (0.3770), NP (0.3759), NA (0.3486), NS1 (0.2901) and M2 (0.2181). Genes PB1, PA and NS2 are unconnected, i.e., “isolated”, with eigenvector centrality = 0.0000.
4. DISCUSSION
In the research presented here, a bioinformatic analysis was performed on the dataset of viral sequences from the 2009 H1N1 influenza pandemic in the state of Wisconsin. The Wisconsin dataset was chosen for analysis because 1) its wavelike kinetics has been shown to be associated with separation of the HA gene sequences into A658 and U658 subsets (manuscript submitted) and 2) sequence counts sufficient for statistical validity are available (see Materials and Methods for sequence counts of each gene). The present report extends the subset analysis to all of the genes of the Wisconsin 2009 pandemic influenza virus. Based upon the viral ID identifier of the reference HA gene sequence (Figures 1 and 2), the sequences of all of the genes in the Wisconsin 2009 H1N1 influenza A dataset were sorted into two subsets, depending upon whether the reference HA sequence was either A658 or U658. It was found that the H distributions of the influenza gene subset pairs differed significantly from each other and from those of randomly generated subsets (Figure 3). Determination of MI of the subsets facilitated the identification of nine nucleotide positions, distributed over seven of the influenza genes (Figure 4), at which subset sorting was associated with production of disjoint, or almost disjoint subsets of nucleotides (Table 1). The sorting of nucleotides at these nine positions produced complete, or almost complete, separation of nucleotides in the sequence subsets. Differences between nucleotide counts in the paired subsets were all statistically significant either parametrically (t-test), non-parametrically (K-S test) or by z-tests at each subset pair. The nucleotide counts were used to compute mutual information values for the correlations between all of the 72 pairs formed from the nine positions. The mutual information values were used for weighting edges in a graph network representation of the mutual information. In the evaluation of the organization of this graph network, the node representing the M1 gene was the node of greatest centrality (Figure 5). This result is especially significant because the subsets of gene sequences were formed on the basis of the viral ID identifier of the HA gene, not of the M1 gene.
The mutations at the nine positions of the influenza gene mutual information network are described in Table 2. Seven of the nine positions are sites of synonymous mutations. Three of these sites of synonymous mutation are within a single gene, the M1 gene. Edge-weighting for these three sites accounts for the high eigenvector centrality [12] of the M1 node of the graph network (Figure 5). Synonymous mutations in the M1 gene have been reported to be associated with influenza viral subtype and host specificity [13].
The centrality of the M1 node in the network may reflect the important role that M1 plays [14], in concert with other influenza components [15] in the packaging and cellular exteriorization of the virus. Moreover, these biological functions of the M1 gene, necessary for viral production, are known to be susceptible to synonymous mutation [15,16]. Thus, results presented here on bioinformatic and network levels may reflect mutationinduced alterations in M1-mediated viral packaging and exteriorization. Moreover, wave-like behavior of the 2009 influenza pandemic in Wisconsin may be associated with time required for accumulation of the coordinated, synonymous mutations into the multigenic network.
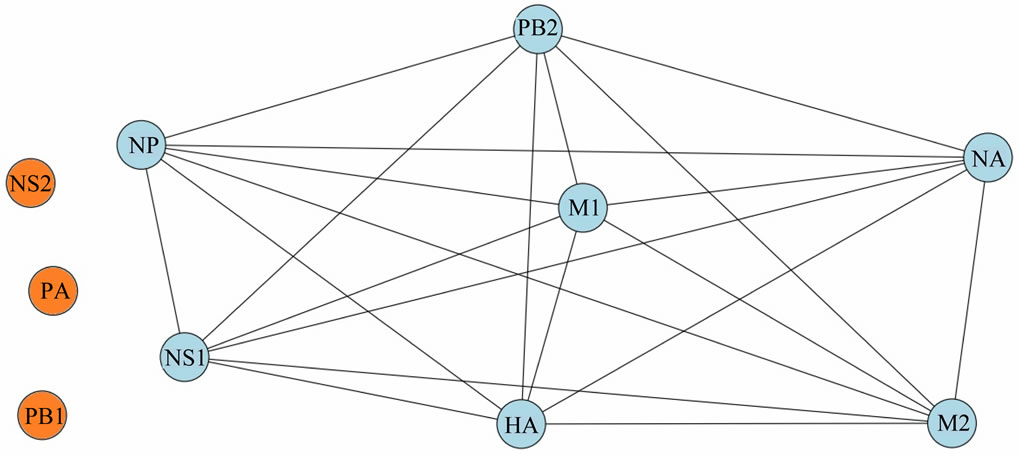
Figure 5. Representation of mutual information interactions among the genes of the pandemic 2009 Wisconsin H1N1 influenza virus as a weighted graph network. Connected genes are in blue; unconnected genes are in orange.
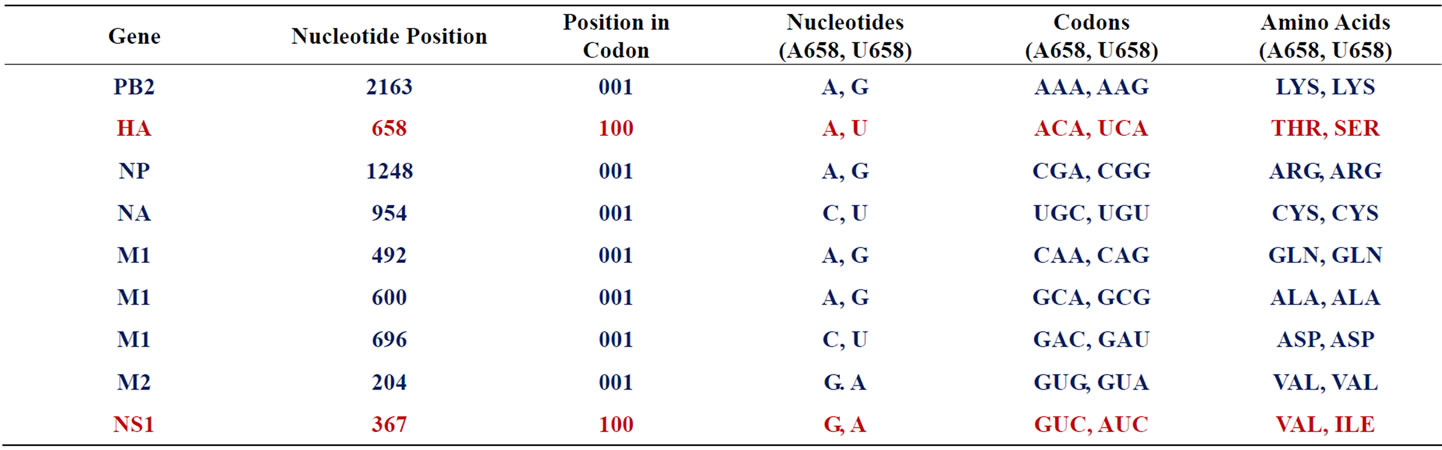
Table 2. Characterization of mutations in networked gene positions of the wisconsin 2009 pandemic influenza virus. Synonymous mutations are in purple. Non-synonymous mutations are in red. 100 = first codon position. 001 = third codon position.
5. ACKNOWLEDGEMENTS
The authors thank the Brown University Center for Computing and Visualization for providing computer facilities and ancillary support for this research. We also thank the Department of Medicine of the Alpert/Brown University School of Medicine and the Brown University Center for Computational Molecular Biology (CCMB) for their support.
REFERENCES
- World Health Organization Global Influenza Programme, 2011. http://www.who.int/csr/disease/influenza/en/
- Truelove, S.A., Chitnis, A.S., Heffernan, R.T., Karon, A.E., Haupt, T.E. and Davis, J.P. (2011) Comparison of patients hospitalized with pandemic 2009 influenza A (H1N1) virus infection during the first two pandemic waves in Wisconsin. Journal of Infectious Diseases, 203, 828-37. doi:10.1093/infdis/jiq117
- Bao, Y., Bolotov, P., Dernovoy, D., Kiryutin, B., Zaslavsky, L., Tatusova, T., Ostell, J. and Lipman, D. (2008). The Influenza Virus Resource at the National Center for Biotechnology Information. Journal of Virology, 82, 596-601. doi:10.1128/JVI.02005-07
- Python Programming Language, Official Website. http://www.python.org
- SciPy.org, Scientific Tools for Python. http://www.scipy.org
- Python Plotting. http://matplotlib.sourceforge.net
- Hagberg, A.A., Schult, D.A. and Swart, P.J. (2008) Exploring network structure, dynamics, and function using NetworkX. In: Varoquaux, G., Vaught, T. and Millman, J., Eds., Proceedings of 7th Python in Science Conference (SciPy2008), 11-15.
- Shannon, C.E. (1948) A mathematical theory of communication. The Bell System Technical Journal, 27, 379-423, 623-656.
- Hausser, J. and Strimmer, K. (2009) Entropy inference and the James-Stein estimator, with application to nonlinear gene association networks. The Journal of Machine Learning Research, 10, 1469-1484.
- Thompson, W.A., Martwick, A. and Weltman, J.K. (2009) Decimative Multiplication of Entropy Arrays, with Application to Influenza. Entropy, 11, 351-359. doi:10.3390/e11030351
- Cover, T.M. and Thomas, J.A. (1991) Elements of information theory. Chapter 2: Entropy, relative entropy and mutual information. Wiley, New York, 16-33.
- Bonacich, P. and Lloyd, P. (2001) Eigenvector-like measures of centrality for asymmetric relations. Social Networks, 23, 191-201. doi:10.1016/S0378-8733(01)00038-7
- Thompson, W.A., Fan, S. and Weltman, J.K. (2008). Information Entropy of Influenza A Segment 7. Entropy, 10, 736-744. doi:10.3390/e10040736
- Murti, K.G., Brown, P.S., Bean Jr., W.J. and Webster, R.G. (1992) Composition of the helical internal components of influenza virus as revealed by immunogold labeling/ electron microscopy. Virology, 186, 294-299. doi:10.1016/0042-6822(92)90084-3
- Tchatalbachev S., Flick, R. and Hobom, G. (2001) The packaging signal of influenza viral RNA molecules. RNA, 7, 979-989. doi:10.1017/S1355838201002424
- Hutchinson, E.C., Curran, M.D., Read, E.K., Gog, J.R. and Digard, P. (2008) Mutational Analysis of cis-Acting RNA Signals in Segment 7 of Influenza A Virus. Journal of Virology, 82, 11869-11879. doi:10.1128/JVI.01634-08
Appendix. Thompson and Weltman, 2011 Supplementary Data
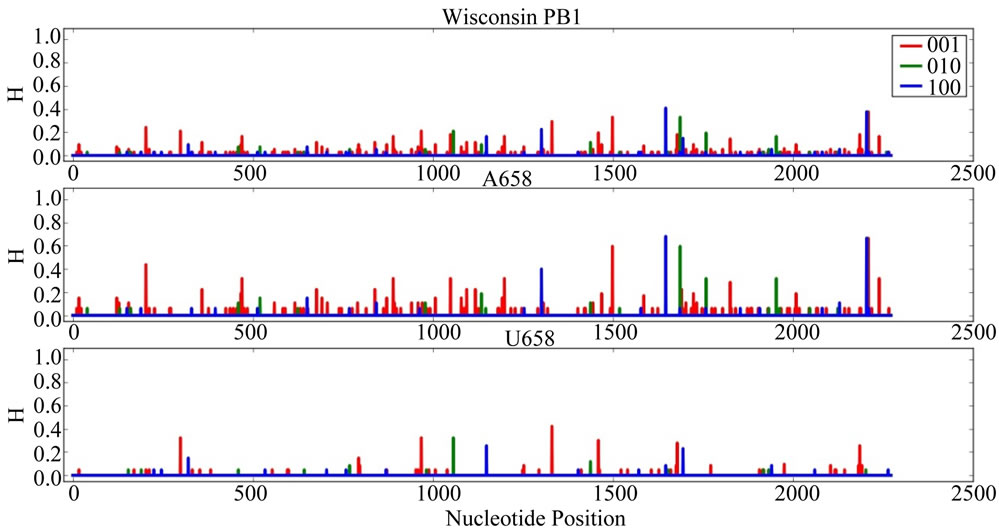
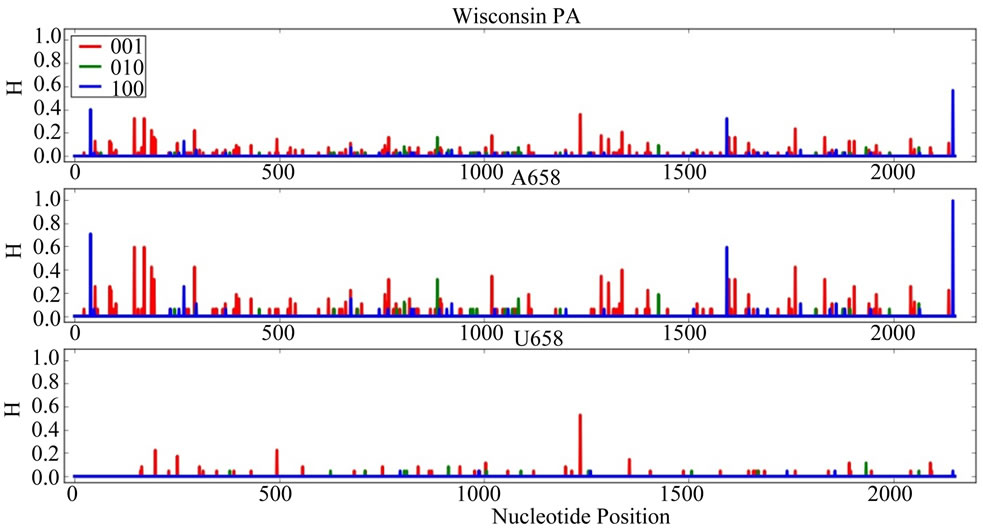
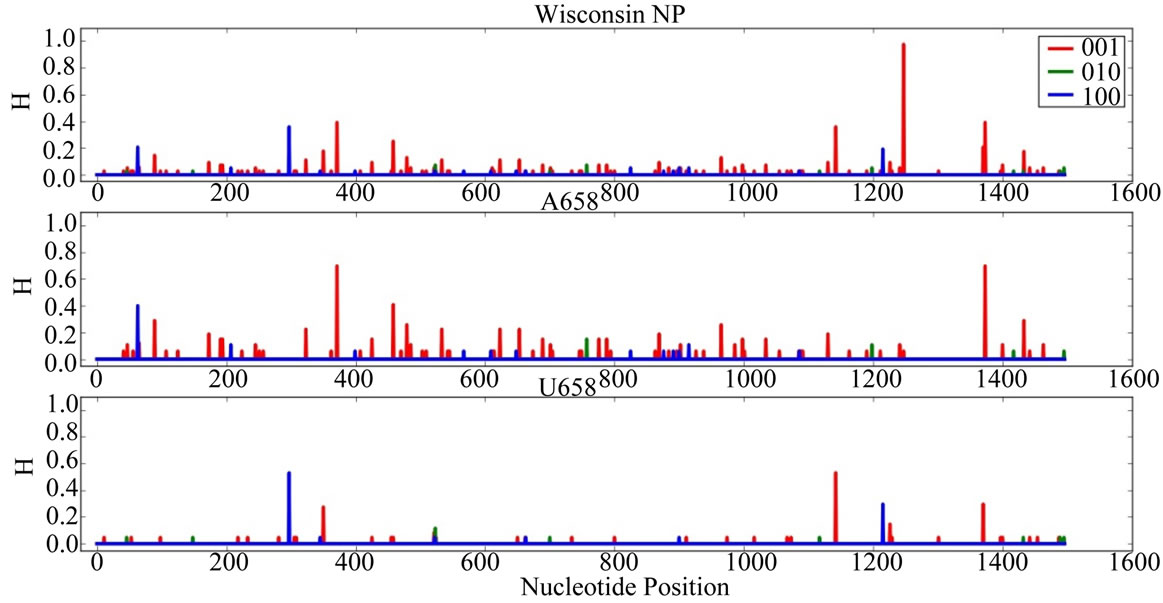
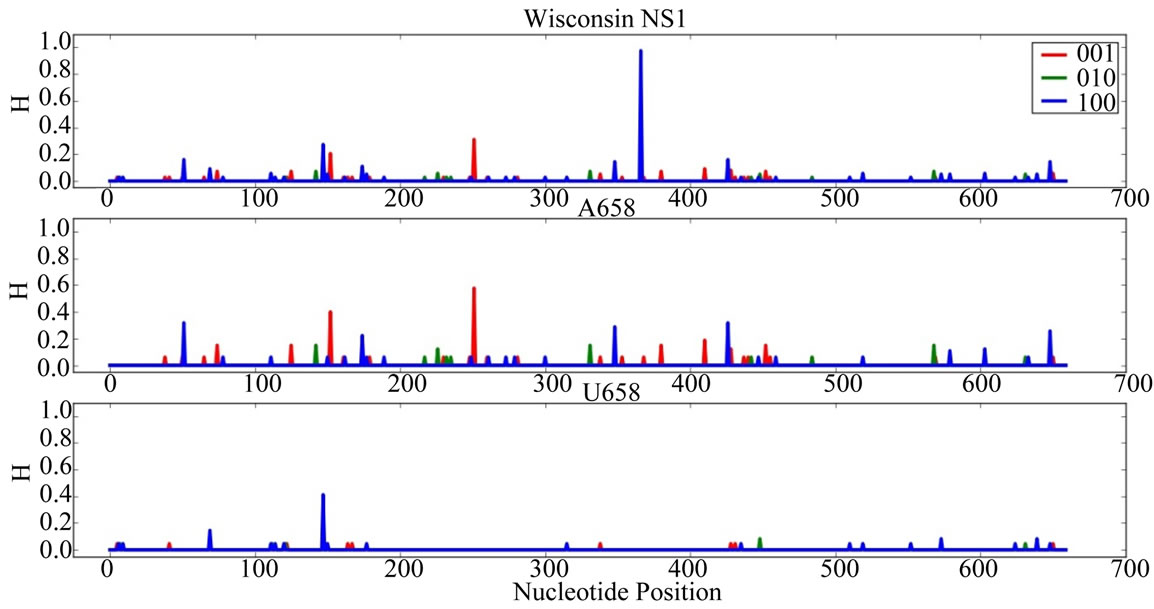
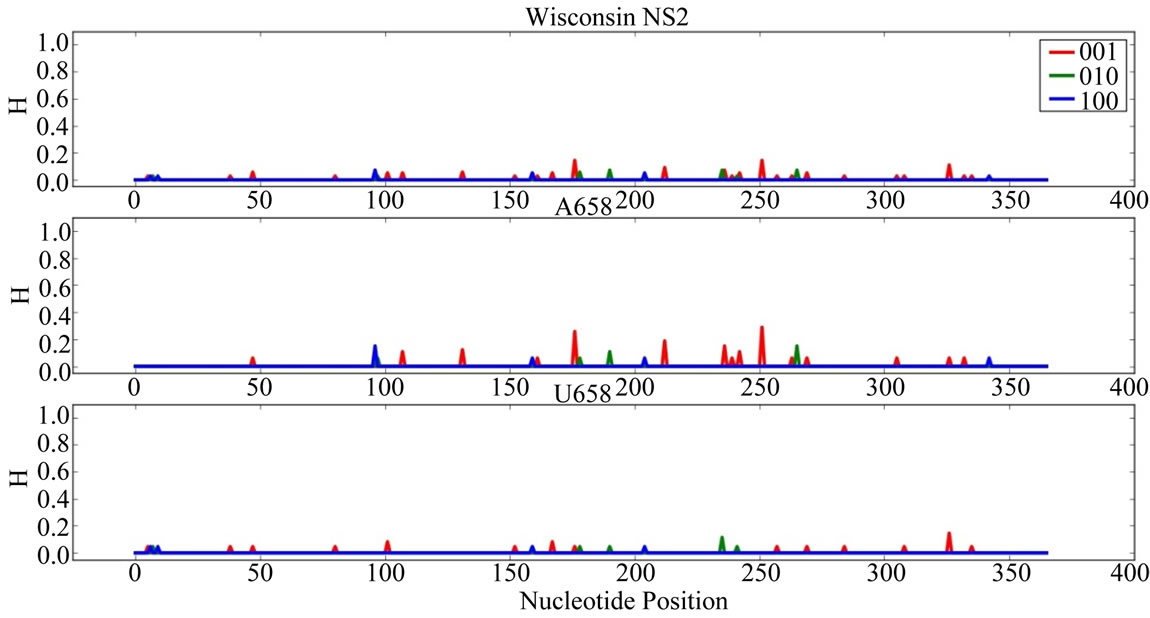
Supplementary Figures. Information Entropy (H) Distributions in Gene Sequence Sets and in A658 and U658 Subsets of the Wisconsin 2009 Pandemic H1N1 Influenza A Genes. Each gene is identified in the graph title. (upper) H distribution for the complete set of sequences of a gene (middle) H distribution for the A658 subset of the gene (bottom) H distribution for the U658 subset of the gene. H, in bits, is on each ordinate and nucleotide position is on each abscissa. Codon positions one (frame 100), two (frame 010) and three (frame 001) are indicated in blue, green and red.


Supplementary Data: Mutual Information
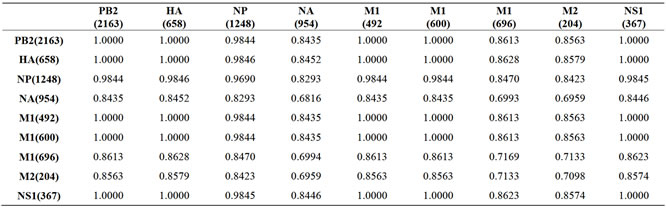
Supplementary Table: Mutual Information (MI) of Wisconsin 2009 H1N1 Pandemic Influenza A.
Nucleotide positions of the genes are in parentheses. MI is in bits.
NOTES
*The authors contributed equally to this work.
#Corresponding author.