American Journal of Operations Research
Vol.3 No.1A(2013), Article ID:27537,12 pages DOI:10.4236/ajor.2013.31A010
Hierarchical Modeling by Recursive Unsupervised Spectral Clustering and Network Extended Importance Measures to Analyze the Reliability Characteristics of Complex Network Systems
1Chair on Systems Science and the Energetic Challenge, Ecole Centrale Paris and Supelec, Paris, France
2Energy Department, Politecnico di Milano, Milano, Italy
Email: yiping.fang@ecp.fr
Received November 30, 2012; revised December 30, 2012; accepted January 13, 2013
Keywords: Complex Network System; Hierarchical Modeling; Spectral Clustering; Extended Importance Measure
ABSTRACT
The complexity of large-scale network systems made of a large number of nonlinearly interconnected components is a restrictive facet for their modeling and analysis. In this paper, we propose a framework of hierarchical modeling of a complex network system, based on a recursive unsupervised spectral clustering method. The hierarchical model serves the purpose of facilitating the management of complexity in the analysis of real-world critical infrastructures. We exemplify this by referring to the reliability analysis of the 380 kV Italian Power Transmission Network (IPTN). In this work of analysis, the classical component Importance Measures (IMs) of reliability theory have been extended to render them compatible and applicable to a complex distributed network system. By utilizing these extended IMs, the reliability properties of the IPTN system can be evaluated in the framework of the hierarchical system model, with the aim of providing risk managers with information on the risk/safety significance of system structures and components.
1. Introduction
Critical infrastructures are engineered distributed systems which provide the fundamental support to modern Industry and society. Examples are computer and communication systems, power transmission and distribution systems, rail and road transportation systems, oil/gas systems and water distribution systems. Failures of such systems can have multiple, transnational impacts of significant size [1-3]. Hence, identifying and quantifying the reliability and vulnerability of such systems is crucial for designing the adequate protections, mitigation and emergency actions against failures [2].
These systems are exposed to multiple hazards and threats, some of which are even unexpected and emergent, and consist of a large number of elements whose interactions are not easily modeled and quantified, so that a complete analysis by exhaustive treatment cannot be pursued. As a result, the performance and reliability assessment of such “complex” systems has proved to be a non-trivial task in practice.
Recent studies suggest that many real complex network systems exhibit a modularized organization [4,5]. In many cases, these modularized structures are found to correspond to functional units within networks (ecological niches in food webs, modules in biochemical networks) [6]. Broadly speaking, clusters (also called communities or modules) are found in the network, forming groups of elements that are densely interconnected with each other but only sparsely connected with the rest of the network. Furthermore, hierarchically modularized organization, which is a central idea for the life process in biology [5,7], is also found to characterize the internal structure of many technological networks [8]. This sparks the idea of utilizing the hierarchical, modularized structure as a basis to model these complex systems, for their analysis and understanding [9].
In the analysis of systems with respect to their failure behavior, Importance Measures (IMs) are used to identify the weak points and quantify the impact of component failures [10,11]. IMs provide numerical indicators to determine which components are most important for system reliability improvement or most critical for system failure. Many different IMs have been proposed in the literature [12,13], among which classical and relevant statistics are Birnbaum [14], Fussell-Vesely [15] and Criticality Importance [16,17]. However, none of these
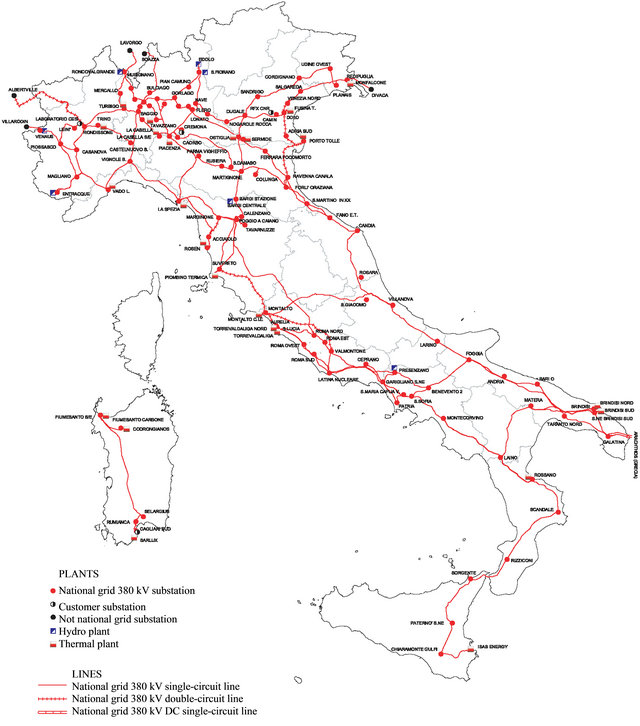
Figure 1. The 380 kV Italian power transmission network.
measures can be applied directly to complex network systems, because of the distributed character of functionality and service that they provide.
The purpose of this paper is twofold: firstly to propose a scheme of recursive clustering to obtain a hierarchical modeling framework associated with different variedsize grained virtual networks; then to introduce Extended Importance Measures (EIMs) which are compatible with the distributed characteristics of complex network systems, to evaluate the components importance in the framework of the hierarchical system representation.
The remainder of this paper is organized as follows: Section 2 presents the methodology of hierarchical modeling, taking the structure of the 380 kV Italian Power Transmission Network (IPTN) as an example for illustration; in Section 3, the basic terminal-pair connection reliability problem is first introduced, based on which the traditional IMs are extended and then calculated for the IPTN system; conclusions are drawn in Section 4.
2. Hierarchical Modeling of Complex Network System
2.1. Network Representation
Graph Theory provides a framework for the mathematical representation of complex networks. A graph is an ordered pair 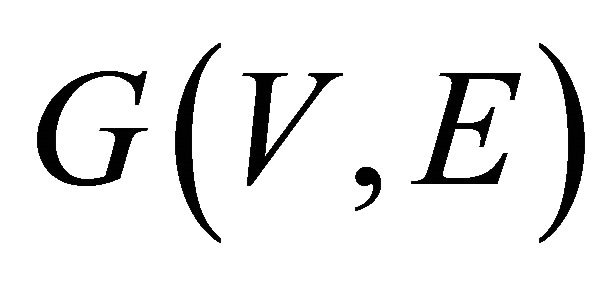 comprising a set of vertices (nodes)
 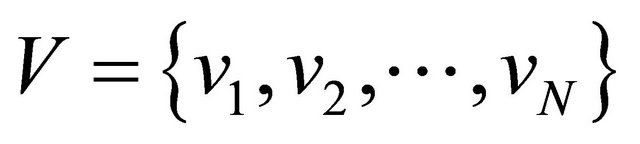 together with a set of edges (also called arcs or links)
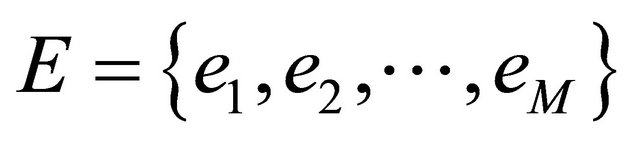 , which are twoelement subsets of V. The network structure is usually defined by the
  adjacency matrix, which defines which two nodes are connected by assigning a 1 to the corresponding element of the matrix; otherwise, the value in the matrix is 0 if there is no connection between the two nodes. As described, this type of graph is unweighted and undirected. A graph is weighted if a value (weight) is assigned to each edge representing properties of the connection like cost, reliability, capacities, etc. For example, the matrix of physical distances is often used in conjunction with the adjacency matrix to describe a network also with respect to its spatial dimension [18,19].
In this paper, we take for exemplification of the analyses proposed the 380 kV Italian power transmission network (IPTN) (Figure 1). This network is a branch of the high-voltage-level transmission network, which can be modeled as a graph of  (
( generators and
  distributors) connected by M = 171 links [20,21], defined by its
  adjacency matrix A whose entries
  are 1 if there is an edge joining node i to node j or 0 otherwise. In Figure 1, the generators, i.e. hydro and thermal power plants, are represented by squares whereas the distribution substations are represented by circles.
2.2. Construct Network Hierarchy by Successive Clustering
Modularity is ubiquitous in many networks of scientific and technological interest, ranging from the World Wide Web to biological networks [7,22]. As a result, it is often possible to identify groups of elements that are highly interconnected with each other, but have only a few links to components outside of the group to which they belong to. These communities usually combine into each other in a hierarchical manner [7], in which nodes form groups and then join the groups of groups, and so forth, starting from the lowest levels of organization (individual nodes) up to the level of the entire system. This suggests the development of a hierarchical structure to describe a complex network system at different levels of resolution, with the aim of managing the complexity of the system more effectively.
A successive Unsupervised Spectral Clustering Algorithm (USCA) [23], which is invariant to cluster shapes and densities and simple to implement, has been adopted in this study to build the hierarchical structure of the IPTN system. Cluster analysis aims at recognizing natural groups within classes of entities [24]. The problem is to assign categories to unlabelled data, encouraging the search of implicit information in the network structure encoded in its graph [25]. Consequently, modularity patterns within a complex network system can be revealed without a priori knowledge of their existence. The detailed description of different clustering methods is beyond the scope of this article. For a systematic and synthetic review, the reader is encouraged to look at [24-26].
The USCA makes use of the spectrum (eigenvalues) of the similarity matrix of the data to perform dimensionality reduction before Fuzzy c-Means (FCM)—clustering in fewer dimensions. Schematically, it is performed by the steps [23] in Table 1.
In the first step, the Laplacian matrix  is calculated from the similarity (affinity) matrix as follows. The input similarity matrix
 ![]() is of size
is of size ![]() and its generic element
and its generic element  represents the similarity between nodes i and j in the network. The diagonal components
  are set to 1 and the matrix is symmetric
 . The degree matrix
  is the diagonal matrix with diagonal entries
  defined by
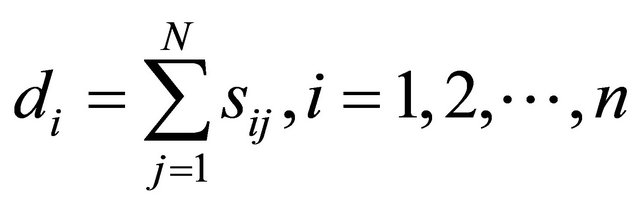 (1)
(1)
Then, the normalized graph Laplacian matrix can be obtained:
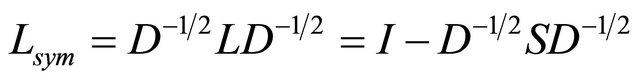 (2)
(2)
where  and
and  is the identity matrix of size
![]() .
.
By recursively operating the USCA on the data of the IPTN presented in Section 2.1 above, a 5-levels hierarchical structure of the system is constructed which contains the complete system at the top and individual elements at the bottom (the top panel of Figure 2 gives out the structure of the hierarchy, detailed in the first 3 levels).
2.3. Hierarchical Modeling of the Network
Based on the hierarchy structure resulting from the successive application of USCA, artificial networks can be
Table 1. Unsupervised spectral clustering algorithm.
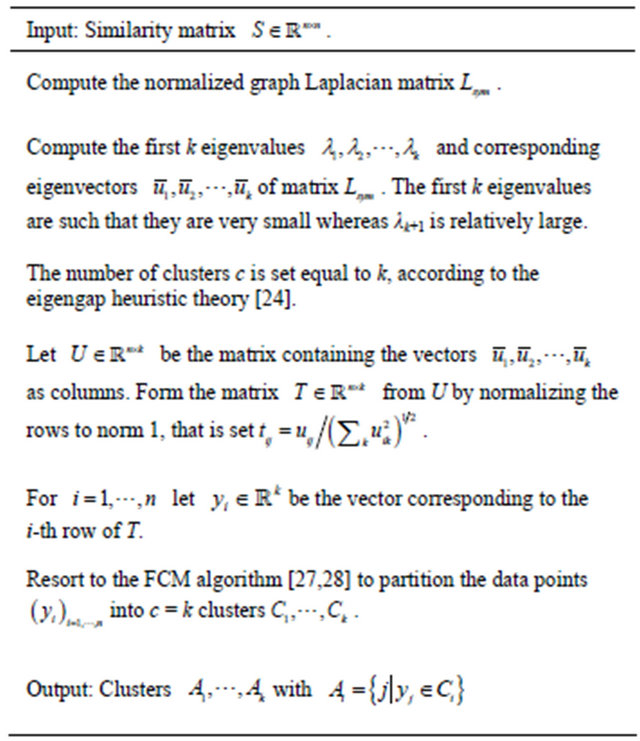
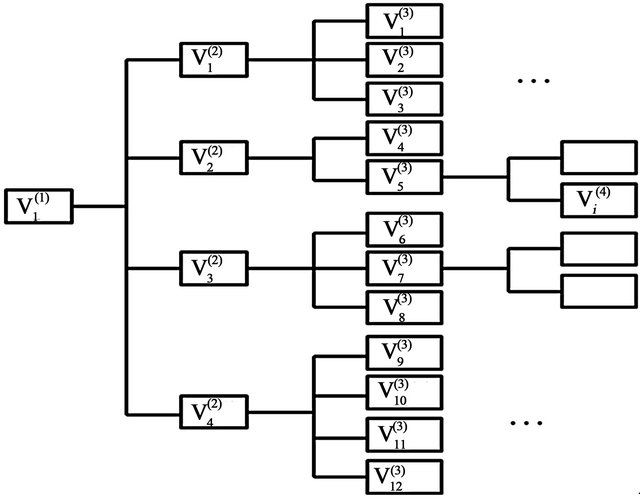
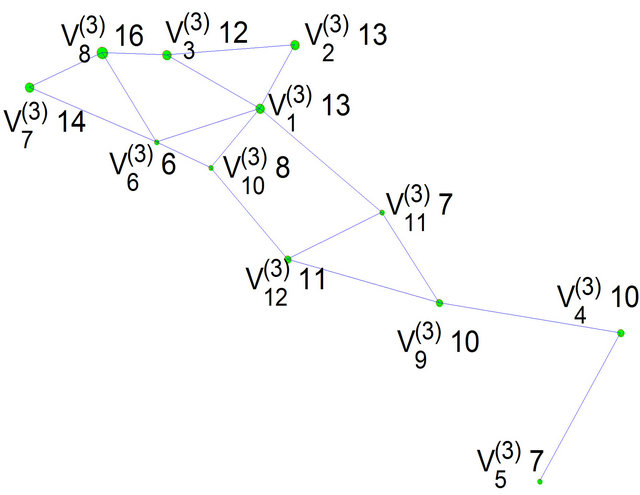
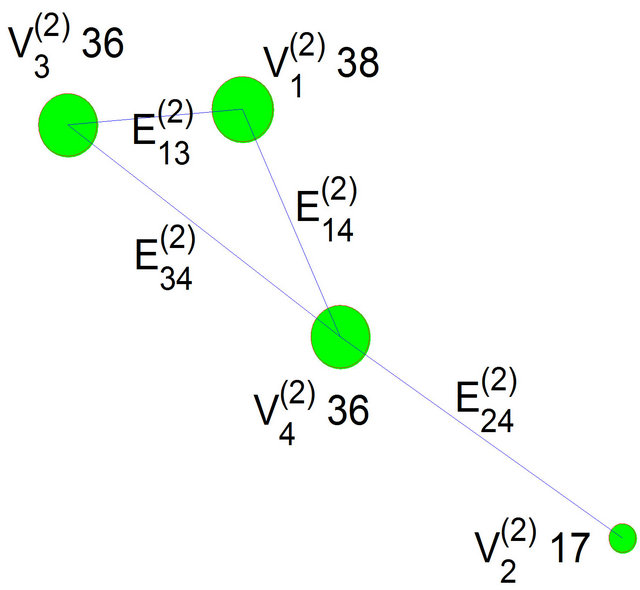

Figure 2. The hierarchy structure of the IPTN system and associated artificial networks of the first three levels.
defined at each layer. The artificial network at level l of the hierarchy is described as a graph 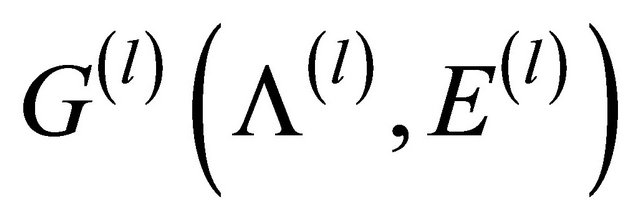 with
with , where
![]() is the number of levels of the hierarchy. We use
is the number of levels of the hierarchy. We use  to represent the artificial node i
 at level l, which corresponds to a cluster of real network nodes. Artificial nodes are connected by artificial links
 composed by those actual network links connecting (in parallel) the actual nodes in the clusters forming the artificial nodes,
 .
.
The connection pattern between artificial nodes at level l is illustrated by an adjacency matrix  whose element
 if
if i.e. if in the artificial nodes
  and
and  there is at least one actual link connecting two actual nodes, and 0 otherwise.
Figure 2 presents the hierarchy structure of the IPTN system and the artificial networks associated with the first 3 levels of the hierarchy. At the top of the hierarchy (i.e. l = 1), the network is a single unit, i.e. one artificial node , which consist of all actual nodes. At the second level
 , we have
and 
with .
.
The integer that is indicated in the Figure in proximity of the generic i-th artificial node  indicates the number of actual nodes which compose it, e.g.
  is representative of a group of 38 actual network nodes. Note that at the bottom of the hierarchy, we find the original network, i.e. each artificial node is an actual node and each artificial edge corresponds to an actual link.
The hierarchical model offers different levels of resolution at the different levels of the hierarchy. The artificial networks at the top of the hierarchy contain limited detail information of the local connectivity patterns (in the limit, only one node represents the whole network at the first level of the hierarchy); as we move down the hierarchy, more local information enters the model, at the expense of an increase in the dimension of the network. These characteristics can be leveraged efficiently to manage the complexity of a complex network system.
3. Reliability Analysis Based on the Hierarchical Model
It is known that most network reliability problems are NP-hard and therefore there is a significant gap between theoretical analysis and the ability to compute different reliability parameters for large or even moderate network systems [11]. In this respect, hierarchical modeling sets up a framework based on which reliability and vulnerability characteristics of complex network systems can be computed efficiently, thanks to the multi-scaled information representation scheme.
3.1. Terminal-Pairs Reliability Assessment
The terminal-pair or node-pair reliability (TPR) problem amounts to determining the probability of successful communication between a specified source node and a terminal node in a network, given the probability of success of each link and node in the network. Let us introduce a binary vector  to represent the state of the network, i.e. the state
 ![]() of each of its
of each of its  edges and the state
 ![]() of each of its
of each of its  nodes, where
  if edge
 ![]() is operating and 0 otherwise (
is operating and 0 otherwise (![]() for node). For simplicity of illustration, we assume that nodes cannot fail, while edges can (thus
for node). For simplicity of illustration, we assume that nodes cannot fail, while edges can (thus ![]() is no longer considered hereafter). The state of the network is defined as being non-failure if the specified terminal-pair is connected by at least one path of operating edges; otherwise it is failure. All possible failure states are included in the subset
is no longer considered hereafter). The state of the network is defined as being non-failure if the specified terminal-pair is connected by at least one path of operating edges; otherwise it is failure. All possible failure states are included in the subset  of the set
  containing all possible scenarios (failure and non-failure). An inclusive TPR analysis requires considering all elements in
 . We then define the TPR as:
 (3)
(3)
where  is a binary function which indicates the connection availability between node-pair s and d (1 = connection; 0 = no-connection). Let us assume that each edge
 ![]() has associated a probability
has associated a probability  of being operating and a probability
  of being failed; then, the TPR of the network can be calculated as:
 (4)
(4)
where  represents the state of network edge
 ![]() and
and  is the set of failed edges for a given state
 . Note that the implicit assumption underpinning Equation (4) is that the network edges are independent.
When the computational cost of the network is high (it grows exponentially with the number of network components), then, the artificial network at a suitable level of the hierarchy can be leveraged to carry out the TPR. At the generic level of the hierarchy, the artificial link  connecting nodes (clusters)
  and
and  is composed by actual network links in parallel,
 ;
;
then, the reliability of the artificial edge  at level l can be calculated by:
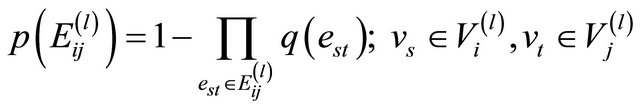 (5)
(5)
where  indicates the failure probability of the actual link
  that in the real network connects nodes
  and
and![]() .
.
Various algorithms to solve the classic TPR problem have been reported in literature, with various computational efficiencies [29-31]. A so-called Modified Dotson algorithm [30], which has been claimed and tested to subdue others in computational time, is used here for the TPR assessment based on the hierarchical modeling. The failure probability of the transmission lines in the IPTN system is computed based on outage statistics provided in [32], by assuming that the edge failure probability is proportional to its length with an average failure rate  occ/100 mile-year, and average outage duration time t = 64.81 hours/occ.
In Figure 3 right-panel, the connection reliability between nodes 1 and 127 in the IPTN network system (left panel in Figure 3) is shown as resulting from evaluations at each of the five levels of the hierarchical model described in the previous section. The right panel of Figure 3 gives the probabilities of connectivity failure between nodes 1 and 127 from level 2 to level 5 (top) and
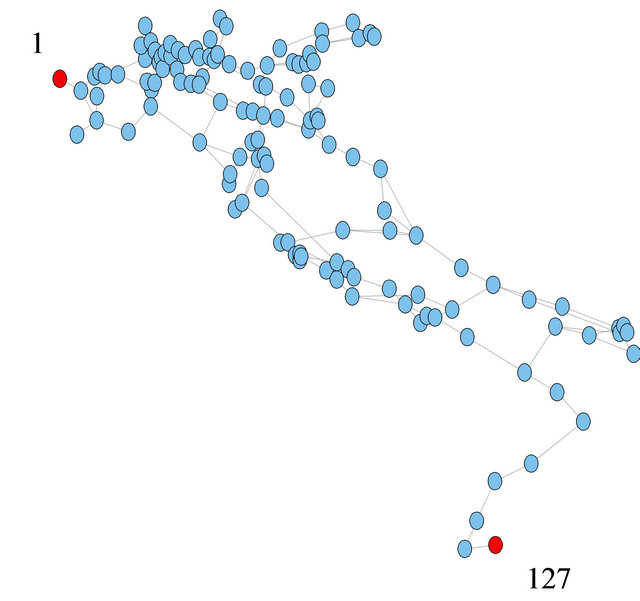
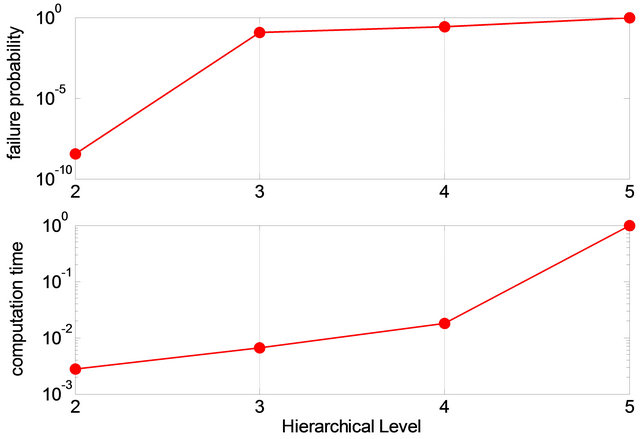
Figure 3. Illustrative example of terminal pair reliability assessment of IPTN system.
the computational time needed for the analysis (bottom); the values have been normalized with respect to the maximum values of connectivity failure probability and computational time, which occur at the bottom of the hierarchy (level 5) corresponding to the whole network. The result at the first level has not been shown since its value is simply 0, i.e., node 1 and 127 are in a single unit and will not disconnect. One can see that the difference between the actual and estimated failure probabilities decreases as the assessment moves downs to the bottom of the hierarchy, balanced by the computation time which instead increases significantly. The decision maker can obtain satisfying estimations of the failure probability at a hierarchical level of lower complexity, e.g. level 3, thus saving significantly in computation time.
3.2. Component Extended Importance Measures
Component importance measures are widely used in system engineering to identify components within the system that most significantly influence the system behavior with respect to reliability, risk and/or safety. The indications drawn are valuable for establishing direction and prioritization of actions, related to reliability improvement during system design and optimization of operation and maintenance.
A well known IM is the so called Birnbaum IM defined as (with reference to system reliability , as the system performance indicator) [14]:
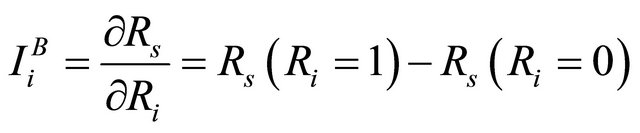 (6)
(6)
where  is the Birnbaum Importance (BI) of component i;
  represents the reliability of the system;
  is the reliability of component i ;
  is the system reliability calculated assuming that component i is perfectly operating and
  the system reliability in the opposite case of component i failed. The BI measures the significance of component i to system reliability by the rate at which system reliability improves with the reliability of component i. As shown in Equation (6), the BI of component i does not depend on
  itself, so that two components i and j may have a similar value
  although they have different reliability values
  and
and , respectively; this could be seen as a limitation of BI.
The Criticality Importance (CI) measure overcomes the above limitation by considering component unreliability [17]. It is defined as:
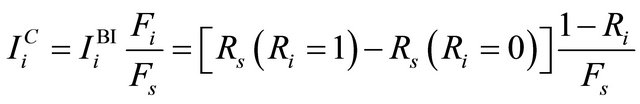 (7)
(7)
where  is the unreliability of component i and
  is the system unreliability. Now, a less reliable component is more critical than another one with same value of BI.
Fuessell & Vesely [15] proposed an alternative importance measure according to which the importance of a component in the system depends on the number and on the order of the cut sets in which it appears [17]. Most commonly used as a risk reduction indicator, Fuessell & Vesely Importance (FVI) quantifies the maximum decrement in system reliability caused by a particular component being failed :
:
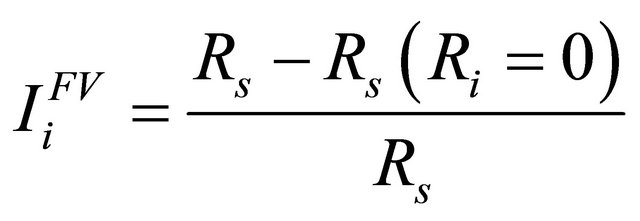 (8)
(8)
The previously proposed IMs (BI, CI and FVI) are functionally different. They evaluate subtly different properties of the system behavior, and therefore, are often used in a complementary fashion to infer different information. To apply the IMs for analyzing a network system such as the IPTN, it is necessary to extend the definition of the IMs to account for the multiple terminal or node pairs (e.g. generator-distributor pairs) where connectivity defines the network functionality.
Specializing such extension for the analysis of the importance of components of the IPTN system, we introduce the Extended Birnbaum Importance (EBI) measure as the average of all BI values obtained considering all possible Generator-Distributor pairs reliabilities in the network system:
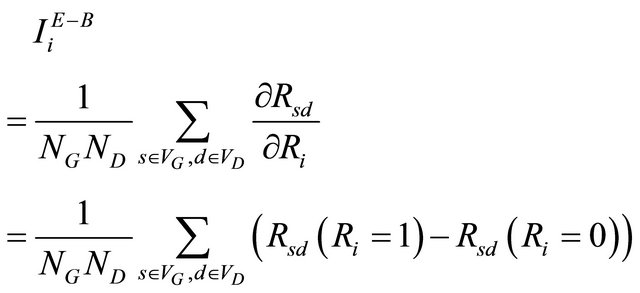 (9)
(9)
where  and
and  are the number of generators and distributors in the network respectively;
  and
and  are sets of node generators and distributors respectively;
  is the TPR between node s and node d;
  and
and  represent the terminal pair reliabilities between node s and node d, in the condition that component i is perfectly operating and completely failed, respectively.
Similarly, we can define Extended Criticality Importance (ECI) and Extended Fussell & Vesely Importance (EFVI) measures:
 (10)
(10)
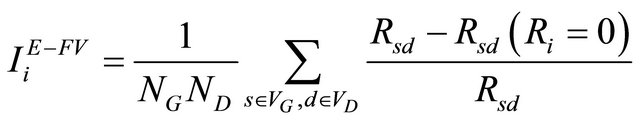 (11)
(11)
where  is the Extended Criticality Importance (ECI) measure of component i and
  is the Extended Fussell & Vesely Importance measure.
3.3. Numerical Example: Results and Discussions
The EIMs introduced have been calculated for the IPTN system at different levels of the hierarchical model of the system developed. For the evaluation, an artificial node functions as a generator as long as there is at least one actual generator node within it; otherwise it is simply a distributor.
Tables 2 and 3 report the results of the importance assessment (EBI, EFVI are given in Table 2 and ECI in Table 3) for the artificial edges of the network at level 2 of the hierarchy. For EBI and EFVI, all components in the artificial network have the same importance rank, but with slight differences between EBI and EFVI values, and the artificial edge {2-4} is the most important in the artificial network (see the bottom panel of Figure 2). This is due to the fact that this artificial edge is the only possible link between a generator in artificial node  and the distributors in other artificial nodes, and thus its disconnection would cause a large-scale generator-distributor connectivity failure. The rank based on the ECI is different from that of EBI and EFVI, and the most important artificial edge is {3-4}; the difference lies in the definition, as discussed before: EBI depends only on the structure of the system and not on the reliability of the considered component, whereas ECI takes the unreliability of the component into consideration, and in fact, the artificial edge {3-4} is made of only one actual edge with relatively high probability of failure, which leads to the highest ECI value.
By combining the indications of EBI and ECI, it is advisable to offer advices to the decision maker for the purpose of system maintenance and operation optimization [10]. When EBI & EFVI is high and ECI is low like in the case of artificial edge {2-4}, the system safety can be improved by protecting against failure of each component, e.g., adding alternative edges between artificial node  and node
  (or
(or ). For the case of low EBI & EFVI and high ECI (artificial edge {3-4}), the decision maker should invest in improvements of the component itself, to decrease the failure probability.
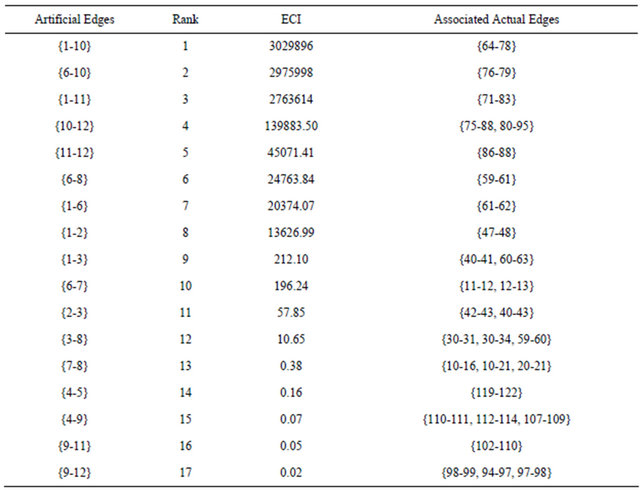
Tables 4 and 5 report the evaluation results at level 3 of the hierarchy. Fictitious edge {4-9}, composed by actual edges {110-111, 112-114, 107-109}, has highest EBI and EFVI values but relatively low ECI value (ranked 15th among all 17 artificial edges), indicating that the system reliability is highly sensitive to its failure, whereas the component itself is relatively reliable. On the contrary, the artificial edge {1-10} composed by only one actual edge {64-78} is highly unreliable itself, and its EBI and EFVI values are both ranked 8th among all 17 edges. It is important to pay attention to these artificial edges with both relatively high EBI & EFVI ranks and ECI ranks, which means not only that their failures cause a significant deterioration of the system reliability but also that they are vulnerable themselves. In this respect, by combining Tables 4 and 5, we find that artificial edges {1-11} (whose actual network link is {71-83}), {6-10} (which is composed by actual link {76-79}), and {10-12} (which is composed by actual links {75-88, 80-95}) are the three artificial edges most critical for the system reliability.
The bold edges in Figure 4 represent the edges of the actual network system which have resulted most critical based on the extended importance measure evaluation carried out at level 3 of the hierarchy model. These edges should be paid special attention. For links {110-111, 112-114, 107-109}, improving the defense in depth against
Table 2. EBI and EFVI at level 2 of the hierarchical model.
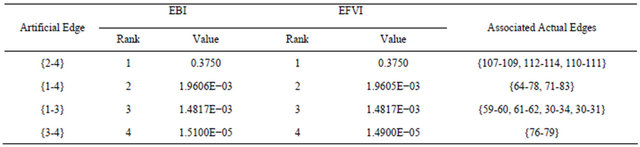
Table 3. ECI at level 2 of the hierarchical model.
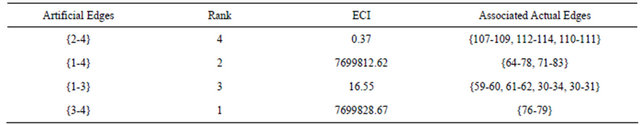
Table 4. EBI and EFVI at level 3 of the hierarchical model.
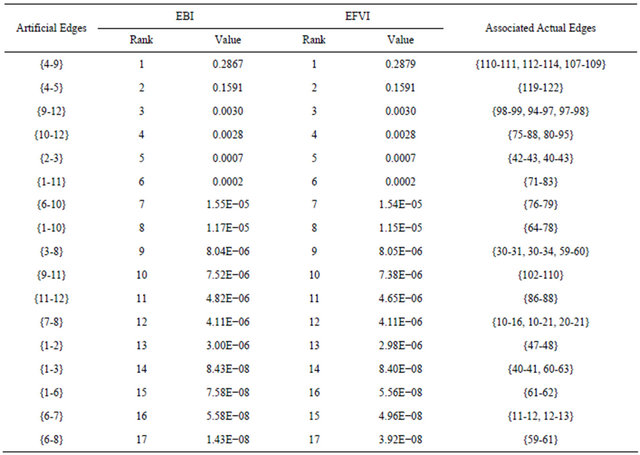
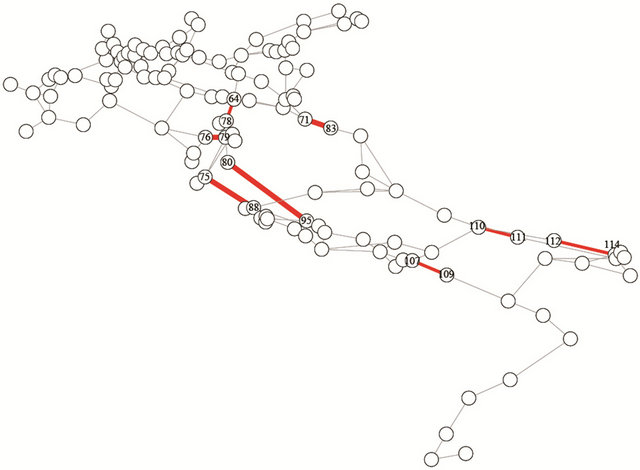
Figure 4. Most critical edges at level 3 of the hierarchical model.
Table 5. The results of ECI assessment at level 3 of the hierarchical model.
their failures is advisable to improve the reliability of the system, while for links {64-78, 71-83, 76-79, 80-95, 75-88}, the edge unreliability should also be mitigated.
Tables 6 and 7 report the results of the EIMs evaluation at level 4 of the IPTN hierarchical model. It turns out that artificial edge {7-11} (corresponding to actual link {119-122}) has the highest EBI and EFVI values and artificial edge {1-22} (corresponding to actual link {64-78}) has the highest ECI rank and relatively high EBI and EFVI ranks, indicating its criticality to system reliability.
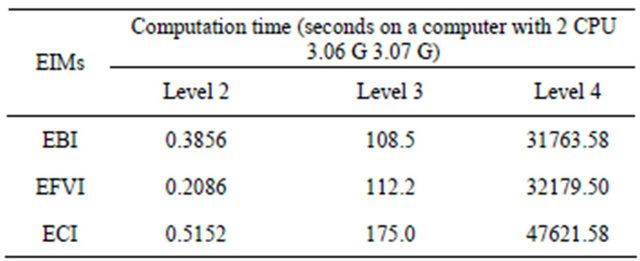
Finally, Table 8 reports the computation times required for the calculations of the EIMs at different levels in the hierarchy: as expected, the more we go down in the hierarchy the higher the computation time.
4. Conclusions
The modeling and analysis of complex network systems is a non-trivial task. Related decision-making regarding reliability and vulnerability is limited by computational resources.
In this work, we have introduced a framework for hierarchical modeling of complex network systems, which leads to the definition of different varied-size grained artificial networks. The construction of the hierarchical model is obtained by a recursive unsupervised spectral clustering method. The hierarchical model thereby obtained provides a multi-scaled representation of the original network system, with more detailed information but high complexity at the lower levels of the hierarchy, and simplified structure but relatively low complexity at the higher levels. The availability of different scales of modeling resolution allows a flexible management of the analysis, at the level of details desired for its purposes. The 380 kV Italian Power Transmission Network (IPTN) has been taken as an illustration.
Furthermore, Importance Measures (IMs) such as Birnbaum, Fuessell & Vesely and Criticality, have been extended for application to the terminal-pair reliability problem in complex distributed network systems.
The calculation of the extended IMs at different levels of the hierarchical system modeling has demonstrated the effectiveness of the proposed hierarchical modeling, with the IM-ranking of the IPTN elements offering insights on how to improve the system against failures of most critical elements.
5. Acknowledgements
The authors are thankful to Dr. Giovanni Sansavini of Politecnico di Milano for supporting the work with rele-
Table 6. EBI and EFVI at level 4 of the hierarchical model (only the top 20 elements are reported).
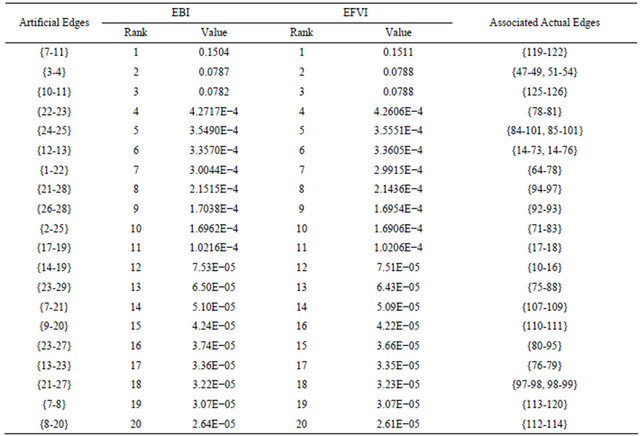
Table 7. ECI at level 4 of the hierarchical model (only the top 20 elements are reported).
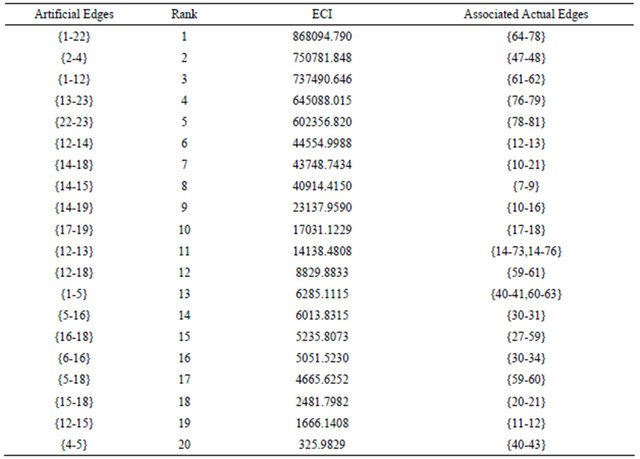
Table 8. EIMs evaluation time at each level of the hierarchical model.
vant information on the network structure used as reference system and to Dr. Yanfu Li of Supelec for fruitful discussions.
REFERENCES
- W. Kröger, “Critical Infrastructures at Risk: A Need for a New Conceptual Approach and Extended Analytical Tools,” Reliability Engineering & System Safety, Vol. 93, No. 12, 2008, pp. 1781-1787. doi:10.1016/j.ress.2008.03.005
- E. Zio, “Reliability Engineering: Old Problems and New Challenges,” Reliability Engineering & System Safety, Vol. 94, No. 2, 2009, pp. 125-141. doi:10.1016/j.ress.2008.06.002
- W. Kröger and E. Zio, “Vulnerable Systems,” Springer, Berlin, 2011. doi:10.1007/978-0-85729-655-9
- A. Mason, J. Onnela and P. Mucha, “Communities in Networks,” Notices of the American Mathematical Society, Vol. 56, No. 9, 2009, pp. 1082-1166.
- S. Fortunato, “Community Detection in Graphs,” Physics Reports, Vol. 486, No. 3, 2010, pp. 75-174. doi:10.1016/j.physrep.2009.11.002
- B. Karrer, E. Levina and M. Newman, “Robustness of Community Structure in Networks,” Physical Review E, Vol. 77, No. 4, 2008, Article ID: 046119. doi:10.1103/PhysRevE.77.046119
- A. Clauset, C. Moore and M. E. J. Newman, “Hierarchical Structure and the Prediction of Missing Links in Networks,” Nature, Vol. 453, No. 7191, 2008, pp. 98-101. doi:10.1038/nature06830
- M. Sales-Pardo, R. Guimerá, A. Moreira, A. Moreira and L. A. N. Amaral, “Extracting the Hierarchical Organization of Complex Systems,” Proceedings of the National Academy of Sciences, Vol. 104, No. 39, 2007, pp. 15224- 15229. doi:10.1073/pnas.0703740104
- C. Gómez, M. Sánchez-Silva and L.Duenas-Osorio, “Clustering Methods for Risk Assessment of Infrastructure Network Systems,” In: Faber, Köhler and Nishijima, Eds., Applications of Statistics and Probability in Civil Engineering, CRC Press, Boca Raton, 2011.
- M. Van der Borst and H. Schoonakker, “An Overview of PSA Importance Measures,” Reliability Engineering & System Safety, Vol. 72, No. 3, 2001, pp. 241-245. doi:10.1016/S0951-8320(01)00007-2
- I. Gertsbakh and Y. Shpungin, “Network Reliability Importance Measures: Combinatorics and Monte Carlo Based Computations,” WSEAS Transactions on Computers, Vol. 7, No. 4, 2008, pp. 216-227.
- E. Zio, “Computational Methods for Reliability and Risk Analysis,” World Scientific Publishing, Singapore, 2009. doi:10.1142/7190
- E. Zio, “Risk Importance Measures,” Safety and Risk Modeling and Its Applications, Springer, Berlin, 2011.
- Z. W. Birnbaum, “On the Importance of Different Components in a Multicomponent System,” In: P. R. Krishnaiah, Ed., Multivariate Analysis II, Academic Press, New York, 1969.
- J. B. Fussell, “How to Hand-Calculate System Reliability and Safety Characteristics,” IEEE Transactions on Reliability, Vol. 24, No. 3, 1975, pp. 169-174. doi:10.1109/TR.1975.5215142
- M. C. Cheok, W. P. Gareth and R. Sherry, “Use of Importance Measures in Risk-informed Regulatory Applications,” Reliability Engineering & System Safety, Vol. 60, No. 3, 1998, pp. 213-226. doi:10.1016/S0951-8320(97)00144-0
- J. F. Espiritu, D. W. Coit and U. Prakash, “Component Criticality Importance Measures for the Power Industry,” Electric Power Systems Research, Vol. 77, No. 5, 2007, pp. 407-420. doi:10.1016/j.epsr.2006.04.003
- V. Latora and M. Marchiori, “Economic Small-World Behavior in Weighted Networks,” The European Physical Journal B—Condensed Matter and Complex Systems, Vol. 32, No. 2, 2003, pp. 249-263. doi:10.1140/epjb/e2003-00095-5
- U. Brandes and T. Erlebach, “Network Analysis: Methodological Foundations,” Springer, Berlin, 2005.
- E. Zio and G. Sansavini, “Component Criticality in Failure Cascade Processes of Network Systems,” Risk Analysis, Vol. 31, No. 8, 2011, pp. 1196-1210. doi:10.1111/j.1539-6924.2011.01584.x
- V. Rosato, S. Bologna and F. Tiriticco “Topological Properties of High-Voltage Electrical Transmission Networks,” Electric Power Systems Research, Vol. 77, No. 2, 2007, pp. 99-105. doi:10.1016/j.epsr.2005.05.013
- E. Ravasz and B. Albert-László, “Hierarchical Organization in Complex Networks,” Physical Review E, Vol. 67, No. 2, 2003, Article ID: 026112. doi:10.1103/PhysRevE.67.026112
- U. Von Luxburg, “A Tutorial on Spectral Clustering,” Statistics and Computing, Vol. 17, No. 4, 2007, pp. 395-416. doi:10.1007/s11222-007-9033-z
- A. K. Jain, M. Narasimha Murty and P. J. Flynn, “Data Clustering: A Review,” ACM Computing Surveys, Vol. 31, No. 3, 1999, pp. 264-323.
- M. Filippone, F. Camastra, F. Masulli and S. Rovetta, “A Survey of Kernel and Spectral Methods for Clustering,” Pattern Recognition, Vol. 41, No. 1, 2008, pp. 176-190. doi:10.1016/j.patcog.2007.05.018
- S. E. Schaeffer, “Graph Clustering,” Computer Science Review, Vol. 1, No. 1, 2007, pp. 27-64. doi:10.1016/j.cosrev.2007.05.001
- S. Leguizemón, H. Pelgrum and S. Azzali, “Unsupervised Fuzzy C-means Classification for the Determination of Dynamically Homogeneous Areas,” Revista SELPER, Vol. 12, No. 12, 1996, pp. 20-24.
- M. Alata, M. Molhim and A. Ramini, “Optimizing of Fuzzy C-Means Clustering Algorithm Using GA,” World Academy of Science, Engineering and Technology, Vol. 1, No. 5, 2008, pp. 224-229.
- W. Dotson and J. Gobien, “A New Analysis Technique for Probabilistic Graphs,” IEEE Transactions on Circuits and Systems, Vol. 26, No. 10, 1979, pp. 855-865. doi:10.1109/TCS.1979.1084573
- Y. B. Yoo and N. Deo, “A Comparison of Algorithms for Terminal-pair Reliability,” IEEE Transactions on Reliability, Vol. 37, No. 2, 1988, pp. 210-215.
- C.-C. Jane, W.-H. Shen and Y.-W. Laih, “Practical Sequential Bounds for Approximating Two-Terminal Reliability,” European Journal of Operational Research, Vol. 195, No. 2, 2009, pp. 427-441. doi:10.1016/j.ejor.2008.02.022
- A. A. Chowdhury and D. O. Koval, “High Voltage Transmission Equipment Forced Outage Statistics Including Different Fault Types,” Proceedings of the 10th International Conference on Probabilistic Methods Applied to Power Systems, 25-29 May 2008, pp. 1-8, 25-29.