New Journal of Glass and Ceramics
Vol. 2 No. 4 (2012) , Article ID: 23634 , 5 pages DOI:10.4236/njgc.2012.24022
Synthesis and Characterization of Cadmium Containing Sodium Borate Glasses
![]()
1Department of Physics, Punjabi University, Patiala, India; 2Department of Physics, Guru Nanak Dev University, Amritsar, India.
Email: vandana@yahoo.com, spsingh@yahoo.com, gurmelmudahar@yahoo.com, kulwantsthind@yahoo.com
Received June 10th, 2012; revised July 12th, 2012; accepted July 26th, 2012
Keywords: Sodium Borate Glasses; Optical Band Gap; Molar Volume; UV-VIS and FTIR Spectroscopy and Bandgap Energy
ABSTRACT
Glass system (80% B2O3 – (20 – y)% Na2CO3 – y% CdO, where y = 3, 6, 9, 12 and 15 mol%) prepared by meltquenching technique and checked by XRD technique reveals the amorphous nature of these glasses. Increases in density from 2.18 to 2.82 (g/cm3) were observed with an increase in CdO content. Ultraviolet-Visible (UV-VIS) absorption spectra of polished parallel surfaces glass samples showed a decrease in the optical band gap from 3.72 to 3.59 eV with increasing CdO content. The results suggest that CdO content in glass samples plays a role as a network modifier. In addition, a correlation between the results from density, UV-VIS and FTIR measurements indicates that change in the atomic structure is due to the formation of BO4 units.
1. Introduction
In recent years, the physical, electrical, optical mechanical and magnetic properties of pure and various transition and rare earth metal ions doped borate glasses are under investigation. Semiconducting glasses can be generally divided into two groups, chalcogenide glasses and oxide glasses, containing transition metal ions. Oxide glasses containing transition metals such as cadmium, copper, etc. exhibit semiconducting properties [1-8]. These glasses are potential candidates for electrical memory and optical switching devices [9-11], cathode materials for making solid devices and optical fiber [12-14]. Glasses containing high concentration of transition metal ions are electronic conductors [15-17]. This classifies them as a form of amorphous semiconductors.
The borate glasses are quite useful as they are relatively easy to obtain and moreover, there appears a large variety of structural units in their over a wide range of modifier concentration [18-19]. In borate glasses, B2O3 is a basic glass former because of its higher bond strength, lower cation size, smaller heat of fusion and valence 3 of B. In borate glasses, B3+ ions triangularly coordinated by oxygen form glasses easily. In B2O3 the units are traingles, which are corner bonded in a random configuration [20]. The addition of sodium carbonate helps in forming BO4 groups and non bridging oxygen.
In the present work, an attempt has been made for the preparation and optical characterization of sodium borate glasses with the addition of cadmium oxide. To study the short range structure of glasses i.e. the immediate surroundings of the absorbing atoms, we use the UV-VIS absorption spectra of the samples. Also, the optical properties of solids depend on the nature and local arrangement of the constituent atoms or ions. We report the molar volume, IR spectra and UV-VIS spectra of the glass samples.
2. Experimental Techniques
2.1. Sample Preparation
The glass samples {80% B2O3 – (20 – y)% Na2CO3 – y% CdO, here y = 3, 6, 9, 12 and 15 mol%} were prepared by weighing the appropriate amounts of chemically reagent grade powders of CdO, and B. The chemical composition of the prepared glasses is listed in Table 1.
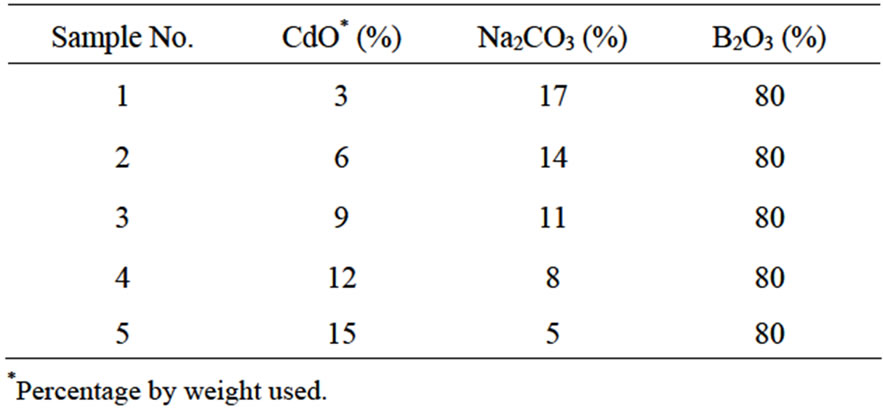
Table 1. Composition of Prepared Samples.
Melting was performed in porcelain crucibles placed in an electric furnace for about 2 h at temperatures ranging from 973˚C - 1100˚C. The homogenized molten glass was cast in graphite blocks. After quenching the glass, all the samples were immediately transferred to annealing furnace. All the samples were annealed at 400˚C.
In order to confirm the amorphous nature of the glass samples, X-ray diffraction (XRD) study was made on each glass sample using Rigaku Mini-flex Table Top spectrometer with Cu-Kα line of wavelength λ = 1.5418 Å at the scanning rate of 20/min and 2θ was varied from 10˚ to 80˚.
The density of glass samples at room temperature was measured by the standard principle of Archimedes using a sensitive microbalance with pure benzene as the immersion fluid. The density was calculated according to the known formula
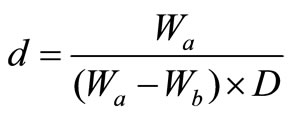 (1)
(1)
where Wa is the weight of the sample in air, Wb is the weight of the sample in benzene and D is the density of buoyancy at room temperature. All the measurements were made using a digital balance (M/S Sartorius, model BP 221S, USA). The experiment was repeated five times to get an accurate value of density. The overall accuracy in the density measurements was ±0.5 kg·m–3 and hence, the percentage error in the measurements of density was ±0.006 g·cm–3.
The molar volume values were calculated by using the obtained densities and weight of one mole of the sample, with the help of the following equation:
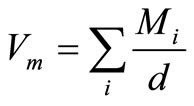 (2)
(2)
Mi denotes the molar mass of the glass and Mi = CiAi. Here Ci and Ai are the molar concentrations and molecular weights of the ith component, respectively and d is measured density.
3. Results and Discussion
3.1. XR Diffraction Analysis
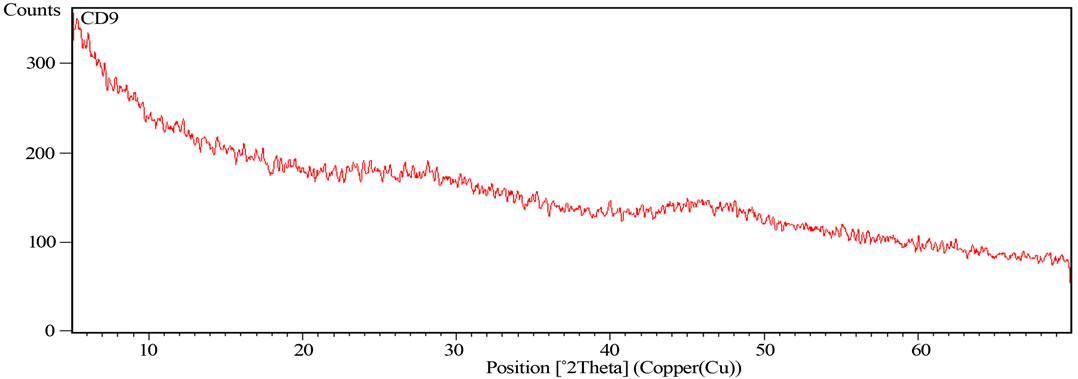
The powder XR diffraction analysis of some of the prenpared samples is shown in Figure 1. This figure exhibits no detectable peaks thus confirms the amorphous nature of the glass samples.
 (a)
(a)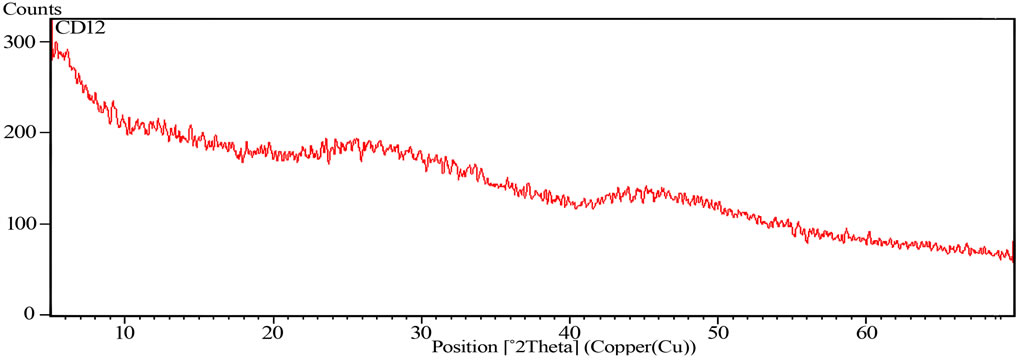 (b)
(b)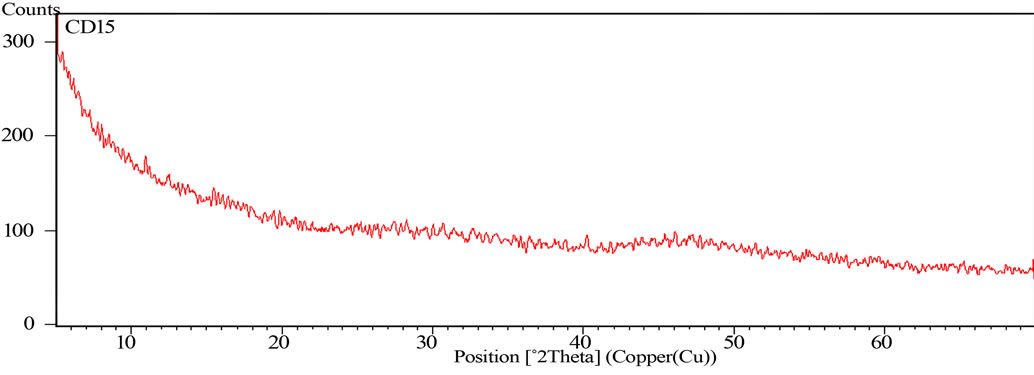 (c)
(c)
Figure 1. XRD of the samples for different glass compositions.
3.2. Density and Molar Volume
The density measurement is considered to be a very important tool to detect the structural changes in the glassnetwork. The density is supposed to change abruptly when the structure of the glass is slightly changed. On the other hand, the molar volume of glass can be preferably used to describe the network structure and the arrangement of the building units, since it deals directly with the spatial structure of the oxygen network. The density and calculated molar volume values are shown in Table 2.
The network formed by primary glass forming oxides such as B2O3 contains a large no. of interstices and with addition of network modifiers density increases. In the present study also, density is observed to increase with the increase of CdO content. This increase can be attributed to conversion of BO3 into 4-fold coordinated boron atoms as BO4. The increase in density may be because of replacement of low density sodium element (0.97 gm·cm–3) by high density cadmium element (8.65 gm·cm–3) [21]. Also non-bridging oxygen decreases in the glass network with increasing CdO content, which tends to consolidate their structure, maintaining homogeneity of the glasses and thus increasing density [22]. All these observations verify the role of CdO as network modifier. Molar volume indicates the spatial distribution of the oxygen in the glass network. The decrease in the molar volume can be attributed to closing up of structure of glasses. Increase in CdO content leads to substitution of longer ionic Na-O bond with shorter covalent bond i.e. the formation of B-O-B linkages with strong covalent B and Cd oxygen bond, leading to close structure [23].
3.3. FTIR Analysis
For structural analysis of oxide glasses the following information is required [24]:
1) Type of the bridging bonds of oxygen which link the coordination polyhedra of framework and the composition of chemical inhomogeneities in the structure of glass;
2) The coordination number of the compound with respect to oxygen, especially of network formers;
3) The change in oxygen bonds of the framework, induced by the cations modifiers which combine with those bonds.
Borate glasses provide an ideal case, in comparison to other glass forming systems, to demonstrate the effect-
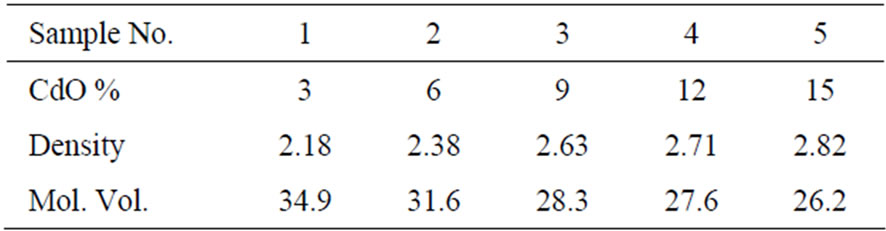
Table 2. The density and molar volume for different CdO contents.
tiveness of infrared spectroscopy in glass science [25]. Boron has smallest mass as compared to the other network forming elements, and thus the main vibrational modes associated with the glass network appear well above 500 cm–1 (in the mid-infrared region) [26]. These network modes are well separated from the metal ion site vibrational modes which are active in the far infrared region [27-29]. The ability of boron to change its coordination number with oxygen between three and four provides a range of anionic environment that can coordinate the modifying metal ions.
In the present glass system, predominantly 8 bands are observed (Figure 2). The band 540 - 580 cm–1 is due to vibrations of sodium cations through the glass network. The band 640 - 675 cm–1 can be attributed to bending vibrations of BO3 triangles and stretching vibrations of BO3 units with non bridging oxygens respectively. The band around 740 cm–1 can be due to vibration of the linkage between tetrahedral and triangle borate groups.
The band 850 - 885 cm–1 can be attributed to stretching vibration of B-O bond of BO4 units. The shoulder in the band 1076 cm–1 appears to shift at higher energy on going to sample No. 6. This may be due to vibrations of diborate bridging to pentaborate groups, and to the asymmetric and stretching vibrations of BO4 groups [25]. A prominent band appeared at 1187 cm–1 which seems to be absent in sample with lowest cadmium oxide concentration indicates that there is formation of four co-ordinated boron units with the addition of cadmium oxide which is also in accord with the observed results for density.
The band 1450 - 1510 cm–1 can be assigned to B-O stretching vibrations mainly due to the linkage between oxygen and different groups as well as B-O bridging between boroxol rings and trigonal BO3 [2,20]. The bands around 1650 cm–1 and 2333 cm–1 are attributed to O-H bending that give rise to absorption in this region and the possibility of some adsorbed water.
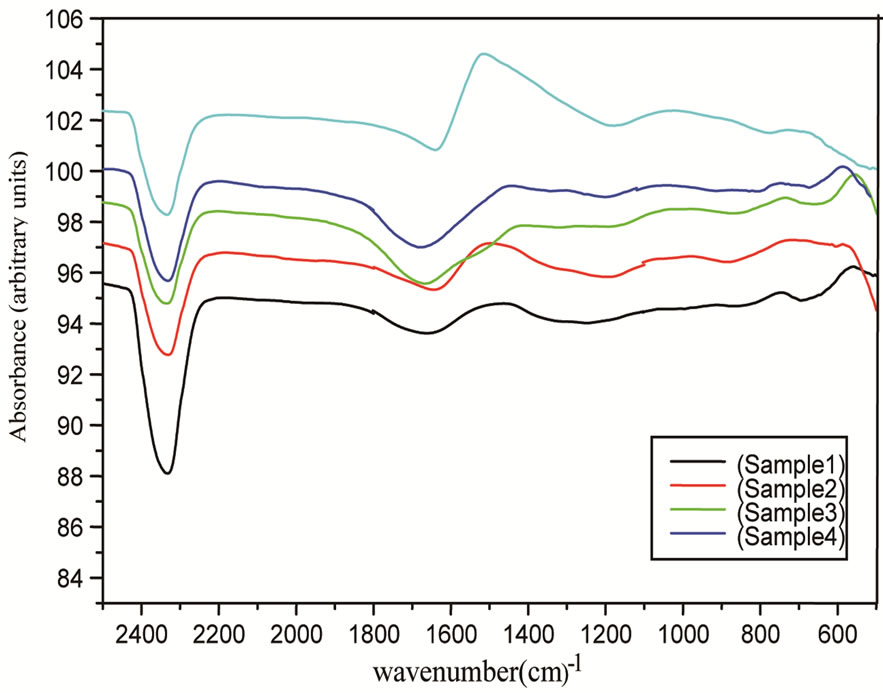
Figure 2. FTIR spectra of glass samples for different contents of CdO.
3.4. Optical Band Gap
Analysis of optical spectra is one of the most beneficial tools to figure out the electronic structures of amorphous semiconductors [30]. Measurement of the optical absorption coefficient (α) near the fundamental absorption edge is particularly a standard method for the investigation of optically induced electronic transitions in many materials. Two types of optical transitions, i.e. direct and indirect, occur at the absorption edge [31]. The absorption coefficient, below and near the edge of each curve was determined at different wavelengths using relation:
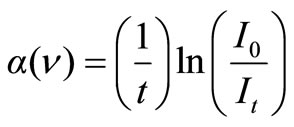 (3)
(3)
where I0 and It are intensities of the incident and transmitted beams, respectively and t corresponds to thickness of each sample. Optical band gaps were calculated using absorption spectra for direct and indirect transitions for all prepared glass samples.
For direct transitions:
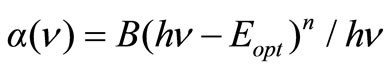 (4)
(4)
where n = 1/2 for allowed transition, B is a constant and Eopt is direct optical band gap.
Above relation is also used for indirect transitions. In this equation, n = 2 for allowed transition, B is a constant and Eopt is indirect optical band gap. Using above equations and by plotting (αhν)1/2 and (αhν)2 as a function of photon energy hν, optical band gaps for indirect and direct transitions could be found, respectively. The respective values of Eopt were obtained by extrapolating to (αhν)1/2 = 0 for indirect transitions and (αhν)2 = 0 for direct transitions [32].
Urbach energy values (ΔE) were calculated by taking the reciprocals of the slopes of linear portion in the lower photon energy region of these curves as stated with relation (5) [33].
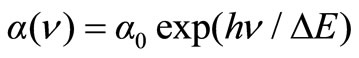 (5)
(5)
Figures 3-5 show the plots for indirect band gap, direct band gap and Urbach energies for the prepared samples and their values are listed in Table 3. It is noticed that Eopt decreases with increasing CdO content. Decrease in bandgap is also reported to be due to formation of four coordinated boron units which is also implied by observed
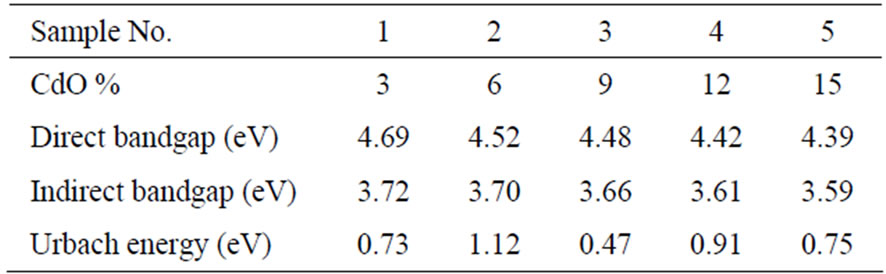
Table 3. The direct, indirect bangap values and the Urbach energies for different CdO contents.
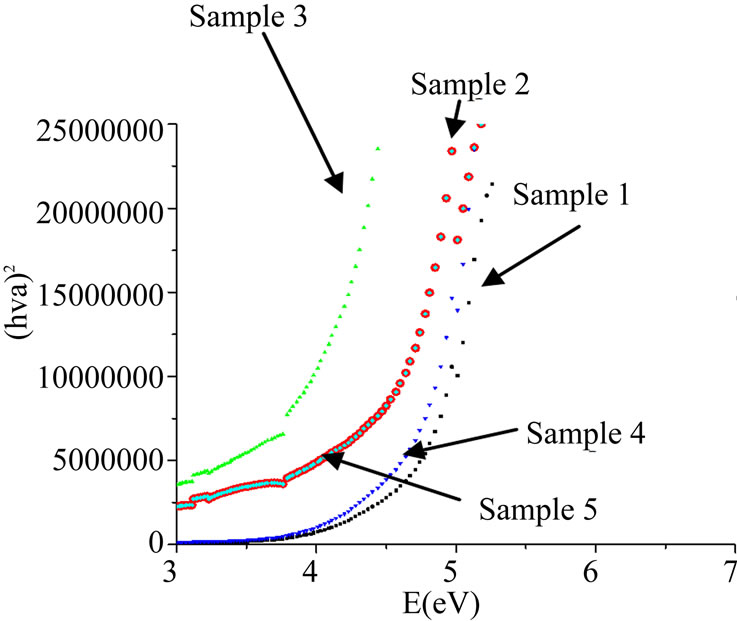
Figure 3. Indirect transitions.
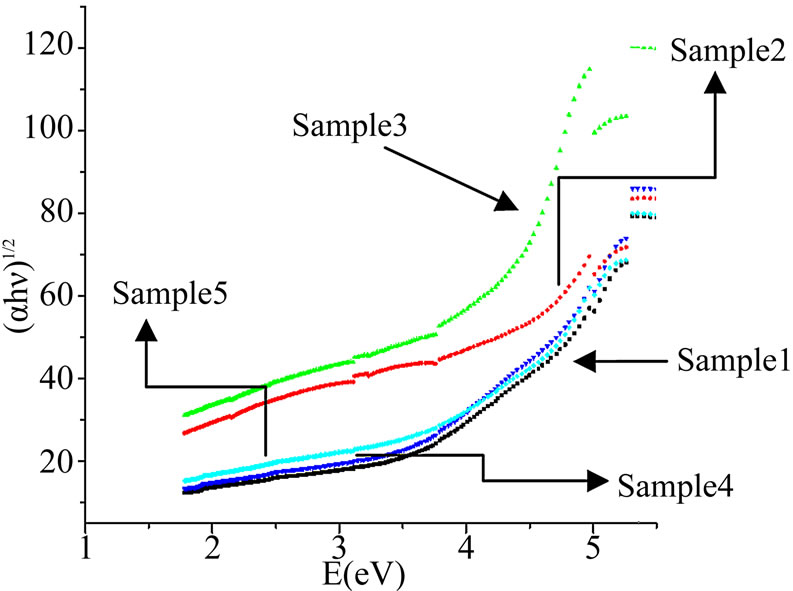
Figure 4. Direct transitions.
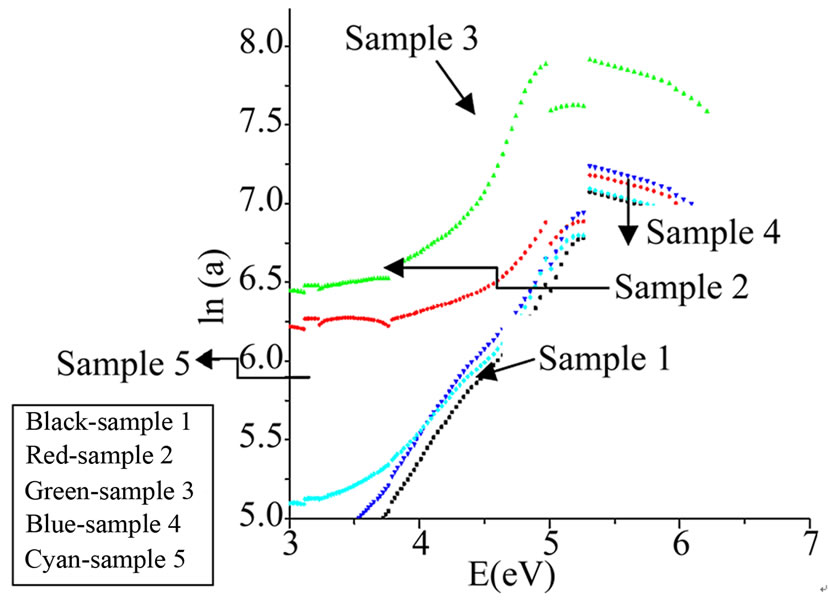
Figure 5. Urbach energy.
band at 1187 cm–1of FTIR spectra. There must be some change in bonds which is reflected by lowering of band gap values. The noticed change may also arise from the photon-lattice interaction. The decrease in bandgap is also due to decrease of NBO and also the formation of bridging oxygen that changes the absorption characteristics. This also is in accord with our results for density i.e. the formation of BO4 units at the expense of BO3 units with the increase of CdO content. The observed changes are seen due to increase in CdO content which supports the role of CdO as network modifier.
4. Conclusion
The prepared samples were found to be in pure non crystalline phase. The density of the glass samples increases gradually on increase of CdO content. The molar volume appears to decrease due to closing up of structure of glasses. The groups like BO3 and BO4 act as network structural groups while sodium and cadmium appeared in interstitial positions. The optical energy gap (Eopt), for indirect allowed transitions showed a decrease with increasing the CdO content. The studied glass systems obey the Urbach rule due to the dependence of the absorption coefficient (α) on photon energy and the indirect band gaps are found to be 3.59 - 3.72 eV. The value of the width of the tails of localized states (ΔE) varied between 0.47 and 1.12 eV depending on the CdO content. The results obtained from the density, FTIR spectroscopy and bandgap energy measurements are in agreement with each other and give approximately the similar information about the present glasses.
REFERENCES
- S. Sindhu, S. Sanghi, A. Agarwal, Sonam, V. P. Seth and N. Kishore, “The Role of V2O5 in the Modification of Structural, Optical and Electrical Properties of Vanadium Barium Borate Glasses,” Physica B: Condensed Matter, Vol. 365, No. 1-4, 2005, pp. 65-75. doi:10.1016/j.physb.2005.04.037
- M. Toderaş, S. Filip, I. Ardelean and J. Optoelectron, “Structural Study of the Fe2O3-B2O3-BaO Glass System by FTIR Spectroscopy,” Advanced Materials, Vol. 8, No. 3, 2006, p. 1121.
- A. Ghosh, S. Bhattacharya and A. Ghosh, “Optical and Other Structural Properties of Some Zinc Vanadate Semiconducting Glasses,” Journal of Alloys and Compounds, Vol. 490, 2010, p. 480.
- N. F. Mott and E. A. Davis, “Electronic Processes in NonCrystalline Materials,” Clarendon Press, Oxford, 1979.
- N. F. Mott, “Conduction in Glasses Containing Transition Metal Ions,” Journal of Non-Crystalline Solids, Vol. 1, No. 1, 1968, pp. 1-17. doi:10.1016/0022-3093(68)90002-1
- M. Sayer and A. Mansingh, “Transport Properties of Semiconducting Phosphate Glasses,” Physical Review B, Vol. 6, No. 12, 1972, pp. 4629-4643. doi:10.1103/PhysRevB.6.4629
- G. D. Khattak, A. Mekki and L. E. Wenger, “X-Ray Photoelectron Spectroscopy (XPS) and Magnetic Susceptibility Studies of Vanadium Phosphate Glasses,” Journal of Non-Crystalline Solids, Vol. 355, No. 43-44, 2009, pp. 2148-2155. doi:10.1016/j.jnoncrysol.2009.06.042
- E. R. Shaaban, M. Y. Hassan, A. G. Mostafa and A. M. Abdel-Ghany, “Crystallization Kinetics of New Compound of V2O5-PbO-Li2O-Fe2O3 Glass Using Differential Thermal Analysis,” Journal of Alloys and Compounds, Vol. 482, No. 1-2, 2009, pp. 440-446. doi:10.1016/j.jallcom.2009.04.062
- J. Livage, J. P. Jollivet and E. Tronc, “Electronic Properties of Mixed Valence Oxide Gels,” Journal of NonCrystalline Solids, Vol. 121, No. 1-3, 1990, pp. 35-39. doi:10.1016/0022-3093(90)90100-Z
- A. Ghosh, “Memory Switching in Bismuth-Vanadate Glasses,” Journal of Applied Physics, Vol. 64, No. 5, 1988, pp. 2652-2655. doi:10.1063/1.341605
- P. Pascuta, G. Borodi and E. Culea, “Influence of Europium Ions on Structure and Crystallization Properties of Bismuth Borate Glasses and Glass Ceramics,” Journal of Non-Crystalline Solids, Vol. 354, No. 52-54, 2008, pp. 5475-5479. doi:10.1016/j.jnoncrysol.2008.09.010
- G. D. Khattak and A. Mekki, “Structure and Electrical Properties of SrO-Borovanadate (V2O5)0.5(SrO)0.5- y(B2O3)y Glasses,” Journal of Physics and Chemistry of Solids, Vol. 70, No. 10, 2009, pp. 1330-1336. doi:10.1016/j.jpcs.2009.06.023
- R. A. Montani, M. Levy and J. L. Souquet, “An Electrothermal Model for High-Field Conduction and Switching Phenomena in TeO2 V2O5 Glasses,” Journal of NonCrystalline Solids, Vol. 149, No. 3, 1992, pp. 249-256. doi:10.1016/0022-3093(92)90073-S
- A. Ghosh and B. K. Chaudhuri, “Anomalous Conductivity and Other Properties of V2O5-P2O5 Glasses with Bi2O3 or Sb2O3,” Journal of Non-Crystalline Solids, Vol. 103, No. 1, 1988, pp. 83-92. doi:10.1016/0022-3093(88)90419-X
- I. Kashif, S. A. Rahman, A. A. Soliman, E. M. Ibrahim, E. K. Abdel-Khalek, A. G. Mostafa and A. M. Sanad, “Effect of Alkali Content on AC Conductivity of Borate Glasses Containing Two Transition Metals,” Physica B: Condensed Matter, Vol. 404, No. 21, 2009, pp. 3842-3849. doi:10.1016/j.physb.2009.07.102
- L. Murawski, C. H. Chung and J. D. Mackenzie, “Electrical Properties of Semiconducting Oxide Glasses,” Journal of Non-Crystalline Solids, Vol. 32, No. 1-3, 1979, pp. 91-104. doi:10.1016/0022-3093(79)90066-8
- M. Sayer, A. Mansingh, M. Pollak, et al., “Noncrystalline Semiconductors,” CRC Press, Boca Raton, 1987.
- D. L. Griscon, “Electron Spin Resonance,” Glass Science and Technology, Vol. 48, 1990, pp. 151-251.
- D. L. Griscon, “Materials Science Research—Borate Glasses 12,” Plenum Press, New York, 1978.
- S. G. Motke and S. P. Yawale, “Infrared Spectra of Zinc Doped Lead Borate Glasses,” Bulletin of Material Science,” Bulletin of Material Science, Vol. 25, No. 1, 2002, pp.75-78.
- A. Chahine, M. Et-tabirou and J. L. Pascal, “FTIR and Raman Spectra of the Na2O-CuO-Bi2O3-P2O5 Glasses,” Materials Letters, Vol. 58, No. 22-23, 2004, pp. 2776-2780. doi:10.1016/j.matlet.2004.04.010
- T. Abe, “Borosilicate Glasses,” Journal of the American Ceramic Society, Vol. 35, No. 11, 1952, pp. 284-299. doi:10.1111/j.1151-2916.1952.tb13051.x
- A. A. Soliman, “XRD, DTA and Density studies of Lithium Borate Glasses Containing Copper,” Armenian Journal of Physics, Vol. 29, No. 3, 2008, pp. 188-197.
- L. Stoch and M. Sroda, “Infrared Spectroscopy in the Investigation of Oxide Glasses Structure,” Journal of Molecular Structure, Vol. 511-512, 1999, pp. 77-84. doi:10.1016/S0022-2860(99)00146-5
- E. I. Kamitsos, “Infrared Studies of Borate Glasses,” Glass Physics and Chemistry, Vol. 44, 2003, pp. 79-87.
- A. J. Karki, S. Feller, H. P. Lim, J. Stark, C. Sanchez and M. J. Shibata, “The Density of Sodium-Borate Glasses Related to Atomic Arrangements,” Journal of Non-Crystalline Solids, Vol. 92, No. 1, 1987, pp. 11-19. doi:10.1016/S0022-3093(87)80355-1
- H. P. Lim and S. A. Feller, “The Density of Low Metal Content Rubidium, Cesium, Silver, and Thallium Borate Glasses Related to Atomic Arrangements,” Journal of Non-Crystalline Solids, Vol. 94, No. 1, 1987, pp. 36-44. doi:10.1016/S0022-3093(87)80258-2
- H. P. Lim, A. Karki, S. A. Feller, J. E. Kasper and G. Sumcad, “The Density of Potassium Borate Glasses Related to Atomic Arrangements,” Journal of Non-Crystalline Solids, Vol. 91, No. 3, 1987, pp. 324-332. doi:10.1016/S0022-3093(87)80343-5
- R. D. Shannon, “Crystal Physics, Diffraction, Theoretical and General Crystallography,” Acta Crystallographica Section A, Vol. 32, No. 5, 1976, pp. 751-767. doi:10.1107/S0567739476001551
- D. T. Pierce and W. E. Spicer, “Electronic Structure of Amorphous Si from Photoemission and Optical Studies,” Physical Review B, Vol. 5, No. 8, 1972, pp. 3017-3029. doi:10.1103/PhysRevB.5.3017
- M. Altaf, M. A. Chaudhry and M. Zahid, “Study of Optical Band Gap of Zinc-Borate Glasses,” Journal of Research (Science), Vol. 14, No. 2, 2003, pp. 253-259.
- R. P. S. Chakradhar, K. P. Ramesh, J. L. Rao and J. Ramakrishna, “Mixed Alkali Effect in Borate Glasses—EPR and Optical Absorption Studies in xNa2O-(30-x) K2O-70B2O3 Glasses Doped with Mn2+,” Journal of Physics and Chemistry of Solids, Vol. 64, No. 4, 2003, pp. 641-650. doi:10.1016/S0022-3697(02)00365-7
- K. Subrahmanyam and M. Salagram, “Optical Band Gap Studies on (55-x)Na2O-xPbO-45P2O5 (SLP) Glass System,” Optical Materials, Vol. 15, No. 3, 2000, pp. 181-186. doi:10.1016/S0925-3467(00)00033-1