New Journal of Glass and Ceramics
Vol.2 No.1(2012), Article ID:16978,6 pages DOI:10.4236/njgc.2012.21004
Physical Properties of Nano-Composite Silica-Phosphate Thin Film Prepared by Sol Gel Technique
![]()
Department of Solid State Physics, National Research Center (NRC), Guiza, Egypt.
Email: *szbasha@yahoo.com
Received August 19th, 2011; revised October 11th, 2011; accepted October 22nd, 2011
Keywords: Sol-Gel; Nano-Composite SiO2-P2O5 Thin Film; Scanning Electron Microscopy (SEM); XRD and FTIR
ABSTRACT
A series of nano-composites silica-phosphate thin films SiO2-P2O5 and silica-phosphate doped with different concentrations of Er3+ ions have been synthesized using tetraesoxysilane TEOS, triethylphosphate TEP and erbium nitrate as precursor sources of silica, phosphorus and erbium oxides. The structural properties of the prepared samples were studied, using x-ray diffraction (XRD) and Fourier Transform Infrared (FTIR). The morphology of silica-phosphate was characterized by Scanning electron microscope (SEM).
1. Introduction
There has been increasing interest in rare earth (REEs) doped semiconductors for long time, due to their potential applications in optical devices such as lasers, sensors, telecommunication, display devices, and photonics in the visible and near infrared spectral region. Besides the application aspect, the rare earth impurities are of great interest from a scientific point of view, due to the uniqueness of optical and electrical properties of rare earth impurities in semiconductor hosts. Recently semiconductors and high temperature glass technologies have dominated the industry for these kinds of products. Sol gel process can produce high quality thin films at room temperature without the need of expensive vacuum systems and standard pressure [1]. It involves mixing of liquid chemicals, allowing a reaction to happen where molecules form a new material that is suspended within the liquid system. The formation of a network matrix from these molecules attaching to each other is the basis of the new solid material and thin films. Utilizing this technology, silica-phosphate was formed at room temperature from liquid precursors [2-9].
Tung et al. [10] prepared previously the silica-phosphate (SiO2-P2O5) glass by the accelerated sol-gel process. The developed process not only reduces the extent of gel/glass cracking but also shortens the gelation time from 1 to 6 months to 3 days. There are more molecular water and hydroxyl groups bonding to the cross-link structure of the synthesized glass membrane in the developed process with water/vapor management compared to without water/vapor manage process. The gelation reactions in the sol-gel process for the synthesis of SiO2- P2O5 glass electrolytes were investigated by in situ FTIR spectroscopy. Types of water involving free/hydrogen bonded/strong hydrogen bonded water and hydroxyl group in the synthesized SiO2-P2O5 glass electrolytes were determined by TGA and in situ FTIR.
The aim of the present work is to develop sol-gel process that can be used for the preparation of silicaphosphate thin film glass in nano-scale and it will be successfully used in this work for the preparation of silica-phosphate doped with different concentrations of Er3+ ions. The structural studies and the functional groups of the prepared nano-composite thin films will be elucidate by using XRD and FTIR, while the SEM will be used for morphology study.
2. Experimental
Silica-phosphate (SiO2-P2O5) glasses pure and co-doped with 3 mol% of Al2O3 as a host material and different concentrations of Er2O3 (0.5, 1.2, 1.7 and 3 mol%), giving the following composition [SiO2: 11P2O5: 3Al2O3 (0.5 - 3) Er3+] sintered for three hours at different temperature 100˚C, 200˚C, 300˚C, 500˚C, 600˚C and 700˚C were synthesized by a spin coating sol-gel process. Silica-phosphate doped with Er3+ ions were obtained by hydrolysis and poly-condensation of tetra-ethoxysilane (CH3CH2OH)4Si (TEOS), (99.999%, Sigma-Aldrich) as SiO2 precursor and Triethyphosphate (C2 H5O)3P(O) as P2O5 precursor in ethanol solution were hydrolyzed under vigorous stirring with distilled H2O containing HCl used as a catalyst. Then the Er3+ ions were introduced in the process, by dissolving Er(NO3)3-H2O solutions in distilled H2O to the preceding precursors with molar ratios 0.5, 1.2, 1.7 and 3 mol% of Er3+ ions, respectively to get the desired concentrations [1-5]. These solutions were filtered followed by stirring for one hour at room temperature. The resultant homogeneous solutions of the prepared samples were aged for one day in room temperature (RT) before dispersed on the glass and/or silica substrate, as represented in the flow chart (Figure 1). Then it dispersed on the surface of the substrate and spun at 3500 rev/min for 30 seconds in a clean room. At least two successive coatings were required to provide suitable effective film thickness. The films were dried for 30 min and then sintered at temperature ranging from 100˚C up to 700˚C [1-3].
X-ray diffraction (XRD) patterns of the prepared samples were recorded with X-ray diffractometer using mono-chromatized CuKa1 radiation of wavelength = 1.54056 Å. Crystallite sizes G were determined from the Scherer’s equation (G = Kl/D cosq), where K is the Scherer constant (0.9), l is the wavelength and D is the full width (in radians) of the peak at half maximum (FWHM) intensity.
Fourier Transforms Infrared, were used to determine the individual frequencies and their intensities. The modern Fourier Transform infrared instruments are becoming more commonplace. The advantage gained by using all of the energy of the source and passing through circular holes rather than slits.
3. Results and Discussion
3.1. X-Ray Diffraction XRD
Figures 2(a)-(c) show XRD patterns of thin film silica gel doped with 11 mol% of phosphate dried at 60˚C for 30 minutes and then, sintered for three hours at 100˚C (a), 300˚C (b) 500˚C (c) and 700˚C (d). The hump at 2q between 17˚ and 28˚ attributed to amorphous silicaphosphate gel appeared at 100˚C as in Figure 2(a), where this sintering temperature can’t be enough to increase the kinetics of condensations process. By increasing the temperature up to 300˚C the crystallization of the film appeared and the peak intensities of the XRD patterns increased rapidly due to the loss of the surface molecules such as OH and OR groups which was present at low temperature resulting in an increase in the surface density. The diffraction peaks were assigned to (hexagonal silicaphosphate) Si3(PO4)4, (rhom-bohedra silica-phosphate) Si5- P6O25 and (monoclinic silica-phosphate) SiP2O7 phases, according to JCPDS cards no. (22 - 1380), (81 - 1593) and (71 - 2073), respectively, Figure 2(b). At higher temperature 500˚C and 700˚C an increase in the peak intensities was observed due to the increase in crystalline structure of the film and the disappearance of (hexagonal silicaphosphate) Si3(PO4)4 phase was achieved as shown in Figures 2(c) and (d).
Figures 3(a)-(c) show the XRD patterns of thin film silica-phosphate co-doped with 3 mol% Al3+ and 1.2 mol% of Er3+ ions, sintered for three hours at 100˚C (a), 200˚C (b) and 700˚C (c). The same trend of the host (silica-phosphate) samples discussed in Figure 2 before was observed. The intensity of the XRD peaks increases by increasing the sintering temperature. The patterns show beginning of crystallization phases superimposed on the amorphous hump, at lower sintering temperature 100˚C and 200˚C. Above 200˚C the crystallization in silicaphosphate gel glasses greatly increases with separation of the phases. According to the diffraction peaks and the re-crystallization of the samples, the (hexagonal silica-
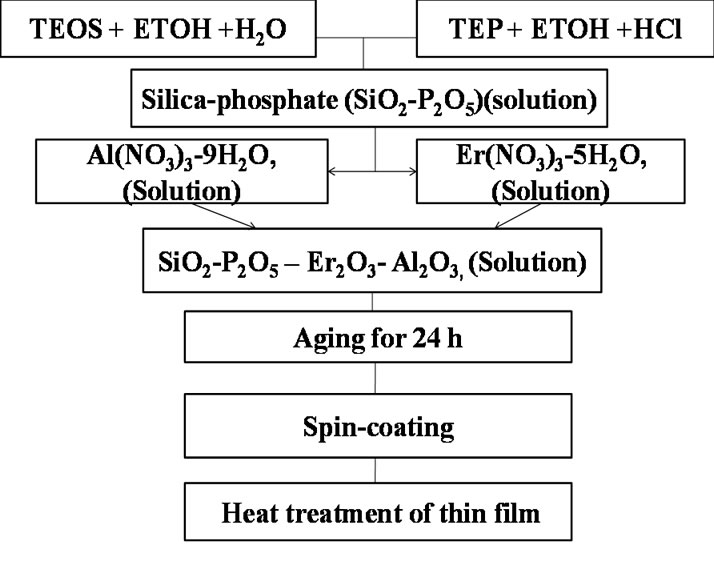
Figure 1. Flow chart for the preparation of thin film Er3+ ions doped silica-phosphate.
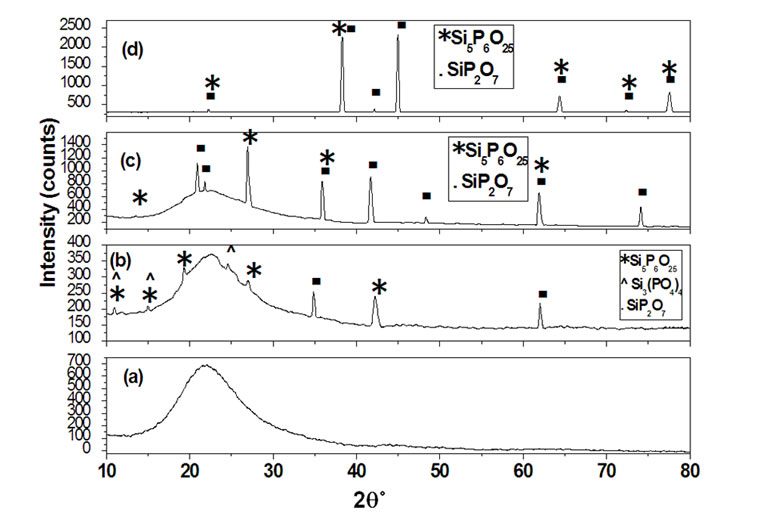
Figure 2. XRD patterns of thin film silica gel doped with 11 mol% of phosphate (SiO2:P2O3), as sintered for three hours at 100˚C (a), 300˚C (b), 500˚C (c) and 700˚C (d).

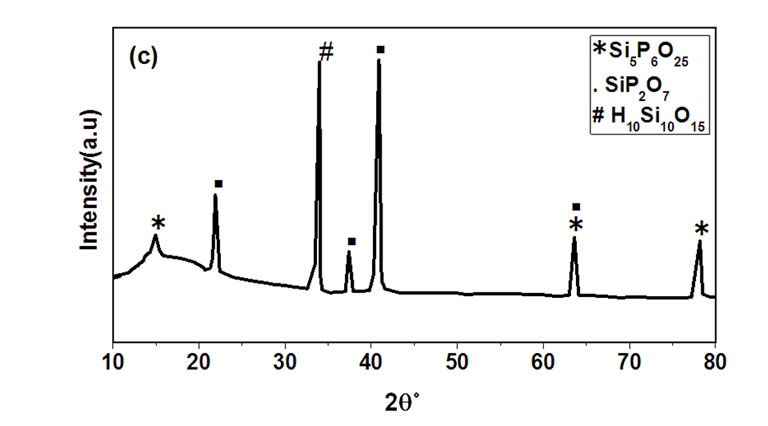
Figure 3. XRD patterns of thin film of Silica-Phosphate co-doped with Er3+ ions, (SiO2:11P2O5:3Al:1.2Er), as sintered for three hours at 100˚C (a), 200˚C (b) and 700˚C (c).
phosphate) Si3(PO4)4 phase was eliminated by increasing the temperature, while the (rhombohedra silica phosphate) Si5P6O25 and (silica phosphate) SiP2O7 phases were increased. Erbium oxide and related compounds are indeed in so small quantities that they may not appear with their corresponding x-ray diffraction patterns [11-13].
The crystallite sizes for thin film silica gel doped with 11 mol% phosphate sintered for three hours at 300˚C and 500˚C give the following values 14 and 25 nm, respectively. The crystallite sizes of the 1.2 mol% of the trivalent erbium ions dispersed in silica-phosphate gel sintered for three hours at 500˚C were found to be higher than host sample (89 SiO2·11P2O5) prepared at the same temperature, giving the following crystallite size 32 nm. XRD Figure of sintered doped sample with 1.2% at 500˚C was not shown here. The general behavior observed from the values of the crystallite size is its increase trend by doping with 1.2 mol% concentration of Er3+ ions, this may be due to the co-doped with Al3+ ions, which enhance the solubility of erbium inside the host matrix. The obtained data were confirmed by using the Win-fit program.
3.2. Fourier Transform Infrared FTIR
Figures 4-6 shows the FTIR absorption spectra of silica phosphate glass thin films of [SiO2: (a) 8 and (b) 11 mol% P2O5], sintered for three hours at 100˚C, (SiO2: 11 mol% P2O5), sintered for three hours at 200˚C (a) and

Figure 4. FTIR absorbance spectra in wide spectral region (400 - 4000 cm–1) of Silica-Phosphate thin film doped with different mol% concentrations of P2O5 as sintered for three hours at 100˚C [SiO2: (a) 8% and (b) 11% P2O5].
300˚C (b), and (SiO2: 11 mol% P2O5: 3 Al2O3) doped with different concentrations of Er+3 (a) 0.5, (b) 1.2 and (c) 1.7 mol%, sintered for three hours at 300˚C, respectively. All figures were measured in wide spectral region (400 - 4000 cm–1).
The broad band around 3437 cm–1 and the small one at 3728 cm–1 were due to the symmetric stretching of O-H groups υs(H-O-H). The signal at around 1649 cm–1 was due to the deformation modes of O-H groups and absorbed water molecules δ(H-O-H). It is attributed to the bending vibration of crystalline water, which could adsorb molecular water in the pores of the film or from the KBr in the pellets, it decreased by increasing the temperature up to 300˚C Figure 5 where this lower temperature is not enough to remove the molecular water from the pores and it was eliminated by increasing the temperature. It was slightly shifted to lower wave number by increasing both the sintering temperature, Figure 5 and the Er3+ ion concentrations, Figure 6 [16-19]. The weak Si-OH band at 2928 cm–1 in the following samples [SiO2: (a) 8 and (b) 11 mol% P2O5], sintered for three
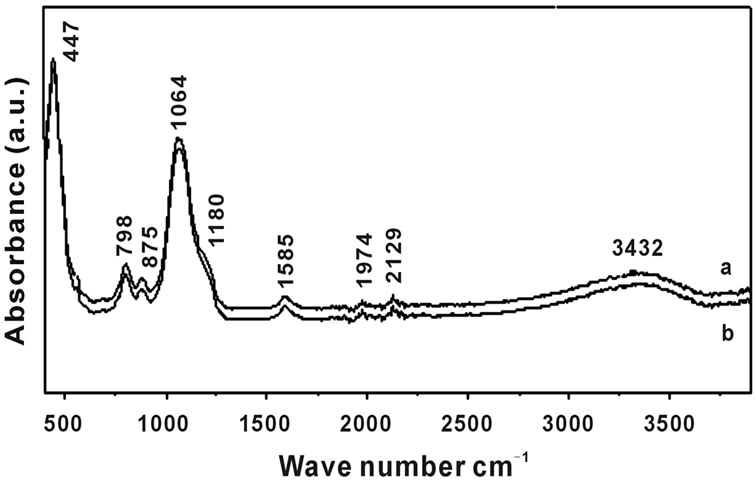
Figure 5. FTIR absorbance spectra in wide spectral region (400 - 4000 cm–1) of Silica-Phosphate thin film (SiO2: 11 mol% P2O5), as sintered for three hours at 200˚C (a) and 300˚C (b).

Figure 6. FTIR absorbance spectra in wide spectral region (400 - 4000 cm–1) of silica-Phosphate thin film doped with different mol% concentrations of Er+3 ions, [SiO2:11P2O5: Al; (a) 0.5 (b) 1.2 and (c) 1.7 mol%], as sintered for three hours at 300˚C.
hours at 100˚C was formed in case of the hydrolysis reaction of the alkoxy groups of either TEOS or TEP slightly shifted to lower wave-number by inceasing both sintered temperature and Er3+ concentrations. In addition, it become weaker by increasing the concentration of the Er3+ ions, as shown in Figure 6 and disappeared by increasing Er3+ ions concentration at 300˚C, Figure 5. The disappearance specially in case of doping with different concentrations of Er3+ ions and the decrease in intensities of the preceding mentioned bands at 300˚C explained by the condensation of first Si-OH and P-OH groups (leading to Si-O-Si and P-O-P links) and the inorganic part becomes sufficiently rigid to form a real trap for the remaining OH groups. In fact, Hydroxyl groups generally exist as silanols and phosphanols covering the surface of the silica-phosphate skeleton of the prepared samples, where some of the silanols and phosphanols are hydrogen-bonded (H-bonded) to molecular water remaining in the micro-pores either as a single molecule or in clusters.
A new band appeared at 1513 cm–1 which, shifted to 1585 cm–1 at higher temperature, assigned to -CH3 asymmetric bending and/or -CH2 groups. The band at 1322 cm–1 attributed to P-O stretch is in the fingerprint region (1320 - 1250 cm–1), they cannot be used without some other indication that P is present, because C-O and O-H groups can also absorb strongly in these region. A shoulder at ∼1208 and 1180 cm–1, Figures 4 and 5 in silica-phosphate glass changed in shape and position and shifted to higher wave number at 1195 cm–1 in case silica-phosphate doped with erbium and aluminum ions at 300˚C. This was attributed to the vibrations of Al-O-P bridges, similarly as in the AlPO4 structure or due to O-P-O symmetric stretching vibration, Figure 6 [20-22].
The signal at around 1974 cm–1 for the (SiO2: 11P2O5), sintered at different temperature (a) 200˚C and (b) 300˚C, Figure 5 was attributed to stretching vibration of Si-H groups decreases with increasing temperature. The bands observed at about 1097 and 1064 cm–1 υ as (Si-O-Si) were assigned to the asymmetric stretching of the bridging oxygen atoms of silica and shifted to lower wave number by increasing both phosphorus and erbium concentration, Figures 4-6. In the pure silica phosphate samples the vibrations at 802 and 875 cm–1 may be of terminal groups (P-O-) and (Si-H), respectively. The band υ as (P-O-P) observed at about 715, 798 and 795 cm–1 were assigned to the asymmetric stretching of the bridging oxygen atoms bonded to a phosphorus atom in a Q2 phosphate tetrahedron and decreases with increasing both temperature and erbium ion concentration. The absorption band at around 458, 447 and 439 cm–1 due to (Si-O-Si) bending vibration was decreased with increasing both temperature and erbium ion concentration in pure silica phosphate and doped samples, Figures 4 and 5 [23].
One can conclude that by doping with the phosphorus concentration at 11 mol% the silica (SiO2) might be replaced by phosphorus groups (P2O5). The doped materials show similarity to those of the silica-phosphate glasses. Since there are no corresponding bands in the infrared spectra of silica-phosphate glasses in this region, indicated that silica phosphate (Si-O-P) bonded are replaced with (Si-O-Al) or with (Si-O-P) upon Al or P doping, breaking up (RE-O-RE) regions and forming (Si-O-Al-O-RE) or (Si-O-P-O-RE) bonds [24].
3.3. Scanning Electron Microscopy (SEM) Investigation for Some Thin Film Samples
Figure 7 Shows the scanning electron microscopy (SEM) images of SiO2: 11 mol% P2O5 doped with 0.5 mol% of Er3+ ions, as sintered for three hours at 500˚C. The surface of the films shows good uniformity and cracks free, indicating good adhesion and regularity among the two
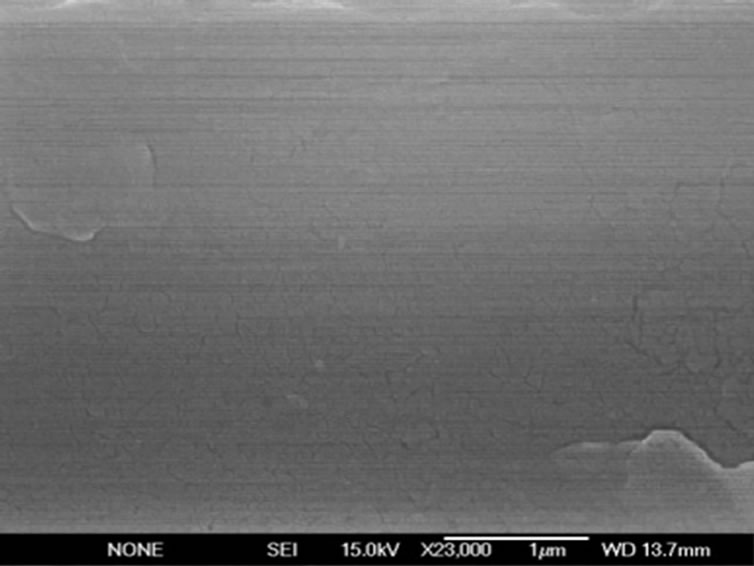
Figure 7. SEM micrographs of SiO2: 11 mol% P2O5 doped with 0.5 mol% of Er3+ ions, as sintered for three hours at 500˚C with magnification at × = 23000.
layers of the prepared film at this higher temperature 500˚C.
4. Conclusions
Nano-structure silica-phosphate host materials SiO2 doped with 3, 8 and 11 mol% of P2O5 and nano-composites SiO2: P2O5 doped with Er3+ ions giving the following composition [SiO2:11P2O5:3Al2O3:(0.5 up to 1.2 mol% Er3+)] were successfully prepared using spin coating sol gel technique. In this contribution we have investigated the structure of Er3+ ions in silica-phosphate glass. The evolution of the XRD patterns of silica-phosphate thin films as a function of the temperature was revealed that all the silica-phosphate based samples were amorphous from room temperature up to 100˚C. The crystallite sizes for the host silica-phosphate and doped with 1.2 mol% of Er3+ ions both sintered at 500˚C, give the following values 25 and 32 nm, respectively.
The addition of Er3+ and Al3+ ions into the glass system leads to the change in the structural properties of the host sample. All the characteristic bands for silica-phosphate and doped with erbium ions were appeared in the FTIR of the prepared thin films.
REFERENCES
- M. Kamal, I. K. Battisha, M. A. Salem and A. M. S. El Nahrawy, “Structural and Thermal Properties of Monolithic Silica-Phosphate (SiO2-P2O5) Gel Glasses Prepared by Sol-Gel Technique,” Journal of Sol-Gel Science and Technology, Vol. 58, No. 2, 2011, pp. 507-517. doi:10.1007/s10971-011-2420-0
- I. K. Battisha, M. A. Salem, A. M. S. Nahraw, Y. Badr and M. K. M. Youssef, “Erbium Activated Monolith Silica-Phosphate Glasses Planar Waveguide and Up-Conversion Mechanism,” International Journal of Nano and Biomaterials, Vol. 2, No. 1-5, 2009, pp. 191-203.
- Y. Badr, I. K. Battisha, A. M. S. El Nahrawy, B. Elouadi and M. Kamal, “Physical Study of Thin Film and Monolithic Nanocomposites [SiO2:11P2O5:3Al2O3:(1.2)Er (1.2, 1.8 and 3)Yb] Prepared by Sol Gel Technique, Planar Waveguide and Co-operative Up-Conversion,” New Journal of Glass and Ceramics, Vol. 1, No. 2, 2011, pp. 71-78. doi:10.4236/njgc.2011.12012
- I. K. Battisha, “Structural and Optical Properties of Monolithic Silica Gel Glasses Containing Nd3+ Using Two Different Precursors TEOS and TMOS Prepared by Sol-Gel,” Indian Journal of Pure and Applied Physics, Vol. 40, 2002, pp. 122-131.
- Y. Badr, I. K. Battisha, A. Salah and M. A. Salem, “Up-Conversion Luminescence Application in Er3+: TiO2 Thin Film Prepared by Dip Coating Sol-Gel Route,” Indian Journal of Pure and Applied Physics, Vol. 46, No. 10, 2008, pp. 706-711.
- I. K. Battisha, A. El Beyally, S. Abd El Mongy and A. M. Nahrawi, “Development of the FTIR Properties of NanoStructure Silica Gel Doped with Different Rare Earth Elements, Prepared by Sol-Gel Route,” Journal of SolGel Science and Technology, Vol. 41, No. 2, 2007, pp. 129-137. doi:10.1007/s10971-006-0520-z
- I. K. Battisha, “Visible Up-Conversion Photoluminescence from IR Diode-Pumped SiO2-TiO2 Nanocomposite Films Heavily Doped with Er3+-Yb3+ and Nd3+-Yb3+,” Journal of Non-Crystalline Solids, Vol. 353, No. 18-21, 2007, pp. 1748-1754. doi:10.1016/j.jnoncrysol.2007.01.043
- I. K. Battisha, A. El Beyally, S. L. Soliman and A. S. El Nahrawi, “Structural and Optical Studies of Activated Thin Film and Monolith Nano-Structure Silica Gel Doped with Different Rare Earth Elements, Prepared by Two Different Sol-Gel Techniques,” Indian Journal of Pure and Applied Physics, Vol. 45, 2007, pp. 441-453.
- I. K. Battisha, “Physical Properties of Nanoparticle Silica Gel Doped with CdS Prepared by Sol-Gel Technique,” Fizika A, Vol. 11, 2002, pp. 34001-34010.
- S.-P. Tung and B. J. Hwang, “High Proton Conductive Glass Electrolyte Synthesized by an Accelerated Sol-Gel Process with Water/Vapor Management,” Journal of Membrane Science, Vol. 241, No. 2, 2004, pp. 315-323.
- P. Massiot, M. A. Centeno, I. Carrizosa and J. A. Odriozola, “Thermal Evaluation of Sol-Gel-Obtained Phosphosilicate Solids (Sipo),” Journal of Non-Crystalline Solids, Vol. 292, No. 1-3, 2001, pp. 158-166. doi:10.1016/S0022-3093(01)00854-7
- P. Massiot, M. A. Centeno, M. Gouriou, M. I. Dominguez and J. A. Odriozola, “Sol-Gel Obtained Silicophosphates as Materials to Retain Caesium at High Temperatures,” Journal of Materials Chemistry, Vol. 13, No. 1, 2003, pp. 67-74. doi:10.1039/b208698k
- D. Qiu, P. Guerry, J. C. Knowles, M. E. Smith and R. J. Newport, “Formation of Functional Phosphosilicate Gels from Phytic Acid and Tetraethyl Orthosilicate,” Journal of Sol-Gel Science and Technology, Vol. 48, No. 3, 2008, pp. 378-383. doi:10.1007/s10971-008-1818-9
- G. N. H. Kumar, J. L. Rao, K. R. Prasad and Y. C. Ratnakaram, “Fluorescence and Judd Ofelt Analysis of Nd3+ Doped P2O5:Na2O:K2O Glass,” Journal of Alloys and Compounds, Vol. 480, No. 2, 2009, pp. 208-215. doi:10.1016/j.jallcom.2009.02.033
- K. Arai, H. Namikawa, K. Kumata, T. Honda, Y. Ishii and T. Handa, “ Local Structure and 1.5 µm Quantum Efficiency of Erbium Doped Glasses for Optical Amplifiers,” Journal of Non-Crystalline Solids, Vol. 196, 1996, pp. 101-105.
- H. S. Costa, M. F. Rocha, G. I. Andrade, E. Barbosa-Stancioli, M. M. Pereira , R. L. Orefice, W. L. Vasconcelos and H. S. Mansur, “Sol-Gel Derived Composite from Bioactive Glass-Polyvinyl Alcohol,” Journal of Materials Science, Vol. 43, No. 2, 2008, pp. 494-502. doi:10.1007/s10853-007-1875-4
- R. M. Almeida, A. C. Marques and S. Portal, “Glassy and Nano-Crystalline Photonic Materials and Structures by Sol-Gel,” Optical Materials, Vol. 27, No. 11, 2005, pp. 1718-1725. doi:10.1016/j.optmat.2004.11.042
- S. H. Costa, F. M. Rocha, I. G. Andrade, F. E. BarbosaStancioli, M. M. Pereira, L. R. Orefice, L. W. Vasconcelos and S. M. Mansur, “Sol-Gel Derived Composite from Bioactive Glass-Polyvinyl Alcohol,” Journal of Materials Science, Vol. 43, No. 2, 2008, pp. 494-502. doi:10.1007/s10853-007-1875-4
- D. Carta, C. J. Knowles, E. M. Smith and J. R. Newport, “Structural Characterization of P2O5-CaO-Na2O Sol-Gel Materials,” Journal of Non-Crystalline Solids, Vol. 353, No. 11-12, 2007, pp. 1141-1149. doi:10.1016/j.jnoncrysol.2006.12.093
- E. Metwalli, M. Karabulut, D. L. Sidebottom, M. M. Morsi and R. K. Brow, “Properties and Structure of Copper Ultra-Phosphate Glasses,” Journal of Non-Crystalline Solids, Vol. 344, No. 3, 2004, pp. 128-134. doi:10.1016/j.jnoncrysol.2004.07.058
- J. X. Hao, C. E. Cho, G. Scardera, E. Bellet-Amalric, D. Bellet, Y. S. Shen, S. Huang, Y. D. Huang, G. Conibeer and M. A. Green, “Effects of Phosphorus Doping on Structural and Optical Properties of Silicon Nanocrystals in a SiO2 Matrix,” Thin Solid Films, Vol. 517, No. 19, 2009, pp. 5646-5652. doi:10.1016/j.tsf.2009.02.076
- Y. Zhang and M. Wang, “A New Method to Probe the Structural Evolution during the Heat Treatment of SiO2- P2O5 Gel Glasses,” Materials Science and Engineering: B, Vol. 67, No. 3, 1999, pp. 99-101. doi:10.1016/S0921-5107(99)00219-6
- G. Lakshminarayana and M. Nogami, “Proton Conducting Organic-Inorganic Composite Membranes under Unhydrous Conditions Synthesized Tetraethoxysilane/Methyltriethoxysilane/Trimethyl Phosphate and 1-Butyl-3 Methylimidazolium Tetrafluoroborate,” Solid State Ionics, Vol. 181, No. 15-16, 2010, pp. 760-766.
- H. Bach and N. Neuroth, “The Properties of Optical Glass, Schott Series on Glass and Glass Ceramics,” Springer, Berlin, 1998.
NOTES
*Corresponding author.