Paper Menu >>
Journal Menu >>
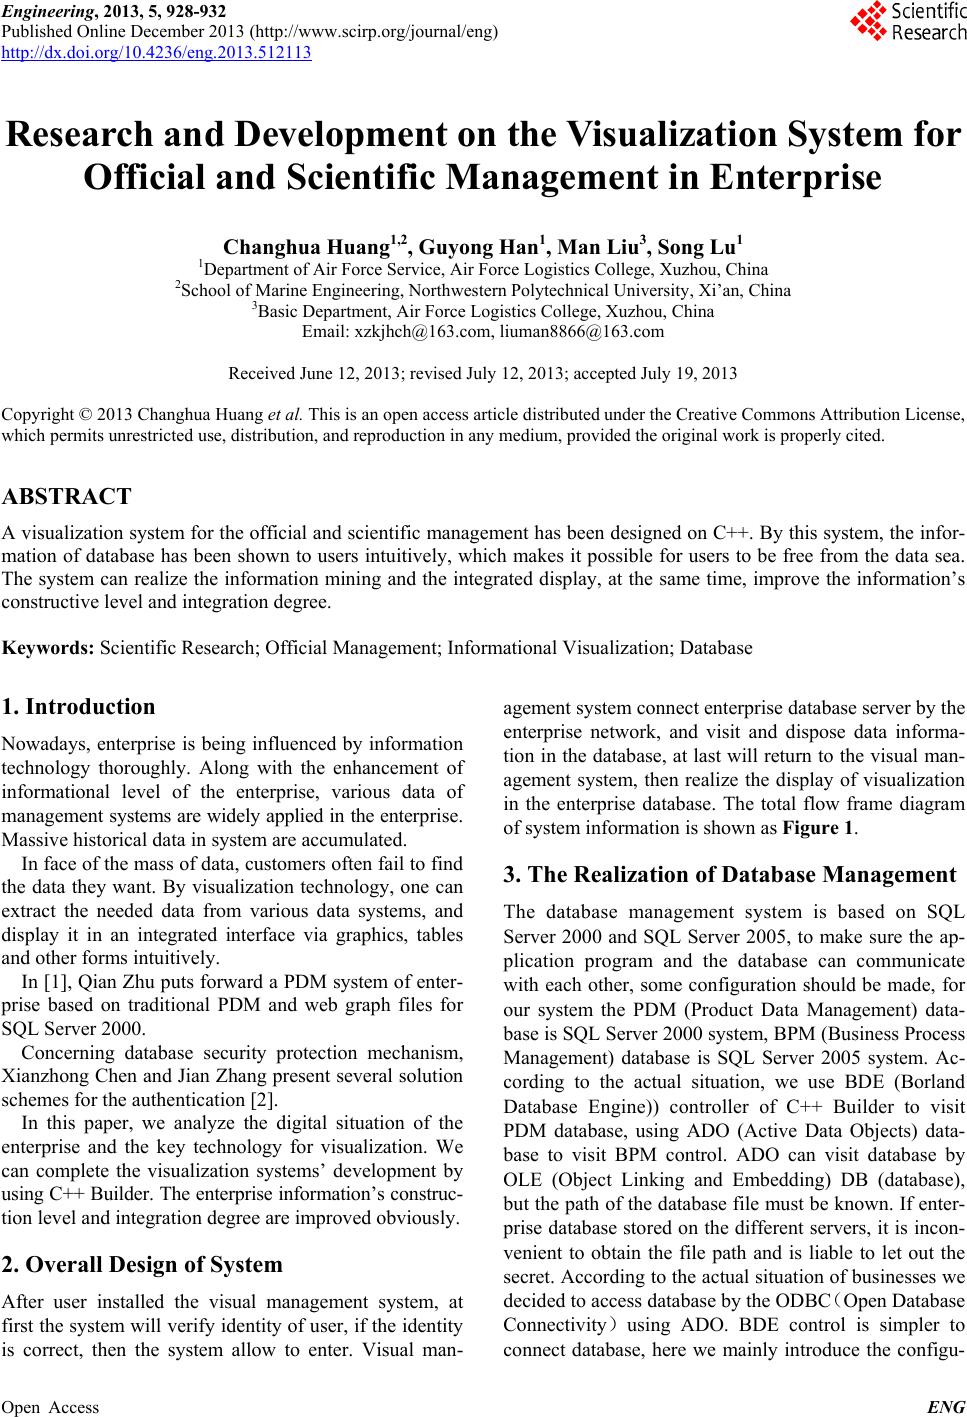 Engineering, 2013, 5, 928-932 Published Online December 2013 (http://www.scirp.org/journal/eng) http://dx.doi.org/10.4236/eng.2013.512113 Open Access ENG Research and Development on the Visualization System for Official and Scientific Management in Enterprise Changhua Huang1,2, Guyong Han1, Man Liu3, Song Lu1 1Department of Air Force Service, Air Force Logistics College, Xuzhou, China 2School of Marine Engineering, Northwestern Polytechnical University, Xi’an, China 3Basic Department, Air Force Logistics College, Xuzhou, China Email: xzkjhch@163.com, liuman8866@163.com Received June 12, 2013; revised July 12, 2013; accepted July 19, 2013 Copyright © 2013 Changhua Huang et al. This is an open access article distributed under the Creative Commons Attribution License, which permits unrestricted use, distribution, and reproduction in any medium, provided the original work is properly cited. ABSTRACT A visualization system for the official and scientific management has been design ed on C++. By this system, the infor- mation of database has been shown to users intuitively, which makes it possible for users to be free from the data sea. The system can realize the information mining and the integrated display, at the same time, improve the information’s constructive level and integration degree. Keywords: Scientific Research; Official Management; Informational Visualization; Database 1. Introduction Nowadays, enterprise is being influenced by information technology thoroughly. Along with the enhancement of informational level of the enterprise, various data of man ageme nt systems are widely applied in the enterpri se. Massive historical data in system are accumulated. In face of the mass of data, customers often fail to find the data they want. By visualization technology, one can extract the needed data from various data systems, and display it in an integrated interface via graphics, tables and other forms intuitively. In [1], Qian Zh u puts forward a PDM system of en ter- prise based on traditional PDM and web graph files for SQL Server 2000. Concerning database security protection mechanism, Xianzhong Chen an d Jian Zhang present several solu tion schemes for the authentication [2]. In this paper, we analyze the digital situation of the enterprise and the key technology for visualization. We can complete the visualization systems’ development by using C++ Builder. The enterprise information’s construc- tion level and integration degree are improved obviously. 2. Overall Design of System After user installed the visual management system, at first the system will verify identity of user, if the identity is correct, then the system allow to enter. Visual man- agement system connect enterprise database server by the enterprise network, and visit and dispose data informa- tion in the database, at last will return to the visual man- agement system, then realize the display of visualization in the enterprise database. The total flow frame diagram of system information is shown as Figure 1. 3. The Realization of Database Management The database management system is based on SQL Server 2000 and SQL Server 2005, to make sure the ap- plication program and the database can communicate with each other, some configuration should be made, for our system the PDM (Product Data Management) data- base is SQL Server 2000 system, BPM (Business Process Management) database is SQL Server 2005 system. Ac- cording to the actual situation, we use BDE (Borland Database Engine)) controller of C++ Builder to visit PDM database, using ADO (Active Data Objects) data- base to visit BPM control. ADO can visit database by OLE (Object Linking and Embedding) DB (database), but the path of the datab ase file must be known. If enter- prise database stored on the different servers, it is incon- venient to obtain the file path and is liable to let out the secret. According to the actual situation of businesses we decided to access database by the ODBC(Open Databa se Connectivit y)using ADO. BDE control is simpler to connect database, here we mainly introduce the configu- 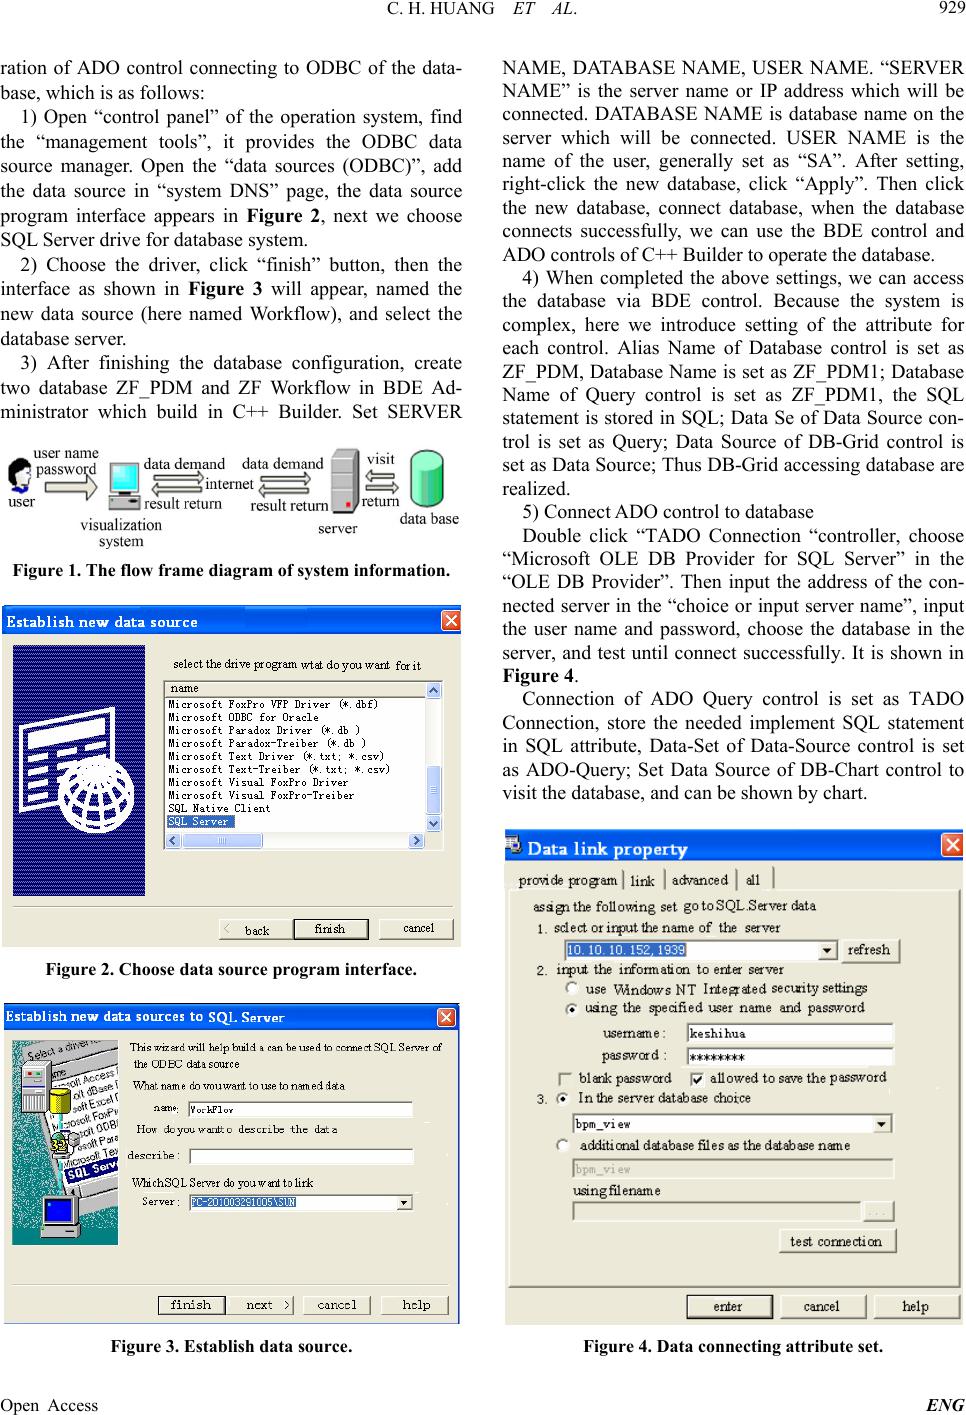 C. H. HUANG ET AL. 929 ration of ADO control connecting to ODBC of the data- base, which is as follows: 1) Open “control panel” of the operation system, find the “management tools”, it provides the ODBC data source manager. Open the “data sources (ODBC)”, add the data source in “system DNS” page, the data source program interface appears in Figure 2, next we choose SQL Server drive for database system. 2) Choose the driver, click “finish” button, then the interface as shown in Figure 3 will appear, named the new data source (here named Workflow), and select the database server. 3) After finishing the database configuration, create two database ZF_PDM and ZF Workflow in BDE Ad- ministrator which build in C++ Builder. Set SERVER Figure 1. The flow frame diagram of system information. Figure 2. Choose data source program interface. Figure 3. Establish data source. NAME, DATABASE NAME, USER NAME. “SERVER NAME” is the server name or IP address which will be connected. DATABASE NAME is database name on the server which will be connected. USER NAME is the name of the user, generally set as “SA”. After setting, right-click the new database, click “Apply”. Then click the new database, connect database, when the database connects successfully, we can use the BDE control and ADO controls of C++ Builder to op erate the database. 4) When completed the above settings, we can access the database via BDE control. Because the system is complex, here we introduce setting of the attribute for each control. Alias Name of Database control is set as ZF_PDM, Database Name is set as ZF_PDM1; Database Name of Query control is set as ZF_PDM1, the SQL statement is stored in SQL; Data Se of Data Source con- trol is set as Query; Data Source of DB-Grid control is set as Data Source; Thus DB-Grid accessing database are realized. 5) Connect ADO control to database Double click “TADO Connection “controller, choose “Microsoft OLE DB Provider for SQL Server” in the “OLE DB Provider”. Then input the address of the con- nected server in the “choice or input server name”, input the user name and password, choose the database in the server, and test until connect successfully. It is shown in Figure 4. Connection of ADO Query control is set as TADO Connection, store the needed implement SQL statement in SQL attribute, Data-Set of Data-Source control is set as ADO-Query; Set Data Source of DB-Chart control to visit the database, and can be shown by chart. Figure 4. Data connecting attribute set. Open Access ENG 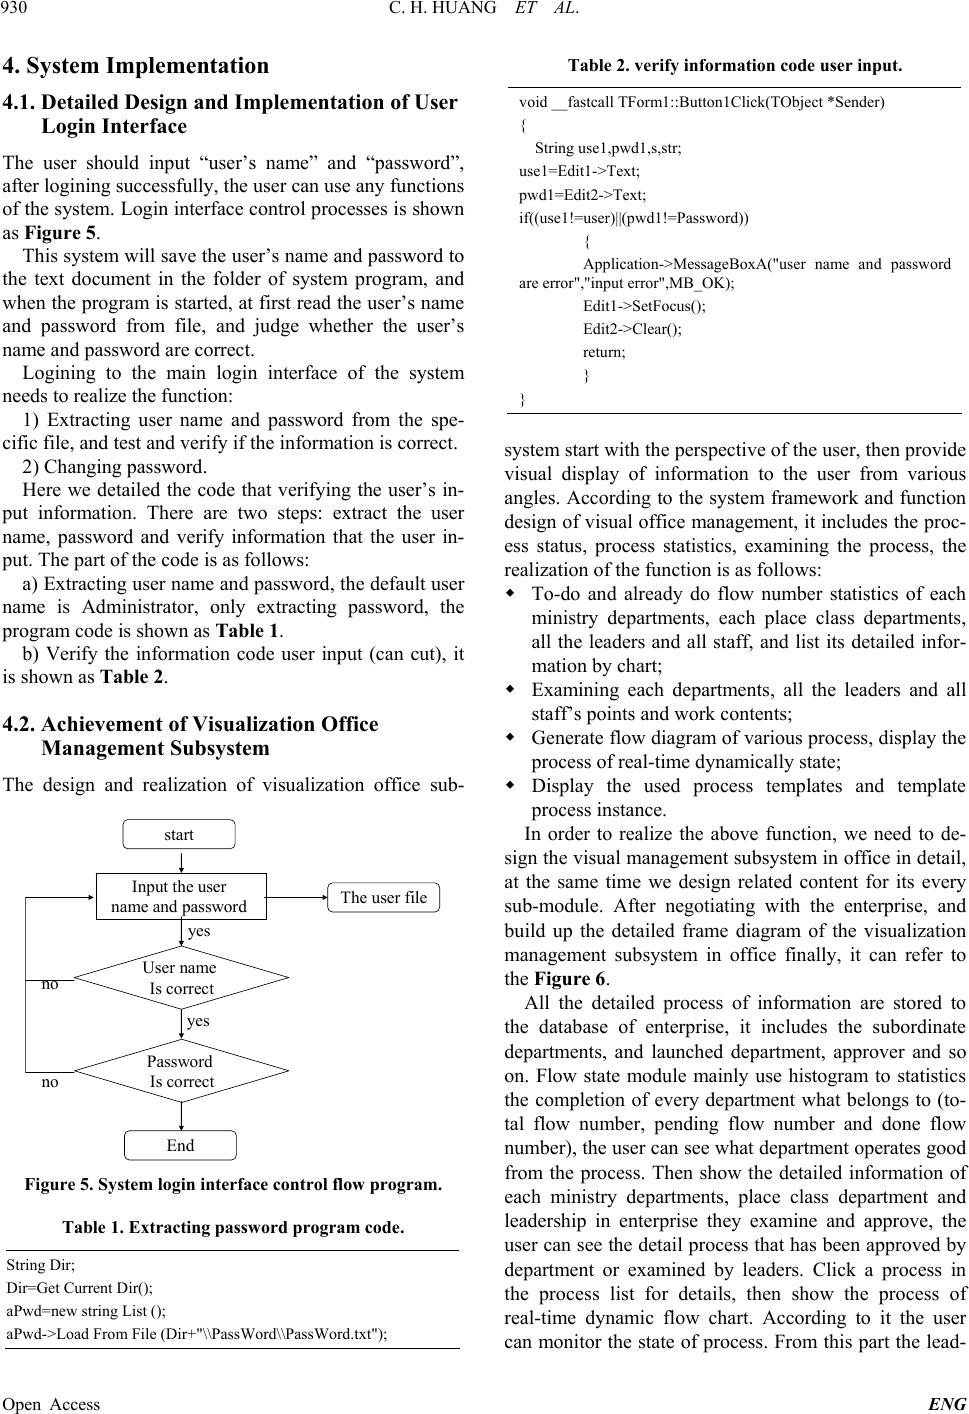 C. H. HUANG ET AL. 930 4. System Implementation 4.1. Detailed Design and Implementation of User Login Interface The user should input “user’s name” and “password”, after logining successfully, the user can use any functions of the system. Login interface control processes is shown as Figure 5. This system will save the user’s name and password to the text document in the folder of system program, and when the program is started, at first read the user’s name and password from file, and judge whether the user’s name and password are correct. Logining to the main login interface of the system needs to realize the function: 1) Extracting user name and password from the spe- cific file, and test and verify if the information is correct. 2) Changing password. Here we detailed the code that verifying the user’s in- put information. There are two steps: extract the user name, password and verify information that the user in- put. The part of the code is as fo llows: a) Extracting user name and password, the default user name is Administrator, only extracting password, the program code is shown as Table 1. b) Verify the information code user input (can cut), it is shown as Table 2. 4.2. Achievement of Visualization Office Management Subsystem The design and realization of visualization office sub- start Input the user name and password User name Is correct Password Is correct End The user file no no yes yes Figure 5. System login interface control flow program. Table 1. Extracting password program code. String Dir; Dir=Get Current Dir(); aPwd=new string List (); aPwd->Load From File (Dir+"\\PassWord\\PassWord.txt"); Table 2. verify information code user input. void __fastcall TForm1::Button1Click( TObject *Sender) { String use1,pwd1,s,str; use1=Edit1->Text; pwd1=Edit2->Text; if((use1!=user)||(pwd1!=Password)) { Application->MessageBoxA("user name and password are error","input error",MB_OK); Edit1->SetFocus(); Edit2->Clear(); return; } } system start with the perspective of th e user, then provid e visual display of information to the user from various angles. According to the system framework and function design of visual office management, it includes the proc- ess status, process statistics, examining the process, the realization of the function is as follows: To-do and already do flow number statistics of each ministry departments, each place class departments, all the leaders and all staff, and list its detailed infor- mation by chart; Examining each departments, all the leaders and all staff’s points and work contents; Generate flow diagram of various process, display the process of real-time dynamically state; Display the used process templates and template process instance. In order to realize the above function, we need to de- sign the visual management subsystem in office in detail, at the same time we design related content for its every sub-module. After negotiating with the enterprise, and build up the detailed frame diagram of the visualization management subsystem in office finally, it can refer to the Figure 6. All the detailed process of information are stored to the database of enterprise, it includes the subordinate departments, and launched department, approver and so on. Flow state module mainly use histogram to statistics the completion of every department what belongs to (to- tal flow number, pending flow number and done flow number), the user can see what department operates good from the process. Then show the detailed information of each ministry departments, place class department and leadership in enterprise they examine and approve, the user can see the detail process that has been approved by department or examined by leaders. Click a process in the process list for details, then show the process of real-time dynamic flow chart. According to it the user can monitor the state of process. From this part the lead- Open Access ENG 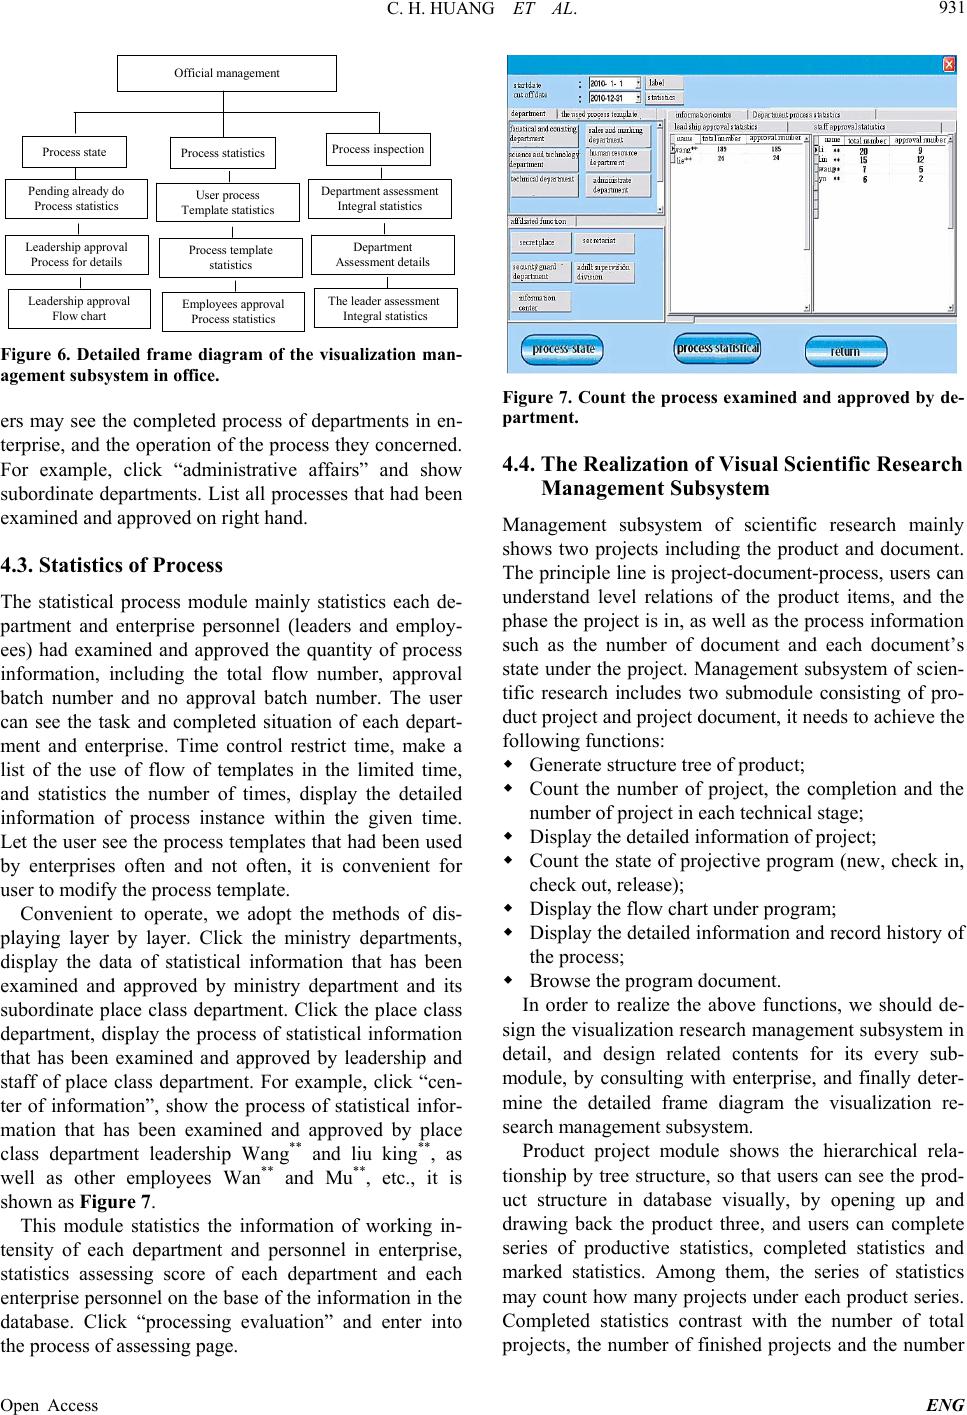 C. H. HUANG ET AL. 931 Off i cial management Process stateProcess statisticsProcess inspection Pending already do Process sta tistics Leadership approval Process for details Leadership approval Flow chart User process Template statistics Process template statistics Employees approval Process statistics Department assessment Integral sta tis tics Department Assessment details The leader assessment Integral statistics Figure 6. Detailed frame diagram of the visualization man- agement subsystem in office. ers may see the completed process of departments in en- terprise, and the operation of the process they concerned. For example, click “administrative affairs” and show subordinate departments. List all processes that had been examined an d approved on right hand. 4.3. Statistics of Process The statistical process module mainly statistics each de- partment and enterprise personnel (leaders and employ- ees) had examined and approved the quantity of process information, including the total flow number, approval batch number and no approval batch number. The user can see the task and completed situation of each depart- ment and enterprise. Time control restrict time, make a list of the use of flow of templates in the limited time, and statistics the number of times, display the detailed information of process instance within the given time. Let the user see the process te mplates that had been used by enterprises often and not often, it is convenient for user to modify the process template. Convenient to operate, we adopt the methods of dis- playing layer by layer. Click the ministry departments, display the data of statistical information that has been examined and approved by ministry department and its subordinate place class department. Click the place class department, display the process of statistical information that has been examined and approved by leadership and staff of place class department. For example, click “cen- ter of information”, show the process of statistical infor- mation that has been examined and approved by place class department leadership Wang** and liu king**, as well as other employees Wan** and Mu**, etc., it is shown as Figure 7. This module statistics the information of working in- tensity of each department and personnel in enterprise, statistics assessing score of each department and each enterprise personnel on the base of the information in the database. Click “processing evaluation” and enter into the process of assessing page. Figure 7. Count the process examined and appr oved by de- partment. 4.4. The Realization of Visual Scientific Research Management Subsystem Management subsystem of scientific research mainly shows two projects including the product and document. The principle line is project-d ocument-process, users can understand level relations of the product items, and the phase the project is in , as well as the process information such as the number of document and each document’s state under the project. Management subsystem of scien- tific research includes two submodule consisting of pro- duct project and project document, it needs to achieve the following functions: Generate structure tree of product; Count the number of project, the completion and the number of project in each technical stage; Display the detailed informatio n of project; Count the state of projective program (new, check in, check out, release); Display the flow chart under program; Display the detailed information and record history of the process; Browse the program document. In order to realize the above functions, we should de- sign the visualization research management subsystem in detail, and design related contents for its every sub- module, by consulting with enterprise, and finally deter- mine the detailed frame diagram the visualization re- search management subsystem. Product project module shows the hierarchical rela- tionship by tree structure, so that users can see the prod- uct structure in database visually, by opening up and drawing back the product three, and users can complete series of productive statistics, completed statistics and marked statistics. Among them, the series of statistics may count how many projects under each product series. Completed statistics contrast with the number of total projects, the number of finished projects and the number Open Access ENG  C. H. HUANG ET AL. Open Access ENG 932 of unfinished projects. Marked statistics count the num- ber of the project in the various technical phases. When click one product in the left of product tree, then display the detailed information under th e project, such as name, model, stage, date created, founder, etc. Click a certain project under product tree, then show the detail informa- tion of the project, such as stage, date created, found, use and so on. 5. Document of the Project Project Document reflects the relationship of project- document-process comprehensively. A project has many document, each document has the related process. By the module the number of each project and the key document can be display explicitly. Each specific document, the flow chart of each document and the record history can be browsed too. Among them, the flow chart marks the process node with four different colors, respectively de- noting the completed, the ongoing, the former node and the to-be-done pro cess node, it is easy to know the situa- tion of the process by the flow diagram. Figure 8. The document information of project. BPM database, integrated visualization display of infor- mation is realized. Thus the leadership can obtain the concerned information intuitively and be free from the dilemma of “Be short of useful data by trapped in the data sea”. REFERENCES [1] Q. Zhu, “The PDM ‘System Based on the SQL Server’,” Master’s Thesis, University of Sichuan, 2005. Enter into “scientific management”, click “project documentation” it will display “project documentation”. The product tree is on the left, all the document statistical information is on the right, the status of document in- clude: new, check in, check out, release, shown as Fig- ure 8. [2] X.-Z. Chen and J. Zhang, “Research on the Application System Based on SQL Server,” Hebei Journal of Indus- trial Science & Technology, Vol. 20, No. 3, 2003, pp. 10- 13. 6. Conclusion Based on the analysis structure of PDM database and |