 Vol.3, No.4, 227-235 (2013) Journal of Diabetes Mellitus http://dx.doi.org/10.4236/jdm.2013.34035 Adipocytes modulate vascular smooth muscle cells migration potential through their secretions* Souhad El Akoum1,2, Isabelle Cloutier1, Jean-François Tanguay1,2# 1Montreal Heart Institute, Montréal, Canada; #Corresponding Author: jean-francois.tanguay@icm-mhi.org 2Département de Sciences Biomédicales, Faculté de Médecine, Université de Montréal, Montréal , Canada Received 3 May 2013; revised 3 June 2013; accepted 12 June 2013 Copyright © 2013 Souhad El Akoum et al. This is an open access article distributed under the Creative Commons Attribution License, which permits unrestricted use, distribution, and reproduction in any medium, provided the original work is properly cited. ABSTRACT Impairment of vascular smooth muscle cells (VSMC) is recognized as a predisposition factor for atherosclerosis development. We hypothe- size that the metabolic syndrome has a direct impact on VSMC migration and phenotypic swit- ching, which may increase the inciden ce of athe- rosclerotic events. Aortic VSMC were extracted from 10 weeks old C57BL6 mice and incubated for 24 hr in adipocytes conditioned cell culture medium. Adipocytes were extracted from dia- betic C57BL6 male mice fed with either a vegetal or an animal High-Fat-Diet (HFD) for 20 weeks. Migration of VSMC in response to conditioned media stimulations was significantly modulated compared to control. The most extended effects on VSMC were triggered by adipocytes from mice fed with animal HFD. These effects were con- current with increased leptin con centrations and decreased adiponectin levels in conditioned me- dia. A significant up-regulation of CD36 mRNA level was found in VSMC treated with adipocytes from HFD-fed mice. In conclusion, we have shown that the development of adipocyte-induced VSMC alterations is linked to diet fatty acid composi- tion and the degree of metabolic alterations. The modulation of adipokine secretions in the adi- pose tissue that is linked to metabolic altera- tions may alter the physiolo gy of VSMC and thus accelerate the development of metabolic-related vascular diseases. Keywords: Adipocytes; Atherosclerosis; Type 2 Diabetes; Vascular Smooth Muscle Cells; Migratio n 1. INTRODUCTION Obesity and type 2 diabetes (T2D) are recognized as predisposition factors for atherosclerosis development. Endothelial cells (EC) and vascular smooth muscle cells (VSMC) are sensitive to obesity-linked increased fatty acids (FA) and T2D-linked hyperglycæmia that triggers vascular alterations and leads to atherogenesis [1-3]. A lack in insulin sensitivity lowers intracellular glucose availability forcing arterial cells to use FA as an alterna- tive energy source. Thus, in atheroprone regions suscep- tible to plaque formation, EC and VSMC are subjected to metabolic modifications that lead to the accumulation of oxidized LDL (oxLDL) within the intima [4] and the progression of vascular diseases. At the early stage of atherogenesis, the oxLDL-ex- posed endothelium becomes activated and up-regulates the expression of adhesion molecules (ICAM, VCAM), thereby allowing monocyte recruitment and initiation of the inflammatory process [4]. For their part, VSMC un- dergo “phenotypic switching”, which is characterized by decreased contractibility and increased proliferation and migration toward the intima. These processes then con- tribute to intima thickness and atherosclerotic plaque formation [5,6]. With time, VSMC may undergo choles- terol-induced trans-differentiation into foam cells [7]. These cells have a macrophage like phenotype and ex- press increased levels of the oxLDL scavenger receptor CD36, which favors lipid accumulation and contributes to the atherogenic process [8]. The specific factors implicated in VSMC alterations linked to obesity and T2D remain incompletely under- stood. However, the migration process of these cells seems to play a pivotal role in the development of atherosclerosis and its complications. The secretions of adipokines from the adipose tissue, which regulate vari- ous sets of metabolic and physiologic processes, could *Funding: This study was financed by a grant from the foundation des maladies du Coeur du Québec and the Montreal Heart Institute founda- tion. Competing of interest: Neither of the authors has any potential benefits or conflicts of interest to disclose. Copyright © 2013 SciRes. OPEN ACCESS  S. El Akoum et al. / Journal of Diabetes Mellitus 3 (2013) 227-23 5 228 not be discarded [9,10]. Indeed, little is known about the effect of these adipokines on the VSMC migration proc- ess. Thus, since obesity-increased FA is an important in- ducer of metabolic disorders and vascular pathogenesis, and regulates adipose tissue activity, we hypothesized that adipocytes through adipokine secretions play an impor- tant role in VSMC alterations leading to atherosclerosis. Therefore, the present study is aimed at determining the effect of factors secreted by adipocytes isolated from mice fed with High-Fat-Diet (HFD) on VSMC migration. We focused our investigation on isolated adipocytes to exclude the impact of other cell types found in the adi- pose tissue such as macrophages. 2. MATERIALS AND METHODS 2.1. Experimental Protocol Adipocytes were obtained from C57BL/6J male mice fed on a HFD for 20 weeks [11]. Mice were fed one of two low cholesterol HFD (34.9% fat, 26.3% carbohy- drate, cholesterol <0.03%; ResearchDiet): a vegetal HFD (VD) composed of soy and cotton oil and an animal HFD (AD) composed of lard. The common standard diet (SD) was used as control (6% fat, 57% carbohydrate; Harlan- Teklad). The animal protocol was approved by the Ani- mal Care and Use Committee of the Montreal Heart In- stitute. 2.2. Adipocyte Culture Mature adipocytes were isolated from visceral-ab- dominal adipose tissue of each mouse at sacrifice. Briefly, adipose tissue was finely minced and enzymatically di- gested in Dulbecco’s-Modified-Eagle-Medium (DMEM) containing 2 mg/ml type I collagenase (37˚C; 40 min). Samples were then centrifuged (300 × g; 7 min) and the top white supernatant passed through 100 µm filter and washed twice in DMEM. Adipocytes (104 cells/ml) were maintained in serum free low glucose DMEM supplemented or not with insu- lin (100 µU/ml), glucose (25mM) or insulin + glucose for 24 hr. Adipocytes supernatants (AdS) were collected and immediately stored at −20˚C. At the moment of ex- perimentation samples were thawed and added in VSMC cultures. To simplify annotations, supernatants from unstimu- lated adipocytes were noted as AdS-U, supernatants from insulin-stimulated adipocytes as AdS-I, supernatant from glucose-stimulated adipocytes as AdS-G and supernatant from (insulin + glucose)-stimulated adipocytes as AdS-IG. 2.3. VSMC Culture VSMC were isolated from 10 weeks old C57BL/6J mice as previously described [12]. Briefly, dissected aor- tas were discarded of its adventitia, cut in 2 mm square pieces and incubated in 1.5 mg/ml collagenase type II solution (37˚C; 5% CO2; 5 hr). Dissociated cells were suspended in 5 ml of DMEM and centrifuged at 300 × g for 5 min. The pellet was resuspended in 700 μl DMEM supplemented with 10% serum and transferred to a single well of a 48-well plate and left untreated for 5 days. VSMC purity was assessed by confocal microscopy upon 4 amplification passages [12] before treatment with AdS. To separate the effects of insulin and glucose from the effects of secreted factors from adipocytes on VSMC in AdS, insulin and glucose stimulations on VSMC were used as controls for each experiment. Each condition was tested in duplicate and expressed as percentage compared to control. 2.4. Cell Migration Assay Confluent VSMC were serum starved overnight before a 24 hr treatment with AdS or appropriate controls. Cells (5 × 10³) were loaded into the upper chamber of a 24- transwell plate with an 8 μm pore membrane. Fibroblast growth factor (bFGF), which was used as the chemo- attractant, was added into the lower chambers at 10 ng/ ml. Following 5 h of incubation (37˚C; 5% CO2), the membrane was fixed with paraformaldehyde, stained with 4’,6’-diamidino-2-phenylindole and scanned on a microscope. The number of migrated cells was counted in five random fields for each sample. 2.5. Characterization of VSMC Cells were cultured and allowed to grow near conflu- ence on 8 mm glass lamella. Following two washes in DMEM, cells were fixed in 4% paraformaldehyde and permeabilized with 0.1% Triton X-100. The cells were then washed and subsequently blocked for 1 hr in 2% normal goat serum. After washing with PBS BSA1%, cells were incubated with an anti-α smooth muscle actin antibody (NeoMarker, USA) over night at 4˚C. After incubation, the cells were washed twice in PBS BSA 1% and further incubated with an affinity purified Alexa 488- conjugated anti-rabbit antibody (Invitrogen, USA). Fluo- rescent specimens were visualized under a microscope and photographed. FA incorporation in AdS-treated VSMC was evaluated by Oil-Red-O staining. Cells were fixed in 10% formalin for 15 minutes. 60% isopropanol was then added before completely drying wells. A stock of 0.5% ORO staining solution was prepared in 60% triethyl phosphate (TEP, Sigma) and filtered. A working solution was prepared by mixing 30 ml of ORO stock solution with 50 ml of PBS, filtered through a 1 µm filter and added to the dried wells. Following a 1-hour incubation period, the ORO solution was removed and cells were washed in PBS prior to pic- Copyright © 2013 SciRes. OPEN ACCESS  S. El Akoum et al. / Journal of Diabetes Mellitus 3 (2013) 227-23 5 Copyright © 2013 SciRes. OPEN ACCESS 229 ture acquisition using a light microscope equipped with a video camera. 2.6. Quantification of mRNA Level Total RNA was isolated using Qiazol reagent accord- ing to the manufacture’s instructions (Qiagen, Toronto, ON, Canada). Single-strand cDNA was synthesized ac- cording to the procedure in the iScript cDNA Synthesis Kit manual (Bio-Rad Laboratories, Montreal, QC, Can- ada). Q-PCR reactions were carried out using the Bril- liant-II SYBR® Green Master-Mix (Stratagene, Missis- sauga, ON, Canada) and specific primers for CD36 sca- venger receptor (Fwd: 5’-GCC-AAG-CTA-TTG-CGA-CAT- GA-3’; Rev: 5’-AAG-GCA-TTG-GCT-GGA-AGA-AC- 3’) and insulin receptor (Fwd: 5’-CAG-AGA-AGG-TCT- CTC-GGA-CT-3’; Rev: 5’-TGG-AGA-GGT-AGA-TGA- GCC-GC-3’). The mRNA levels were normalized to Cyclophilin-A expression levels (Fwd: 5’-CCG-ATG- ACG-AGC-CCT-TGG-3’; Rev: 5’-GCC-GCC-AGT- GCC-ATT-ATG-3’). The targeted and reference genes were amplified in duplicates using the Mx3000P Q-PCR System (Stratagene). The relative quantification of target genes was determined using the MxProTM Q-PCR soft- ware version 3.00 (Strategene) as previously described [12]. 2.7. Biochemical Assay Adiponectin and leptin concentrations within AdS were measured using a mouse ELISA kit according to the manufacturer’s protocol (ALPCO). Prior to analysis, samples were thawed on ice and rapidly used. 2.8. Statistical Analysis All statistical analyses were performed separately for males and females. Data are presented as mean ± stan- dard deviation for continuous variables. Repeated measures analysis of variance (ANOVA) models were used to compare adiponectin and leptin levels within supernatants from adipocytes between groups (SD, VD and AD groups). Cell migration data and mRNA levels were compared between groups (SD, VD and AD groups) using an ANOVA model. In addition, the relationships among adiponectin and leptin levels, and mRNA levels and migration parameters were investigated using Pearson or Spearman correla- tions according to the nature of the distribution data. All analyses were done using SAS version 9.1 (SAS Institute Inc., Cary, NC, USA) and data ≤0.05 were con- sidered significance. 3. RESULTS HFD-triggered obesity in corresponding mouse groups correlated with increased leptin levels in systemic circu- lation (Table 1) [11]. The development of T2D in HFD groups within male mice was also linked to decreased adiponectin levels in sera. In the AD group, mice also demonstrated hyperinsulinemia. The blood profile of adipokines was diet-dependant, as HFD-fed mice showed decreased adiponectin and increased leptin mRNA levels within the abdominal visceral white adipose tissue, in comparison to SD-fed mice. To characterize the effect of these modulations on VSMC, abdominal adipocytes were isolated from each animal group and used to condition culture media. 3.1. Biochemical Characteristics To determine whether the differential effects of the AdS subtypes were attributable to variation in production of adipokines, we examined their leptin and adiponectin contents. These two adipokines are known for their im- portant role in cellular glucose and lipid homeostasis. Table 1. In vivo mice parameter after 20 weeks of diet. Weight gain, glycemic parameters and adipokines secretion profile evaluated in fasted sera mice. mRNA levels of leptin and adiponectin in visceral abdominal adipose tissue were also evaluated at the sacrifice. *P < 0.05, **P < 0.01, ***P < 0.001 vs. SD; #P < 0.05, ##P < 0.01 vs. VD. Diet groups SD VD AD Weight gain (g) 11.8 ± 0.9 28.1 ± 1.3*** 23.9 ± 1.6*** Fasting glycæmia (mM) 4.0 ± 0.2 9.0 ± 0.6*** 8.3 ± 0.6*** Fasting insulinæmia (μg/ml) 0.3 ± 0.1 0.4 ± 0.1 0.7 ± 0.1** # Fasting leptin level (μg/ml) 0.06 ± 0.013 0.58 ± 0.05*** 0.8 ± 0.07*** ## Fasting adiponectin level (μg/ml) 1.97 ± 0.15 1.40 ± 0.12** 1.24 ± 0.15*** Fasting FA level (μM) 0.51 ± 0.12 1.13 ± 0.04* 1.18 ± 0.22* Leptin mRNA level in adipose tissue 0.78 ± 0.18 3.93 ± 0.26*** 5.39 ± 0.64*** Adiponectin mRNA level in adipose tissue 1.24 ± 0.08 0.53 ± 0.06*** 0.61 ± 0.06***  S. El Akoum et al. / Journal of Diabetes Mellitus 3 (2013) 227-23 5 230 Their inverse interactions are linked to metabolic disor- ders and vascular alterations. Leptinemia was increased by 4 fold in AdS-U from HFD groups, as compared to the SD group (Table 2). Hyper-leptinemia was further increased in response to insulin and/or glucose stimulations in HFD groups, com- pared to unstimulated cells where maximum levels were reached with AdS-G. On the other hand, adiponectin levels were decreased as expected in AdS-U of adipocytes from HFD-fed mice, in comparison to the SD group (Table 2). In the SD group, adiponectin concentrations were increased by 30% in AdS-I, 70% in AdS-IG, and 96% in AdS-G, as compared to AdS-U. The effect of insulin adiponectin secretions was not significant in AD and VD group, compared to unstimulated cells. However, it was in- creased by the addition of glucose (AdS-IG: 140% for VD and 127% for AD) or glucose alone (AdS-G: 350% for VD and 222% for AD), compared to unstimulated fat cells. Despite these differences, adiponectin concentra- tions in HFD-derived AdS remained 30% to 70% higher in the corresponding controls from the SD group (Table 2). 3.2. Effects of AdS on VSMC Migration The migration process of VSMC is critical for vascu- logenesis and vascular repair. Insulin and glucose treat- ments significantly increased VSMC migration by 10 to 33%, compared to untreated cells (Figure 1(B)). To characterize the impact of AdS on VSMC physiology, we evaluated VSMC migration capabilities after 24 hr of treatment with AdS. All AdS from SD-derived adipo- cytes reduced migration of VSMC; albeit to a lesser ex- tend in the case of AdS-G (Figure 1(A)). In contrast, all AdS from HFD-fed mice showed a strong pro-migratory effect on VSMC (65% - 70% increase). This diet-induced effect was more prominent in HFD groups with AdS-I (200%), AdS-IG (230%) and AdS-G (260%), compared to AdS-U. The impact of AdS on VSMC migration was also re- flected by their cytoskeleton arrangement. While freshly extracted VSMC showed a twisted form with parallel α-actin filaments [12], this process was absent in AdS-U from SD mice, while light disorganization of the actin filaments was noted (Figure S1(A)). Conversely, in the AdS-U-VD group, VSMC showed disorganized parallel actin filament structures with some migratory extensions (Figure S1(B)), while supernatants from AD groups il- lustrated increased fibers’ disorder (Figure S1(C)). These effects were not associated with parallel α-actin filaments and microscopic snapshots showed blurring and dot staining, reporting most probably actin polym- erization that lead to extension of the leading edge. 3.3. Insulin Receptor Gene Modulation Since the metabolism of VSMC depends upon glucose, we evaluated the gene expression profile of InsR, which is responsible for glucose uptake. In control VSMC, only insulin and glucose stimulations significantly reduced InsR expression levels (0.55 ± 0.02), compared to un- Table 2. Adiponectin and leptin levels in adipocytes’ supernatants (AdS). Adiponectin and leptin levels were evaluated in AdS of untreated (AdS-U), insulin-treated (AdS-I), glucose-treated (AdS-G) and insulin and glucose treated (AdS-IG) mature adipocytes extracted from visceral abdominal adipose pad of each mice group. Treatments were maintained for 24h. For a same diet: *P < 0.05 vs AdS-U; **P < 0.05 vs. AdS-I; ***P < 0.05 vs. AdS-IG. For a same stimulation: †P < 0.05 vs. SD; ††P < 0.05 vs. VD. Diet groups Adipocytes’ supernatants Adiponectin level (ng/ml) ± SEM Leptin level (ng/ml) ± SEM AdS-U 2.75 ± 0.46 0.33 ± 0.03 AdS-I 3.61 ± 0.21* 0.47 ± 0.04 AdS-G 4.69 ± 0.04* ** 0.55 ± 0.03* SD AdS-IG 5.40 ± 0.51*** 0.77 ± 0.05* ** *** AdS-U 0.75 ± 0.11† 1.20 ± 0.09† AdS-I 0.82 ± 0.27† 1.78 ± 0.05* † AdS-G 1.79 ± 0.29* ** † 2.25 ± 0.16* ** † VD AdS-IG 3.36 ± 0.62* ** *** † 2.74 ± 0.09* ** *** † AdS-U 1.00 ± 0.22† 1.42 ± 0.09† †† AdS-I 1.43 ± 0.14† †† 1.81 ± 0.03* † AdS-G 2.27 ± 0.39* ** † 2.18 ± 0.07* ** † AD AdS-IG 3.22 ± 0.38* ** *** † 2.65 ± 0.04* ** *** † Copyright © 2013 SciRes. OPEN ACCESS  S. El Akoum et al. / Journal of Diabetes Mellitus 3 (2013) 227-23 5 231 Figure 1. (A) VSMC migration rate after 24 hr of treatment with AdS of male mice. These results are expressed as per- centage of proliferation rate of unstimulated cells; (B) Incu- bation of VSMC with insulin or glucose for 24 hours was used as control compared to unstimulated cells. For a same diet: *P < 0.05 vs AdS-U; **P < 0.05 vs. AdS-I; ***P < 0.05 vs. AdS-IG. For a same stimulation: #P < 0.05 vs. SD; ##P < 0.05 vs. VD. In control treatments: +P < 0.05 vs unstimulated cells (Ø); ++P < 0.05 vs insulin stimulated cells. stimulated (1.01 ± 0.11) and insulin (0.85 ±0.11) or glu- cose (1.22 ± 0.25) stimulated cells (Figure 2(B)). In AdS-treated cells, unstimulated adipocytes did not in- duce any significant modulation of InsR mRNA in VSMC compared to control (Figure 2(A)). Stimulation of adipocytes from the SD group with insulin or glucose significantly decreased InsR expression levels by 30 and 75% respectively, compared to unstimulated cells. In contrast, adipocytes from VD and AD groups showed no effect on InsR gene expression in VSMC compared to unstimulated condition. Moreover, insulin + glucose sti- mulation was without any effect on InsR gene expression in SD groups, compared to unstimulated adipocytes. Fur- thermore, while adipocytes from AD groups slightly in- creased InsR mRNA levels in VSMC compared to un- stimulated cells, those from VD groups markedly in- creased InsR levels in VSMC (1.25 ± 0.11) in response to insulin + glucose stimulation compared to the other culture conditions and to SD derived AdS. Figure 2. (A) InsR mRNA expression level in VSMC is up- regulated with AdS stimulation extracted from AD-fed group; (B) The basic InsR VSMC expression level (Ø) is reported as 100% expression gene level. Insulin + glucose stimulation de- crease InsR mRNA level without any significant modulation of this parameter after insulin or glucose VSMC treatment (B). For a same diet group: *P < 0.05 vs AdS-U; **P < 0.05 vs. AdS-I; ***P < 0.05 vs. AdS-IG. For a same stimulation: #P < 0.05 vs. SD; ##P < 0.05 vs. VD. In control treatments: +P < 0.05 vs unstimulated cells (Ø), ++P < 0.01 vs insulin-stimulated cells, +++P < 0.01 vs insulin + glucose (Ins/Glu)-stimulated cells. 3.4. VSMC Fatty Acids Accumulation Formation The impact of AdS on VSMC physiology could also be linked to FA released by adipocytes. Modulation of FA receptors may be an indicator of their implication in VSMC alterations. We evaluated CD36 mRNA expres- sion levels in VSMC, a scavenger receptor recognized for its role in the atherogenesis process [8]. Insulin stimulation increased CD36 mRNA expression levels by 2 fold in VSMC, compared to unstimulated and glucose stimulated cells (Figure 3(B)). In addition, glucose alone increased CD36 mRNA levels by 30% (Figure 3(B)). In AdS treated cells, when VSMC were exposed to AdS-U from HFD groups, CD36 mRNA levels were signifi- cantly enhanced (0.48 ± 0.05 for VD; 0.88 ± 0.55 for AD), compared to SD groups (0.02 ± 0.13) (Figure Copyright © 2013 SciRes. OPEN ACCESS  S. El Akoum et al. / Journal of Diabetes Mellitus 3 (2013) 227-23 5 232 Figure 3. (A) CD36 scavenger receptor mRNA expression level in AdS-treated VSMC in different mouse groups is modu- lated depending on the type of treatment; (B) Incubation of VSMC with insulin or glucose for 24 hours was used as control compared to unstimulated cells. For a same diet: *P < 0.05 vs AdS-U; **P < 0.05 vs. AdS-I; ***P < 0.05 vs. AdS-IG. For a same stimulation: #P < 0.05 vs. SD; ##P < 0.05 vs. VD. In con- trol treatments: +P < 0.05 vs unstimulated cells (Ø); ++P < 0.05 vs insulin stimulated cells; +++P < 0.05 vs insulin/glucose sti- mulated cells. 3(A)). AdS-I of all diet groups increased CD36 mRNA expression levels in VSMC with still higher levels in VD (1.84 ± 0.09) and AD (2.10 ± 0.02) groups, compared to the SD group (1.03 ± 0.11). AdS-G increased scavenger receptor mRNA expression in VSMC in SD (0.43 ± 0.15), VD (0.90 ± 0.03) and AD (1.07 ± 0.02) groups following a similar pattern but at a lesser extent than AdS-I. Finally, a cumulative impact was observed in AdS-IG stimulation in SD (1.99 ± 0.14) and AD (2.67 ± 0.02) groups, com- pared to AdS-I and AdS-G; an effect absent in the VD group (1.68 ± 0.21). On the other hand, Oil-Red-O staining was done to re- late FA incorporation after supernatant treatment to CD36 increased levels. In SD groups, AdS-U showed no increase of FA incorporation compared to untreated cells. In HFD groups, supernatants increased FA incorporation in VSMC when stimulated with AdS-U (Figure S2), with a more marked coloration in AD groups compared to VD groups. 4. DISCUSSION The physiologic alterations of VSMC triggered by adipocyte conditioned media was recently addressed in humans [13]. The novelty of this study is the evaluation of the impact of adipocyte-conditioned media on VSMC in a model of obesity and T2D. Adipocytes were isolated from abdominal adipose tis- sues of male mice at different stages of metabolic altera- tions [11] to condition VSMC culture medium. The pro- tocol was set to reproduce a culture environment that mimics in vivo hyperglycemic and/or hyperinsulinic con- ditions. Adipocytes were stimulated with glucose, insulin or both. Their impact on VSMC was compared to un- stimulated cells. Obesity-linked adipocyte alterations modulate VSMC migration, an important cellular process in atherogenesis. We previously demonstrated that AdS decreases VSMC proliferation and correlates with adiponectin and leptin unbalance [12]. In the present study, we showed that VSMC migration was statistically correlated with adiponectin and leptin changes in AdS. Indeed, recent observations have shown that adiponectin deprivation results in neointima hyper- plasia, while leptin promotes VSMC migration [14,15]. Equivalent numbers of cultured adipocytes are not trans- posed in the same adipokine secretion profile in all diet groups. A sharp decrease in adiponectin levels, coupled to hyper-leptinemia, was correlated with increased VSMC migration in HFD groups. Insulin ± glucose treatments further increased the migratory potential of VSMC, pos- sibly due to higher secreted levels of leptin in AdS. De- creased adiponectin levels also contribute to the increase VSMC migration potential, since this adipokine is known to inhibit the migratory process [16]. These modulations were also reflected by the arrangement of the α-actin filaments, as reported by confocal microscopy. We have shown different stages of filament disorganizations and correlated them with an increased level of migration in AdS extracted from HFD mice groups. These disorders in the cytoskeleton are most probably due to increased actin dis-polymerization and re-polymerization events, given stimulation of the migratory mechanism [17,18]. Dot staining shown in AD groups relates to a higher level of soluble actin monomers needed to polymerize and form filaments [18,19]. This will lead to this snapshot showing the formation of actin filaments that will push the leading cell front forward and catalyzing VSMC mi- gration [18,20]. In accordance with the above-discussed hypothesis, released FA could impact glucose cell homeostasis and Copyright © 2013 SciRes. OPEN ACCESS  S. El Akoum et al. / Journal of Diabetes Mellitus 3 (2013) 227-23 5 233 response to insulin. InsR gene expression levels in VSMC were decreased in the presence of insulin + glucose, compared to unstimulated VSMC. This level was in- creased when cells were stimulated with glucose alone, compared to insulin + glucose stimulated cells. In the presence of AdS treatment, InsR mRNA levels increased in AdS-I and AdS-G from AD groups compared to both SD and VD groups. Saturated FA present at high concen- trations in AD is known to block insulin activation [21] and induce hyperleptinemia, which has been reported to impair insulin signaling pathways [22]. This was noticed in this study with the lack of insulin-induced adiponectin release in AdS in HFD groups compared to SD. To coun- teract the effect of reduced glucose uptake, VSMC in- crease their InsR expression levels. In contrast, VD im- proves lipogenesis and lowers FA in AdS through its high level of oleic acid, which has been documented to trigger insulin sensitivity [23] and lead to a lower InsR mRNA levels. Adipocytes used in this protocol were conditioned by food diets during 20 weeks. Mice of HFD groups were hyperglycemic; a status usually associated with elevated advanced glycation end products (A-GEP). We hypothe- sized that A-GEP present in these adipocytes attenuate their insulin sensitivity and abolish insulin-activated li- pogenesis [24]. In this situation, adipocytes from HFD- groups had increased lipolysis activity, which leads to FA release increase and VSMC migration [3,25]. These mice had an increased serum concentration of FA compared to SD; a profile directly linked to the activ- ity of abdominal adipocytes. FA rich AdS from HFD- mice can stimulate PPARγ in VSMC, triggering CD36 gene expression [8,26]. CD36 plays a key role in FA acid uptake and regulation in vivo [27]. Adipokines were also reported to regulate CD36 ex- pression [28] and therefore FA accumulation in VSMC and morphologic modulations. While leptin increases CD36 expression in VSMC, adiponectin prevents it [29, 30]. Thus, VSMC treated with AdS from HFD groups modulate their CD36 expression in correlation with lep- tin and adiponectin levels contained in the culture media. CD36 mRNA upregulation levels are correlated with in- creased Oil-Red-O cell staining in corresponding diet groups, indicative of FA accumulation in VSMC cyto- plasm [31]. This accumulation does not seem to influence migratory potentials, even though we have shown that AdS from HFD groups increases apoptotic factors [12]. In fact, it has been reported that caveolin contained in muscle cells sequester FA on the cytoplasmic membrane [32]. This could protect the actin fluency and migration potential even if the apoptosis process is triggered. Further studies will be needed to further characterize this aspect of morphologic alteration and FA accumula- tion. All together, these data indicate that the development of adipocyte-induced VSMC alterations is linked to the FA diet composition and the degree of metabolic altera- tions. Such alterations trigger adipokine unbalance from adipocytes, defining VSMC migration and FA cytoplas- mic accumulation. Thus, adipocyte alterations would directly influence VSMC transmigration towards the arterial media and thereby inducing, at the same time, apoptosis and foam cell formation. Simultaneously, these events may trigger atherogenesis by the migration of VSMC-derived foam cells in the intima and stimulate inflammatory cell recruitment into the arterial wall. These results may contribute to better understand the complex interplay between adipocytes and vascular cells that lead to increased atherosclerotic events in obe- sity-linked metabolic syndromes. 5. CONCLUSIONS AND LIMITATIONS The current study appears to be compelling, and makes a significant contribution to the field of athero- genesis process as well as the understanding of the im- pact of the adipose tissue on VSMC. It reflects the direct impact of adipose tissue secretion cocktail on the VSMC migratory potential; and it’s also a main characteristic that affects atherogenesis. Further, the originality of this study is the evaluation of these secretions of adipocytes provided from mice groups showing different levels of metabolic alterations. In spite of this, the current research acknowledges a few limitations that should be noted to help interpret the results, and be added to the data on the relationships be- tween adipose tissue and vascular wall cells physiology. In fact, due to material limitations, we have used adipo- cytes extracted from abdominal white adipose tissue in- stead of those of perivascular adipose tissue that are in direct contact with the vascular wall. Even if these two types of tissue are comparable, their localization in the body could affect their physiology [33]. The amount of perivascular tissue is very limited in our protocol mice and the quantity couldn’t cover all our stimulation condi- tions. However, we can speculate that the effect would be very close between these two types of white adipose tis- sues. 6. ACKNOWLEDGMENTS The authors gratefully thank Louis Villeneuve from the Montreal Heart Institute for immunostaining and confocal microscopy advices and Mariève Cossette from the Montreal Heart Institute Coordinating Centre for the statistical analyses. REFERENCES [1] Casey, R.G., Gang, C., Joyce, M. and Bouchier-Hayes, Copyright © 2013 SciRes. OPEN ACCESS  S. El Akoum et al. / Journal of Diabetes Mellitus 3 (2013) 227-23 5 234 D.J. (2007) Taurine attenuates acute hyperglycaemia-in- duced endothelial cell apoptosis, leucocyte-endothelial cell interactions and cardiac dysfunction. Journal of Vas- cular Research, 44, 31-39. http://dx.doi.org/10.1159/000097893 [2] Hennig, B., Toborek, M. and McClain, C.J. (2001) High- energy diets, fatty acids and endothelial cell function: Implications for atherosclerosis. Journal of the American College of Nutrition, 20, 97-105. http://dx.doi.org/10.1080/07315724.2001.10719021 [3] Rodriguez-Lee, M., Ostergren-Lunden, G., Wallin, B., Moses, J., Bondjers, G. and Camejo, G. (2006) Fatty acids cause alterations of human arterial smooth muscle cell proteoglycans that increase the affinity for low-density lipoprotein. Arteriosclerosis, Thrombosis, and Vascular Biology, 26, 130-135. http://dx.doi.org/10.1161/01.ATV.0000191659.94059.62 [4] Ross, R. (1999) Atherosclerosis—An inflammatory dis- ease. New England Journal of Medicine, 340, 115-126. http://dx.doi.org/10.1056/NEJM199901143400207 [5] Mulvihill, E.R., Jaeger, J., Sengupta, R., Ruzzo, W.L., Reimer, C., Lukito, S., et al. (2004) Atherosclerotic pla- que smooth muscle cells have a distinct phenotype. Arte- riosclerosis, Thrombosis, and Vascular Biology, 24, 1283- 1289. http://dx.doi.org/10.1161/01.ATV.0000132401.12275.0c [6] Bentzon, J.F., Weile, C., Sondergaard, C.S., Hindkjaer, J., Kassem, M. and Falk, E. (2006) Smooth muscle cells in atherosclerosis originate from the local vessel wall and not circulating progenitor cells in ApoE knockout mice. Arteriosclerosis, Thrombosis, and Vascular Biology, 26, 2696-2702. http://dx.doi.org/10.1161/01.ATV.0000247243.48542.9d [7] Rong, J.X., Shapiro, M., Trogan, E. and Fisher, E.A. (2003) Transdifferentiation of mouse aortic smooth mus- cle cells to a macrophage-like state after cholesterol loading. Proceedings of the National Academy of Sci- ences of the United States of America, 100, 13531-13536. http://dx.doi.org/10.1073/pnas.1735526100 [8] Lim, H.J., Lee, S., Lee, K.S., Park, J.H., Jang, Y., Lee, E.J., et al. (2006) PPARgamma activation induces CD36 expression and stimulates foam cell like changes in rVSMCs. Prostaglandins & Other Lipid Mediators, 80, 165-174. http://dx.doi.org/10.1016/j.prostaglandins.2006.06.006 [9] Antuna-Puente, B., Feve, B., Fellahi, S. and Bastard, J.P. (2008) Adipokines: The missing link between insulin re- sistance and obesity. Diabetes & Metabolism, 34, 2-11. http://dx.doi.org/10.1016/j.diabet.2007.09.004 [10] Fantuzzi, G. (2005) Adipose tissue, adipokines, and in- flammation. Journal of Allergy and Clinical Immunology, 115, 911-919. http://dx.doi.org/10.1016/j.jaci.2005.02.023 [11] El Akoum, S., Lamontagne, V., Cloutier, I. and Tanguay, J.F. (2011) Nature of fatty acids in high fat diets differen- tially delineates obesity-linked metabolic syndrome com- ponents in male and female C57BL/6J mice. Diabetology & Metabolic Syndrome, 3, 34. http://dx.doi.org/10.1186/1758-5996-3-34 [12] El Akoum, S., Cloutier, I. and Tanguay, J.F. (2011) Vas- cular smooth muscle cell alterations triggered by mice adipocytes: Role of high-fat diet. Journal of Atheroscle- rosis and Thrombosis, 19, 1128-1141. http://dx.doi.org/10.5551/jat.13482 [13] Lamers, D., Schlich, R., Greulich, S., Sasson, S., Sell, H. and Eckel, J. (2011) Oleic acid and adipokines synergize in inducing proliferation and inflammatory signaling in human vascular smooth muscle cells. Journal of Cellular and Molecular Medicine, 15, 1177-1188. http://dx.doi.org/10.1111/j.1582-4934.2010.01099.x [14] Kubota, N., Terauchi, Y., Yamauchi, T., Kubota, T., Moroi, M., Matsui, J., et al. (2002) Disruption of adiponectin causes insulin resistance and neointimal formation. Jour- nal of Biological Chemistry, 277, 25863-25866. http://dx.doi.org/10.1074/jbc.C200251200 [15] Oda, A., Taniguchi, T. and Yokoyama, M. (2001) Leptin stimulates rat aortic smooth muscle cell proliferation and migration. Kobe Journal of Medical Sciences, 47, 141- 150. [16] Asterholm, I.W. and Scherer, P.E. (2010) Enhanced meta- bolic flexibility associated with elevated adiponectin lev- els. American Journal of Pathology, 176, 1364-1376. http://dx.doi.org/10.2353/ajpath.2010.090647 [17] Wanger, M. and Wegner, A. (1985) Equilibrium constant for binding of an actin filament capping protein to the barbed end of actin filaments. Biochemistry, 24, 1035- 1040. http://dx.doi.org/10.1021/bi00325a035 [18] Pollard, T.D. and Borisy, G.G. (2003) Cellular motility driven by assembly and disassembly of actin filaments. Cell, 112, 453-465. http://dx.doi.org/10.1016/S0092-8674(03)00120-X [19] Wang, Y.L. (1985) Exchange of actin subunits at the leading edge of living fibroblasts: Possible role of tread- milling. Journal of Cell Biology, 101, 597-602. http://dx.doi.org/10.1083/jcb.101.2.597 [20] Mitchison, T.J. and Cramer, L.P. (1996) Actin-based cell motility and cell locomotion. Cell, 84, 371-379. http://dx.doi.org/10.1016/S0092-8674(00)81281-7 [21] Chavez, J.A. and Summers, S.A. (2003) Characterizing the effects of saturated fatty acids on insulin signaling and ceramide and diacylglycerol accumulation in 3T3-L1 adipocytes and C2C12 myotubes. Archives of Biochemis- try and Biophysics, 419, 101-109. http://dx.doi.org/10.1016/j.abb.2003.08.020 [22] Benomar, Y., Wetzler, S., Larue-Achagiotis, C., Djiane, J., Tome, D. and Taouis, M. (2005) In vivo leptin infusion impairs insulin and leptin signalling in liver and hypo- thalamus. Molecular and Cellular Endocrinology, 242, 59-66. http://dx.doi.org/10.1016/j.mce.2005.07.003 [23] Soriguer, F., Esteva, I., Rojo-Martinez, G., Ruiz de Adana, M.S., Dobarganes, M.C., Garcia-Almeida, J.M., et al. (2004) Oleic acid from cooking oils is associated with lower insulin resistance in the general population (Pizarra study). European Journal of Endocrinology, 150, 33-39. http://dx.doi.org/10.1530/eje.0.1500033 [24] Unoki, H., Bujo, H., Yamagishi, S., Takeuchi, M., Imai- zumi, T. and Saito Y. (2007) Advanced glycation end pro- ducts attenuate cellular insulin sensitivity by increasing the generation of intracellular reactive oxygen species in Copyright © 2013 SciRes. OPEN ACCESS 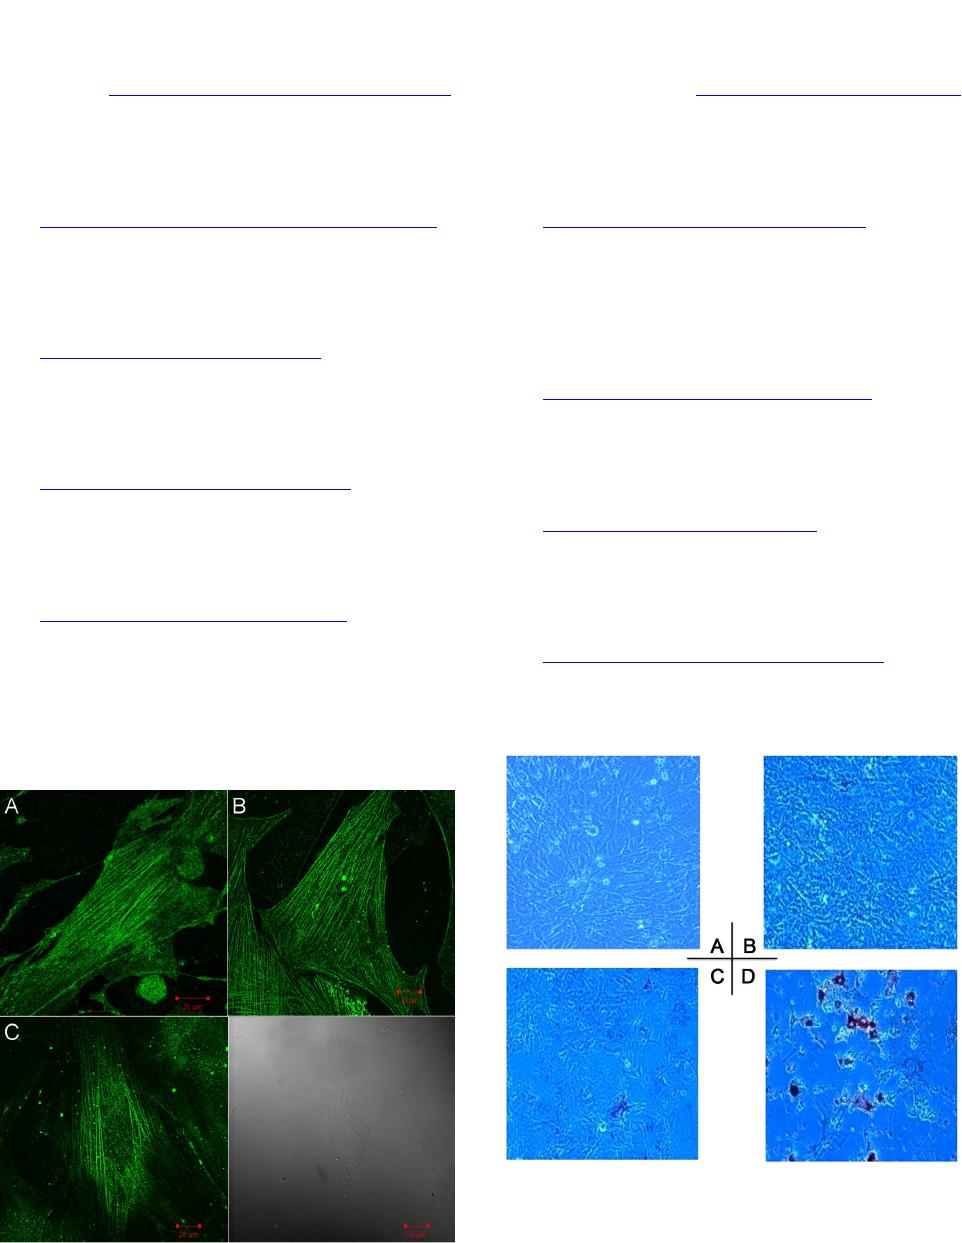 S. El Akoum et al. / Journal of Diabetes Mellitus 3 (2013) 227-23 5 Copyright © 2013 SciRes. 235 adipocytes. Diabetes Research and Clinical Practice, 76, 236-244. http://dx.doi.org/10.1016/j.diabres.2006.09.016 [25] Artwohl, M., Lindenmair, A., Roden, M., Waldhausl, W.K., Freudenthaler, A., Klosner, G., et al. (2009) Fatty acids induce apoptosis in human smooth muscle cells de- pending on chain length, saturation, and duration of ex- posure. A t hero s cle rosis , 202, 351-362. http://dx.doi.org/10.1016/j.atherosclerosis.2008.05.030 OPEN ACCESS [26] Sharma, A.M. and Staels, B. (2007) Review: Peroxisome proliferator-activated receptor gamma and adipose tis- sue—Understanding obesity-related changes in regulation of lipid and glucose metabolism. Journal of Clinical En- docrinology & Metabolism, 92, 386-395. http://dx.doi.org/10.1210/jc.2006-1268 [27] Febbraio, M., Abumrad, N.A., Hajjar, D.P., Sharma, K., Cheng, W., Pearce, S.F., et al. (1999) A null mutation in murine CD36 reveals an important role in fatty acid and lipoprotein metabolism. Journal of Biological Chemistry, 274, 19055-19062. http://dx.doi.org/10.1074/jbc.274.27.19055 [28] Lee, T.S., Lin, C.Y., Tsai, J.Y., Wu, Y.L., Su, K.H., Lu, K.Y., et al. (2009) Resistin increases lipid accumulation by affecting class A scavenger receptor, CD36 and ATP- binding cassette transporter-A1 in macrophages. Life Sci- ences, 84, 97-104. http://dx.doi.org/10.1016/j.lfs.2008.11.004 [29] Konstantinidis, D., Paletas, K., Koliakos, G. and Kaloy- ianni, M. (2008) Signaling components involved in lep- tin-induced amplification of the atherosclerosis-related properties of human monocytes. Journal of Vascular Re- search, 46, 199-208. http://dx.doi.org/10.1159/000161234 [30] Ouchi, N., Kihara, S., Arita, Y., Nishida, M., Matsuyama, A., Okamoto, Y., et al. (2001) Adipocyte-derived plasma protein, adiponectin, suppresses lipid accumulation and class A scavenger receptor expression in human mono- cyte-derived macrophages. Circulation, 103, 1057-1063. http://dx.doi.org/10.1161/01.CIR.103.8.1057 [31] Sanchez-Hidalgo, M., Lu, Z., Tan, D.X., Maldonado, M.D., Reiter, R.J. and Gregerman, R.I. (2007) Melatonin inhibits fatty acid-induced triglyceride accumulation in ROS17/2.8 cells: Implications for osteoblast differentia- tion and osteoporosis. American Journal of Physiology. Regulatory, Integrative and Comparative Physiology, 292, R2208-R2215. http://dx.doi.org/10.1152/ajpregu.00013.2007 [32] Simard, J.R., Meshulam, T., Pillai, B.K., Kirber, M.T., Brunaldi, K., Xu, S., et al. (2010) Caveolins sequester FA on the cytoplasmic leaflet of the plasma membrane, aug- ment triglyceride formation, and protect cells from lipo- toxicity. Journal of Lipid Research, 51, 914-922. http://dx.doi.org/10.1194/jlr.M900251 [33] Palou, M., Sanchez, J., Priego, T., Rodriguez, A.M., Pico, C. and Palou, A. (2010) Regional differences in the ex- pression of genes involved in lipid metabolism in adipose tissue in response to short- and medium-term fasting and refeeding. Journal of Nutritional Biochemistry, 21, 23-33. http://dx.doi.org/10.1016/j.jnutbio.2008.10.001 SUPPLEMENTARY Figure S2. FA accumulation reflected by Oil Red O staining in native VSMC (A) and in VSMC after a 24 h treatment with AdS from SD (B); VD (C) or AD (D) groups. FA accumulation was increased with AdS treatment at different level depending on the diet nature group. Figure S1. Immunocytochemical characterization of VSMC as observed on confocal microscopy after a 24 h treatment with AdS from SD (A); VD (B) or AD (C) groups. α-actin filament disorganization level was increased depending on the diet na- ture group.
|