Journal of Power and Energy Engineering, 2013, 1, 9-14
Published Online November 2013 (http://www.scirp.org/journal/jpee)
http://dx.doi.org/10.4236/jpee.2013.16002
Open Access JPEE
9
Diesel Engine Emissions and Performance Characteristics
under Cape Chestnut Biofuel
Jedidah W. Maina1*, Ayub N. Gitau1, James A. Nyang’aya2
1Department of Environmental and Biosystems Engineering, University of Nairobi, Nairobi, Kenya; 2Department of Mechanical and
Manufacturing En g i n e ering, University of Nairobi, Nairobi, Kenya.
Email: *jedidahwm@gmail.com
Received October 9th, 2013; revised November 11th, 2013; accepted November 19th, 2013
Copyright © 2013 Jedidah W. Maina et al. This is an open access article distributed under the Creative Commons Attribution Li-
cense, which permits unrestricted use, distribution, and reproduction in any medium, provided the original work is properly cited.
ABSTRACT
Cape Chestnut oil was processed to biodiesel thro ugh transest erification. Cape Chestnut kennels are reported to have oil
content of 60% - 63% [1]. Properties of biodiesel were determined and compared with those of diesel and engine tests
done at a constant speed of 1500 RPM on the biodiesel blends to evaluate their performance and emissions characteris-
tics. Performance evaluation was in terms of Brake Specific Fuel Consumption (BSFC), Brake Horse Power (BHP) and
Brake Thermal Efficiency (ETE). The eng ine was initially run on diesel to establish the reference characteristics before
running on biodiesel blends. The biodiesel was blended with diesel volumetrically to 80% (B80), 50% ( B50), 20% (B20)
and 5% (B5) the percentage being the volume of biodiesel in the blended fuel. Diesel fuel had the lowest BSFC fol-
lowed by B5 whose BSFC was 7.3% higher than that of diesel. BTE for B100 was lower than that of diesel by 20.3%
while that of B5 was 7.6% lower. Concentration of SO2 in B100 was 92.7% lower than that of diesel fuel while that of
B20 was 24.7% lower. NO and NO2 concentrations for B100 were around 15% higher than that of diesel. Particulate
matter of less than 10 µm diameter (PM10) for diesel was found to be 72% of the total collected fro m all the test fuels
as compared to that of biodiesel blends at 28%. The study concluded that Cape Chestnut biodiesel blends containing up
to 20% biodiesel can be used in an unmodified diesel engine since their performance and emission characteristics were
very similar to that of diesel but with reduced toxic gas emissions therefore friendly to the environment.
Keywords: Biodiesel; Transesterification; Performance; Emissions; Brake Specific Fuel Consumption; Brake Horse
Power; Engine Thermal Efficiency
1. Introduction
Biofuels are broadly defined as liquids, solids or gaseous
fuels that are predominantly or exclusive ly produced f rom
biomass. The main types of biofuels include ethanol,
biodiesel and biogas derived from crops residues or
wastes. All of these can be used as substitutes or supple-
ments for the traditional fossil fuels used for transporta-
tion, dom estic and industrial uses [2]. It has been the focus
of considerable amount of recent research because it is
renewable and reduces the emissions of some pollutants
[3]. Before recommending any alternative biofuel to be
used in existing technologies on a large scale, the envi-
ronmental compatibility factor has to be considered as
compared to conventional fuel [4].
Increased industrialization and urbanization of the
world have led to a steep rise in demand of petroleum
based fuels. Fossils fuels which constitute 80% of primary
energy consumed in the world are the primary contribu-
tors to Greenhouse Gas Emissions (GHG). Biofuels are
considered environmentally friendly in that they are re-
newable, biodegradable, natural lubricants and generate
acceptable quality of exhaust gases. Recently because of
the increase in crude oil prices, limited resources of fossil
oil and environmental concerns, there has bee n a renewed
focus in vegetable oils and animal fats to make biodiesel
[4].
Kenya spent more than Kshs 230 mil li on to import fuel
and other lubricants in 2010 [5]. The annual avera ge price
of oil in creased from US $79.16 per b arrel in 2010 to US
$110.6 per barrel in 2011 and the demand of petroleum
products gre w by 1.9 pe r cent from 3867.1 thousan d tones
in 2010 to 3941.6 thousan d tones in 2011 [6]. Household
*Corresponding a uthor.
Diesel Engine Emissions and Performance Characteristics under Cape Chestnut Biofuel
10
cooking is another important application where biofuels
can replace charcoal and firewood. Indoor air pollution is
reduced as clean burning fuels and vegetable oils replace
traditional biomass which contributes to respiratory ill-
ness [7].
Since 1990, research into the manufacture and use of
biofuels has grown. It has been reported that carbonyl
compound emissions for diesel powered vehicles have
exceeded those from conventional gasoline vehicles [8].
The depletion of easily accessible supplies of oil and the
high cost of extracting oils from deep seas, remote areas
and politically unstable regions have contributed to re-
newed interest in biofuels as an alternative and renewable
supply of transport fuels and to policies in many countries
that encourage production and mandate consumption of
biofuels. Concerns over global climate change have also
contributed to the renewed interest in biofuels such as the
desire for increased energy security and to support the
rural sector. The rapid increase in global demand for bio-
fuels over the next decad e or more will provid e opportu-
nities for Africa exporters because neither EU nor US is
expected to meet its consumption mandates completely
from domestic production [7].
In Kenya today, the commercial energy sector is domi-
nated by petroleum and electricity as the prime movers of
modern sector of the economy while wood fuel provides
energy needs of the traditional sector including rural
communities and the urban poor. At the national level
wood fuel and othe r biomas s account for about 68% of the
total primary energy consumption followed by petroleum
at 22%, electricity at 9% and others less than 1% [9]. The
Government has enacted a policy paper [9] and Legisla-
tion [10] that favors the development of bioethanol and
biodiesel. Therefore there is need to develop biodiesel
locally which can be produced most efficiently and ef-
fectively consi dering the land use, environm ent, economic
and social issues.
2. Materials and Methods
The engine tests were carried out on a Nissan TD27 die-
sel engine model.
2.1. Test Engine
The engine used was a turbo charged water cooled Nis-
san TD27 4 Cylinder with rated maximum power of 62
Kw/4300rpm. The engine was set to run at a constant
speed of 1500 rpm. The test engine was coupled to a hy-
draulic G-type Froude dynamometer. The loads were
applied by regulating the amount of water going into the
dynamometer, with load increments in steps of 0.225 Kg.
The engine was connected to a pipette to measure fuel
consumption as shown in Figure 1. The 150 ml pipette
was to determine the fuel consumption. The fuel to the
Figure 1. Test diesel engine assembly.
engine was supplied from special hoppers/containers
arranged as shown in Figure 1. Each of the containers
was filled with a different fuel blend. With diesel, B100,
B80, B50, B20 and B5 in the respective containers la-
beled 1, 2, 3, 4, 5 and 6. Individual gate valves on the
fuel lines facilitated the changing to any of the fuel
blends for engine testing.
2.2. Fuel System
The fuel system consisted of fuel hoppers, deliv ery lines,
fuel filters, and injector pumps injector nozzles and over
flow lines. From the fuel hoppers, fuel flows by gravity
through the delivery lines to the filters to the injector
pumps.
2.3. Cooling System
The engine set up was water-cooled, with water flow
assisted by the engine’s water pump. The external circuit
was via a header tank, fitted with a thermometer. The
water temperature in the header tank was maintained at
120˚F (49˚C) by supplying cold water from the mains
and allowing the same amount of hot water to pass to
waste from the system. Thermometers were fitted to
measure the inlet and outlet water temperatures at the
engine.
2.4. Portable Toxic Gas Monitor
These are instruments used to detect and analyze toxic
vapours from the exhaust gases of the test engine. The
instruments were portable, light and easy to use. Each
digital measurements of a particular exhaust gas emission
in low concentrations were viewed in real time from the
monitors. The emission gases which were detected and
Open Access JPEE
Diesel Engine Emissions and Performance Characteristics under Cape Chestnut Biofuel 11
monitored were; SO2, NO and NO2. In order to detect
and measure the particulate matter (PM10) filters were
attached to the engine exhaust pipe. The readings from
the monitors were analyzed in real time of the engine.
2.5. Transesterification
The oil was transesterified using methanol as alcohol and
Potassium Hydroxide (KOH) as the catalyst. Every liter of
Cape Chestnut oil required 200 ml of methanol and the
amount of Potassium H y d ro xide was 1 % by weight of the
Methanol used. The catalyst was kept dry in an airtight
container during the storage since water promotes
saponification. The required amount of catalyst was
measured and dissol ved in t he alcohol befor e pouri ng int o
the corresponding volume of the Cape Chestnut oil. The
mixture was stirred and covered to avoid evaporation of
the alcohol into the atmosphere and left to settle for 24 hrs
after whic h there was a cle ar distin ction of b iodiese l at the
top and glycerin which settled at th e bottom. The alcohol
(methanol) reacted with the fatty acids in the Cape
Chestnut oil in the presence of the catalyst (Potassium
Hydroxide) to form mono alkyl (biodiesel) and glycerin.
2.6. Separation and Washing of the Biodiesel
After transesterification and overnight settling, results
showed methyl esters and glycerin distinctively sep arate.
Glycerin is denser and therefore settled at the bottom of
the containe r. The m ixture needed t o be se parated an d this
was done by sucking out the biodiesel from the top of the
container and leaving glycerin at the bottom to be dis-
posed of.
2.7. Biodiesel Drying
After gently washing three times with warm water, the
biodiesel was left overnight in the open for the evapora-
tion to take p lace and by the following day, all the water
had evaporated and biodiesel was ready for blending and
testing.
The process of biodiesel production from transesteri-
fication, separation, washing and drying took three days to
complete where upon blending was done by measuring
the necessary volumes of biodiesel. The volumes of bio-
diesel were 5, 20, 50 and 80 per cent while the balance of
the volume to make 100 per cent was diesel to make B5,
B20, B50 and B80 blends respectively.
2.8. Biodiesel Fuel Properties
2.8.1. Calorific Value
This was done with the help of a bomb calorimeter.
CTTWE in kj
HCV Mass ofFuel
(1)
where HCV = Higher Cal orific Value; TWE = Total wate r
equivalence in calories; CT=Corrected temperature.
A graph was drawn to determine the corrected tem-
perature rise and then the Equation (1) employed.
Total water equivalent = volume of water in calorimeter
+ water equivalent of bomb.
2.8.2. Specifi c Gra vi t y
The specific gravity of fuel is necessary to determine the
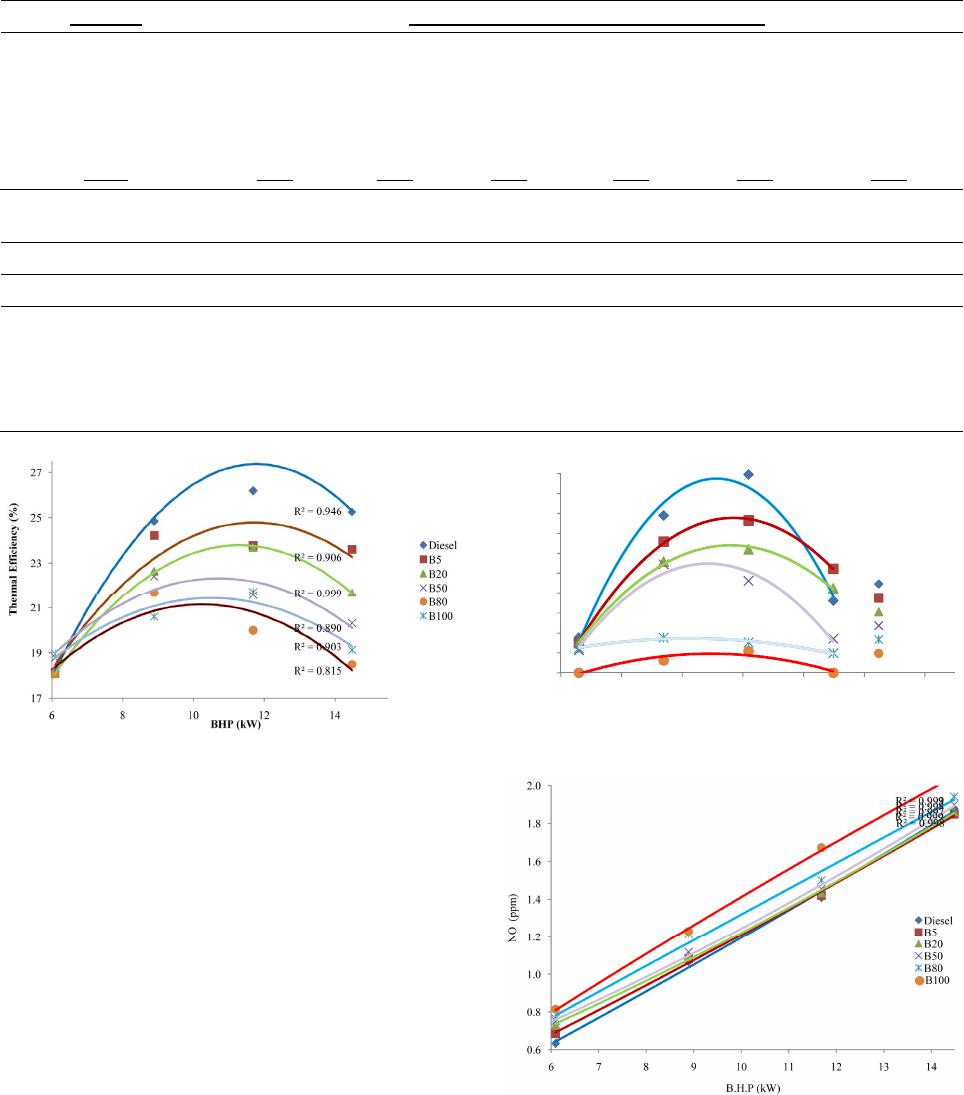
power input of the fuel and hence determine the thermal
efficiency and BSFC. Thermal efficiency, brake horse
power and BSFC were the parameters used to determine
the performance of the fuels in the study. The val ue of 908
Kg/m3 [1] for the density of Cape Chestnut Methyl Ester
was used.
The specific gravity of the blends was calculated using
Equation (2) [11 ].
blend
SG SGii
X
(2)
where SGblend is the specific gravity of blend and SGi
is
the specific gravity of component fuels and Xi is the
volume fraction of the mass i.
2.9. Fuel Consumption Measurement
The various fuels were used i n turns to run t he engine. The
time taken by test engine to consume 150 ml of each fuel
as indicated by the pipette was recorded. In order to start
the process th e p ipette was filled with fu el well abov e th e
top marking by opening the main supply valve. The en-
gine was operated on the main supply while isolating the
fuel from the pipet te. The m ain supply valve was t hen clo-
sed and the e ngine ope rated o n the fuel from the pi pette t o
determine the consumpti on. Subsequentl y , t he load was in-
creased by intervals of 0.225 Kg until the engine started to
run with difficulty at which point the load was considered
to be the maximum for that particular fuel at that speed.
2.10. Measurement of Exhaust Gases
The fuel consumption was recorded concurrently with
sampling of the emissions by the monitors attached to the
engine’s exhaust pipe. The emissions monitors were re-
cording the detected toxic gases NO, SO2 and NO2 at
intervals of every ten seconds in parts per million (ppm).
To evaluate the particulate matter emitted by fuels, a
filter was attached to the engine exhaust pipe which en-
abled it to pick any PM10 emitted as the exhaust gases
exited. Two filters were used, for the diesel and the other
for B100, B80, B50, B20 and B5. The reason why only
one filter was used for all the CCME and its blends is
because the PM10 in them was almost negligible for each
to be considered independently.
2.11. Evaluation of Exhaust Emission Gases and
Particulate Matter
The evaluati ons were d one for t he exhaust e missions f rom
Open Access JPEE
Diesel Engine Emissions and Performance Characteristics under Cape Chestnut Biofuel
12
each fuel running the diesel engine and their quantities in
ppm compared to that of dies el . The em i ssion gase s und e r
consideration were NO, SO2 and NO2. Particulate matter
was also analyzed for neat CCME and its blends and a
comparison was also done with No 2 diesel. To illustrate
the comparison, graph s were drawn to show the tr ends of
each emission gas with time as the engine load was in-
creased which was analyzed as real time. Comparisons
were also done on the fuels to determine the trend on
increasing the percentage of biodiesel in blend with con-
ventional diesel.
2.12. Determination of Brake Power
The loading of the engine was done through the dyna-
mometer which in this study was hydraulic. Brake power
which is the engine power output was calculated from the
load to the engine through dynamometer, dynamometer
shaft speed which in our case was constant at 1500 rpm.
As specified earlier the dynamometer used was Froude
Type-G hydraulic dynamometer. The manufacturer rec-
ommended the Equation (3) below to determine the en-
gine brake power.
0.7457
BrakePower200
WN
(3)
where W = Weight in pounds;
N = Dynamometer shaft speed in RPM;
0.7457 and 200 are constants.
2.13. Determination of Brake Specific Fuel
Consumption (BSFC)
This is calculated from the engine brake power, time (t)
taken to consume the fuel, density and volume of the fuel
because it is the mass flow rate of fuel consumed per unit
power output. It is expressed in Kg/Kw as shown in
Equation (4).
Density Volume 3600
BSFCKgKw h
Brake Powert

(4)
where: t = time taken in seconds to consume a particular
volume of fuel.
2.14. Determination of Thermal Efficiency
This is engine brake power output as a percentage of the
brake power inpu t of the fuel. Therefore to determine the
thermal efficiency, power input had to be determined first
and Equation (5) employed.
DensityVolumeheating value
Powe InputKw
t

(5)
where: t is the time taken to consume a particular volume
of fuel.
After evaluating the power input it was then possible to
determine the thermal efficiency as illustrated in Equation
(6).

BrakePower
Thermal Efficiency%
Powe Input
(6)
3. Results and Discussion
3.1. Engine Performance
The engine performance tests carried out were to deter-
mine the BSFC, BHP and ther mal efficiencies of B5, B20,
B50, B80 and B100 Cape Chestnut biodiesel blends. The
results were compared to those of diesel under the same
conditions. Graphs were drawn of BSFC and thermal
efficiency each against BHP for all the biodiesel blends
and diesel.
3.1.1. Effect of Blending on Brake Specific Fuel
Consumption (BSFC)
Table 1 shows the results of the variation of BSFC with
brake power for the diesel, Cape Chestnut Methyl Ester
(CCME) and their various blen ds. The brake specific fuel
consumption (BSFC) in all the fuels tested decreased as
brake power (BP) increased up to and until BHP of 11 Kw
as shown in Figure 2.
3.1.2. Effect of Blending on Thermal Efficiency
Table 2 shows the results of thermal efficiencies while
Figure 3 shows the trend of thermal efficiency as plotted
against brake horse power for all the test fuels. At the
break power of 11 Kw the thermal efficiency difference
between diesel and B100 was found to be 8.99% which
was a decrease of 31%.
3.2. Analysis of Exhaust Gases from the Test
Engine
The tests were done to detect and determ ine the concentra-
tion of and types of gases in the exhaust emissions during
the running of the engine on Cape Chestnut biodiesel
blends and therefore compared with their concentration
during use of diesel fuel. The exhaust emission gases
R² = 0.972
R² = 0.913
R² = 0.994
R² = 0.899
R² = 0.764
R² = 0.921
0.25
0.30
0.35
0.40
0.45
0.50
579111315
BSFC (Kg/ KW h )
BHP (KW)
Diesel
B5
B20
B50
B80
B100
Figure 2. BFSC Vs BHP.
Open Access JPEE
Diesel Engine Emissions and Performance Characteristics under Cape Chestnut Biofuel
Open Access JPEE
13
Table 1. Brake specific fuel consumption for test fuels.
BHP (Kw) Brake Specific Fuel Consumption (BSFC), Kg/Kw·h
Diesel B5 B20 B50 B80 B100
5.593 0.444 0.446 0.457 0.457 0.475 0.488
8.389 0.323 0.334 0.364 0.384 0.397 0.449
11.186 0.28 0.340 0.348 0.399 0.430 0.426
13.982 0.318 0.343 0.381 0.405 0.490 0.483
Table 2. Thermal efficiency of the test fuels.
BHP (Kw) Brake Thermal Efficiency, %
Diesel B5 B20 B50 B80 B100
5.593 18.258 18.143 18.069 18.798 18.093 18.948
8.389 24.852 24.222 22.644 22.412 21.669 20.603
11.186 28.706 23.771 23.693 21.573 20.001 21.715
13.982 25.256 23.607 21.684 20.319 18.500 19.13
R² = 0.978
R² = 0.999
R² = 0.996
R² = 0.965
R² = 0.967
R² = 0.882
0
2
4
6
8
10
12
14
16
18
20
579 11131517
SO2 (ppm)
B.H.P (kW )
Diesel
B5
B20
B50
B80
B100
Figure 4. The variation of SO2 with BHP for test fuels.
Figure 3. Thermal efficiency Vs BHP.
in the study were the SO2, NO2, and NO.
3.2.1. Analysis of SO2 Emissions from the Test Fuels
The exhaust gases from the test fuels were analysed and
the results of S02 concentration are as shown in Table 3.
As brake power increased, the SO2 emissions in the fuels
increased reaching a peak at about 11 Kw as shown on
Figure 4. The SO2 at 11 Kw for B100 wa s 2.16 1 ppm and
19.917 ppm for No. 2 diesel an reduction of 17.756 ppm
which is 89% reduction in emissions.
3.2.2. Anal ysi s of NO Emissions fr om the T e st Fuels
As shown i n th e grap hs i n Figure 5, as brake horse power
was increased, NO emissions concentrations showed a
linear increa ment. B100 was found to have the highest NO
emissions of 2.042 ppm as compared to diesel with 1.874
ppm at BHP of 13.98 Kw.
Figure 5. The variation of NO with BHP for test fuels.
with the increase of BHP up to around BHP of 11 Kw and
were found to rise as BHP increased. The NO2 emissions
detected in diesel at BP of about 11 Kw was 0.442 ppm
while B1 00 was 0.5 29 ppm a devi ation of 0 .087 ppm from
hat of diesel and an increase of 19.7%.
3.2.3. NO2 Emissions from the Test Fuels t
NO2 emissions for all the test fuels were found to decrease
Diesel Engine Emissions and Performance Characteristics under Cape Chestnut Biofuel
14
Table 3. SO2 emissions for test fuels.
BHP (Kw) SO2 (ppm)
Diesel B5 B20 B50 B80 B100
5.593 3.524 3.033 2.963 2.2672.467 0.000
8.389 15.789 13.167 11.173 10.8923.533 1.233
11.186 19.917 15.300 12.400 9.2293.050 2.161
13.982 7.258 10.447 8.458 3.4181.967 0.000
3.2.4. Concent ration of Particulate Matter (PM) in
the Test Fuels
Particulate matter detected while carrying out the tests
were of two types, fine and course particles. diesel fuel
had 78% of the total percentage of fine particles detected
while biodiesel blends combined had 22%.
4. Conclusions
The study analysis concluded that:
The use of biodiesel leads to reduced engine power as
observed in the high BSFC as the volumetric per-
centage of biodiesel increased in the blends. The use of
biodiesel in small amounts in the blends with diesel
resulted in insignificant power loss.
The main reason for power loss is attribut ed to reduce d
heating value of the biodiesel as compared to diesel
fuel because of its high density therefore m ore volum e
of biodiesel is needed to produce equivalent power
output as compared to diesel.
Where modification to an engine is done the injection
feature of biodiesel is influential to engine power con-
sidering biodiesel has a higher density and viscosity.
5. Acknowledgements
My sincere thanks to the Departments of Environmental
and Biosystems Engineering and Mechanical and Manu-
facturing Engineering of the University of Nairobi for
providing support in the course of the research of this
work.
REFERENCES
[1] A. W. Wagutu, S. C. Chhabra, C. L. Thoruwa, T. F. Tho-
ruwa and R. L. A. Mahunnah, “Indigenous Crops as a
Source for Production of Biodiesel in Kenya. Bull,”
Chemical Society of Ethiopia, Vol. 23, No. 3, 2009, pp.
359-370.
[2] E. Sulle and F. Nelson, “Biofuels Land Access and Rural
Livelihoods in Tanzania,” IIED, London, 2009.
[3] A. Monyem and J. H. V. Gerpen, “The Effect of Biodie-
sel oxidation on Engine Performance and Emissions,”
Biomass and Bioenergy, Vol. 20, No. 2001, 1999, pp.
317-325.
[4] A. K. Agarwal, “Bio-Fuels (Alcohols and Biodiesel) Ap-
plications as Fuels forInternal Combustion Engines,” Pro-
gress in Energy and Combustion Science, Vol. 33, No. 3,
2006, pp. 233-271.
http://dx.doi.org/10.1016/j.pecs.2006.08.003
[5] Kenya National Bureau of Statistics, “Leading Economic
Indicators,” 2010.
[6] Kenya Bureau of Statistics, “Economic Survey High-
lights,” 2012.
[7] D. Mitchel, “Bio-fuels in Africa: Opportunities, Prospects
and Challenges,” The International Bank for Reconstruc-
tion and Development, The World Bank, 2011.
[8] Y. Liu, T. Lin, Y. Wang and W. Ho, “Carbonyl Com-
pounds and Toxicity Assessments of Emissions from a
Diesel Engine Running on Biodiesels,” Journal of the Air
and Waste Management Association, Vol. 59, No. 2, 2009,
pp. 163-171.
http://dx.doi.org/10.3155/1047-3289.59.2.163
[9] Government of Kenya, Ministry of Energy, “Sessional
Paper No. 4 on Energy,” Government Press, 2004.
[10] Government of Kenya, Ministry of Energy, “The Energy
Act No. 12 of 2006,” Government of Press, 2006.
[11] D. L. Clements, “Blending Rules for Formulating Bio-
diesel Fuel,” National Biodiesel Board, 1996.
Open Access JPEE