 Journal of Software Engineering and Applications, 2013, 6, 610-622 Published Online November 2013 (http://www.scirp.org/journal/jsea) http://dx.doi.org/10.4236/jsea.2013.611073 Open Access JSEA Icons: Visual Representation to Enrich Requirements Engineering Work Sukanya Khanom, Anneli Heimbürger, Tommi Kärkkäinen Department of Mathematical Information Technology, University of Jyväskylä, Jyväskylä, Finland. Email: sukanya.s.khanom@student.jyu.fi, anneli.a.heimburger@jyu.fi, tommi.karkkainen@jyu.fi Received October 16th, 2013; revised November 10th, 2013; accepted November 17th, 2013 Copyright © 2013 Sukanya Khanom et al. This is an open access article distributed under the Creative Commons Attribution License, which permits unrestricted use, distribution, and reproduction in any medium, provided the original work is properly cited. ABSTRACT Adapting icons in requirements engineering can support the multifaceted needs of stakeholders. Conventional ap- proaches to RE are mainly highlighted in diagrams. This paper introduces icon-based information as a way to represent ideas and concepts in the requirements engineering domain. We report on icon artifacts that support requirements engi- neering work such as priority types, status states and stakeholder kinds. We evaluate how users interpret meanings of icons and the efficacy of icon prototypes shaped to represent those requirements attributes. Our hypothesis is whether practitioners can recognize the icons’ meaning in terms of their functional representation. According to the empirical data from 45 participants, the findings demonstrate the probability of providing users with icons and their intended functions that correspond to RE artifacts in a novel yet effective manner. Based on these findings, we suggest that icons could enrich stakeholders’ perception of the RE process as a whole; however, meaningful interpretation of an icon is subject to the user’s prior knowledge and experience. Keywords: Requirements Engineering; Icon; Culture; Stakeholder; Visual Language 1. Introduction The growth in sophistication of human-computer interac- tion (HCI) can be seen in graphical user interfaces (GUIs) [1,2]. These interfaces have significantly reduced the amount of typing needed when using a computer. Nowa- days, icons are important visible representations of in- formation. They range from device control and icons in public to iconic communication systems assisting some particular areas [3-7]. The use of icons to reflect objects or actions is not new in modern computer-aided systems or software packages. The icons era in interface and screen design began with the Xerox Star computer in the 1970s and thoroughly bloomed with the onset of Apple Macintosh in the mid-1980s. GUI rapidly turned into the paramount user interface when Microsoft adopted varia- tion of icons with its Windows system [1,2,8]. Because of the increasing presence of icons within computer-intensive communication, it is necessary to consider how icons are interpreted and the factors that influence their effectiveness. In addition, because icons are frequently used to supplement texts and overcome language barriers, this makes the ability to recognize and comprehend icons even more complex. In particular, in requirements engineering (RE) the adaptation of appro- priate icons can be difficult. The RE process typically involves collaborations of people with different back- grounds, roles and responsibilities, so different that they appear to speak different languages and apply different approaches for the desired outcomes [9-11]. Recently, dozens of requirements methodologies and techniques have been implemented and made available for practi- tioners. However, the empirical evidence repeatedly re- veals that RE is considered as one of the key contributors to the failure of software [12,13]. This position creates a challenge for researchers to find an uncomplicated and easy-to-learn method that can enhance requirements ac- tivities, reduce ambiguity and promote collaboration. Even though icons have been accepted successfully in HCI, information on the utilization of icons in RE is scarce (e.g. [14]). Our attempt is to refine icon-based information to sup- port the tasks of RE stakeholders and to clarify how readers recognize connotative meanings of icons, that is, what the icon is intended to represent. There may be nu- merous approaches to solve the problems encountered in  Icons: Visual Representation to Enrich Requirements Engineering Work 611 RE. This paper introduces one such approach with the help of the following key concepts: cultural aspects, RE artifacts and icon-based information. The cultural aspects assist in building a cultural user framework with cultur- ally adaptive user interfaces that adapt themselves to the user’s background. RE artifacts provide a skeleton for the scenarios of requirements activities that can be charac- terized by icons, such as attributes, stakeholders and rela- tionships. Attributes are the properties that distinguish one requirement from another, and they establish a con- text and background for each requirement. Stakeholders are the persons or systems that have the purpose of achieving goals and that take action to achieve them. Relationships signify the correlation between two or more requirements. All RE artifacts are patterned as static elements. This type of patterning means that all users visualize requirements features or functions in the same manner. Icon-based information is designed in visually supporting pieces of RE artifacts that go beyond an ordinary textual description. Unlike RE artifacts that are stationary, icon-based information is dynamic de- pending on the users’ cultural background. The deviation of icon presentations specific to cultural preferences can be seen for example, in how the attached icon for high priority is illuminated. Users from Europe might experi- ence the interface with purple-colored icons, but users in Asia may contemplate the interface with yellow-colored icons [15]. To the best of our knowledge, icon-based information is the first approach that tries to represent icons in RE and that is able to adapt its interface to the preferences according to the user’s cultural background. Our research question explores how well practitioners can predict the meaning of icon representations. To answer this question, this paper evaluates icons that represent priority types, status states, stakeholder kinds and relationships. In our study, icon-based information was tested with 45 par- ticipants from Finland. Our findings have the potential to inform the development of unambiguous requirements and avoid the aforementioned problems. Consequently, our contributions are as follows: First, we present a theoretically grounded approach for icon-based informa- tion in RE and adapting its interface by cultural back- ground. We propose a cultural user framework to ap- proximate a person’s cultural preference and intertwine RE artifacts with their prospective iconic representations. Second, we empirically evaluate those icons’ meaning and demonstrate whether icons are able to characterize RE artifacts. We expect that the role of iconic informa- tion used in RE could facilitate the work of business us- ers and software developers in all phases, from elicitation and negotiation to validation. In the following section, we introduce the previous work on which we have based our method for designing a concept of icon-based information. In Section 3, we describe our research approach. We develop three ar- tifacts that demonstrate the approach and in Section 4, we describe its stepwise nature. In Section 5, we describe an empirical evaluation of icon-based information. Next, we discuss our results and recommendations for improve- ment. Last, we propose future work and present our con- clusions. 2. Related Work We review the relevant work on three questions: What prominent methods are regularly employed in RE? What icon applications already exist? How can we understand how cultural aspects affect icon perception? 2.1. The Nature of Iconic Communication in RE and Other Environments The de facto standard of visualization techniques that have broadly converged in RE are diagram and graphical, such as Unified Modeling Language (UML) and goal- oriented models. UML is one of the conceptual modeling tools in software engineering to represent static and dy- namic phenomena of user requirements [16,17]. The goal-oriented model is a paradigm for eliciting, evaluat- ing, elaborating, documenting and analyzing software requirements [18,19]. Nevertheless, the empirical evi- dence (e.g. [14,17,20]) has revealed some shortcomings of these techniques, such as the problematic use of ab- stract shapes that have articulately conventional mean- ings which must be learnt. Iconic visualization is one modality recommended to be employed in enhancing cognitive effectiveness for RE notation [14]. However, the applicable icons in RE can be considered because they are pervasively used in toolbars and menu bars, but not in the requirements engineering context itself. Over the decades, icons have been at the center of hu- man-computer interaction (HCI). While concrete icons are believed to be effective in graphical user interfaces, abstract icons are judged to be less effective because they do not represent real-world objects [21]. Interface de- signers repeatedly use concrete icons because of the strength of their relation between icon and function. Notwithstanding, abstract icons can also be utilized in the interface as they strengthen icon-referent relations by producing a less pictorial representation that is meaning- ful to the user [21,22]. Within the domain of HCI, the methods of cognitive psychology are commonly fol- lowed (e.g. [14,23,24]). The cognitive factors of icons embody the cognition of visual information and the asso- ciation of connection. The effects on user cognition are based on a range of characteristics such as color, shape and size [25]. By improving the usability of icons, the hope is to improve the interactive interface between peo- Open Access JSEA 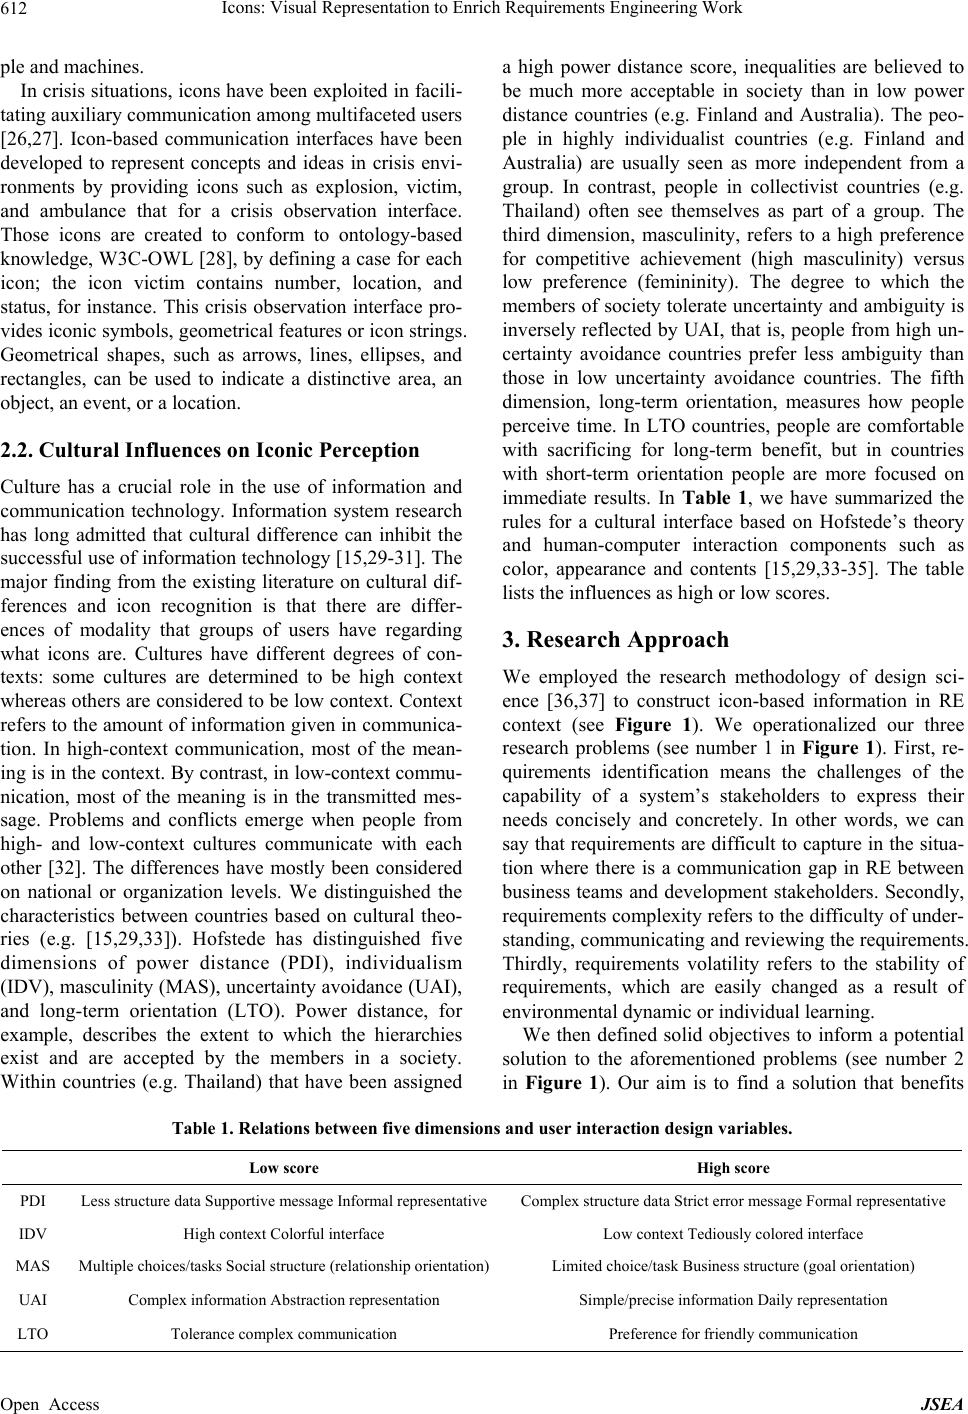 Icons: Visual Representation to Enrich Requirements Engineering Work Open Access JSEA 612 ple and machines. In crisis situations, icons have been exploited in facili- tating auxiliary communication among multifaceted users [26,27]. Icon-based communication interfaces have been developed to represent concepts and ideas in crisis envi- ronments by providing icons such as explosion, victim, and ambulance that for a crisis observation interface. Those icons are created to conform to ontology-based knowledge, W3C-OWL [28], by defining a case for each icon; the icon victim contains number, location, and status, for instance. This crisis observation interface pro- vides iconic symbols, geometrical features or icon strings. Geometrical shapes, such as arrows, lines, ellipses, and rectangles, can be used to indicate a distinctive area, an object, an event, or a location. 2.2. Cultural Influences on Iconic Perception Culture has a crucial role in the use of information and communication technology. Information system research has long admitted that cultural difference can inhibit the successful use of information technology [15,29-31]. The major finding from the existing literature on cultural dif- ferences and icon recognition is that there are differ- ences of modality that groups of users have regarding what icons are. Cultures have different degrees of con- texts: some cultures are determined to be high context whereas others are considered to be low context. Context refers to the amount of information given in communica- tion. In high-context communication, most of the mean- ing is in the context. By contrast, in low-context commu- nication, most of the meaning is in the transmitted mes- sage. Problems and conflicts emerge when people from high- and low-context cultures communicate with each other [32]. The differences have mostly been considered on national or organization levels. We distinguished the characteristics between countries based on cultural theo- ries (e.g. [15,29,33]). Hofstede has distinguished five dimensions of power distance (PDI), individualism (IDV), masculinity (MAS), uncertainty avoidance (UAI), and long-term orientation (LTO). Power distance, for example, describes the extent to which the hierarchies exist and are accepted by the members in a society. Within countries (e.g. Thailand) that have been assigned a high power distance score, inequalities are believed to be much more acceptable in society than in low power distance countries (e.g. Finland and Australia). The peo- ple in highly individualist countries (e.g. Finland and Australia) are usually seen as more independent from a group. In contrast, people in collectivist countries (e.g. Thailand) often see themselves as part of a group. The third dimension, masculinity, refers to a high preference for competitive achievement (high masculinity) versus low preference (femininity). The degree to which the members of society tolerate uncertainty and ambiguity is inversely reflected by UAI, that is, people from high un- certainty avoidance countries prefer less ambiguity than those in low uncertainty avoidance countries. The fifth dimension, long-term orientation, measures how people perceive time. In LTO countries, people are comfortable with sacrificing for long-term benefit, but in countries with short-term orientation people are more focused on immediate results. In Table 1, we have summarized the rules for a cultural interface based on Hofstede’s theory and human-computer interaction components such as color, appearance and contents [15,29,33-35]. The table lists the influences as high or low scores. 3. Research Approach We employed the research methodology of design sci- ence [36,37] to construct icon-based information in RE context (see Figure 1). We operationalized our three research problems (see number 1 in Figure 1). First, re- quirements identification means the challenges of the capability of a system’s stakeholders to express their needs concisely and concretely. In other words, we can say that requirements are difficult to capture in the situa- tion where there is a communication gap in RE between business teams and development stakeholders. Secondly, requirements complexity refers to the difficulty of under- standing, communicating and reviewing the requirements. Thirdly, requirements volatility refers to the stability of requirements, which are easily changed as a result of environmental dynamic or individual learning. We then defined solid objectives to inform a potential solution to the aforementioned problems (see number 2 in Figure 1). Our aim is to find a solution that benefits Table 1. Relations between five dimensions and use r interaction design variables. Low score High score PDI Less structure data Supportive message Informal representative Complex structure data Strict error message Formal representative IDV High context Colorful interface Low context Tediously colored interface MAS Multiple choices/tasks Social structure (relationship orientation)Limited choice/task Business structure (goal orientation) UAI Complex information Abstraction representation Simple/precise information Daily representation LTO Tolerance complex communication Preference for friendly communication  Icons: Visual Representation to Enrich Requirements Engineering Work 613 Figure 1. Design science research methodology. RE stakeholders, particularly in multicultural environ- ments. Large diversity in the cultural backgrounds of stakeholders makes it indispensable to find ways easily adapting interaction. For this adaption process, icon- based information has three benefits. The first benefit is to enable business users to specify and communicate requirements. The second benefit is to support system analysts or requirements engineers to prioritize and resolve conflicts. The third benefit is to enable RE stakeholders to investigate changes in re- quirements and to continue tracking the requirements life cycle. At the design stage (see number 3 in Figure 1), the key insights of our approach can be obtained by defining cultural user aspects, elaborating RE artifacts and refin- ing icon artifacts. The details of these three artifacts are described in the next section. We inferred the necessities for our artifacts by drawing on theoretical foundations in the interdisciplinary fields of RE, human-computer in- teraction, and cognitive psychology. We further com- bined knowledge and techniques from the research fields of modeling languages and iconic communication in or- der to make design decisions that principally affect the direction of our approach. In the evaluation phase (see number 4 in Figure 1), we conducted two iterative evaluations: one with student users and another with expert users. The first iteration was tested by students in the RE course of the Depart- ment of Mathematical Information Technology at the University of Jyväskylä. The results of students from the first iteration are detailed in Section 5. For the latter it- eration, software companies in Thailand and Finland (including Australia, if possible) will be the notable key players. We took advantage of usability testing to evalu- ate if a defined icon-based language supports the tasks of RE stakeholders. The results of these two iterations will be used to inform improvement possibilities. 4. Designing for Icon-Based Information in the RE Domain 4.1. Modeling Requirements Engineering We established a list of RE artifacts to support multicul- tural environments. It is focused on delineating potential activities that affect the entire RE process and that help diminish ambiguity and misinterpretation. Figure 2 shows an example of how the central concept of re- quirements artifacts is in relation to stakeholders, attrib- utes, relationships and taxonomies. Each requirement is proposed by a stakeholder and thus it is essential to re- cord information about associated stakeholders. We categorized the requirements into groupings (a taxonomy) to facilitate better organization and management. The eight types were created in order to tackle software qual- ity and development process quality [38]. Business re- quirement is an abstraction level that reflects a goal or vision of the organization. Business requirements may contain functional requirements that present the behavior of a system under specific conditions. Otherwise, the level also includes non-functional requirements that rep- resent a quality attribute the system must have, such as reliability, usability, efficiency, maintainability, or port- ability. A requirement may be appended with business rules, laws, policies, or procedures which constrain the degree of freedom in delivering a solution. The importance and urgency (priority) assigned to every individual requirement helps moderate imprecise conflicting requirements and assist the development team in identifying the core requirements. A requested re- quirement must be assigned one out of five priority levels. A “very high” priority is both important and urgent, a “high” priority is important but not urgent, a “fair” prior- ity is neither important nor urgent, a “low” priority is neither important nor urgent and can wait for the next release, and a “very low” priority is for when the re- quirement can be delayed for the next release or not im- plemented. A preference score is attached to the initialized re- quirement. It stands for the degree of preference or satis- faction of the requirement for each stakeholder. The score, arranged by each stakeholder, can be used to in- spect the similarity of detected overlap among stake- holders. The classification of several statuses is more mean- ingful to help stakeholders monitor the progress of each single requirement throughout development process: Open Access JSEA  Icons: Visual Representation to Enrich Requirements Engineering Work 614 Figure 2. Model of requirements management with relevant attributes. “Propose” when the requirement has been initialed by an authorized source; “Accept” when the requirement is analyzed and key stakeholders agree to incorporate such requirement; “Reject” if the requirement is proposed but it is not planned for implementation; “Implement” when designing, writing and testing the source code that im- plements the requirement, and “Verify” when verifying for the correct functionality of implemented requirement. The existence of a relationship between two or more requirements presents and reasons taxonomy of trace- ability. The requirements can be associated to each other through the link types: dependency or parent-child. Three relationships of dependency (require, refine, and conflict) have been delineated to qualify the association between two or more requirements. Additionally, one requirement can be divided into sub-requirements and those sub-re- quirements are connected to their parent with a parent- child link. The requirements engineer can use two types corresponding to a logical combination—one is AND- parent-child and the other is OR-parent-child. With an AND relationship, unless all sub-requirements are satis- fied, their parent requirement cannot be satisfied. On the contrary, with an OR relationship, a parent requirement could be satisfied when at least one sub-requirement is satisfied. 4.2. Modeling Icon-Based Information Although many visual features (e.g. size, shape and color) have been allocated to aid the recognition, it is now ac- knowledged that the correlation between recognition and interpretation also plays a crucial role [39,40]. Interpret- ing and comprehending a single icon is the simplest process of reading iconographic communication, but when icon interpretation occurs in isolation, it makes icon interpretation too complex [39]. Currently, the out- standing icon characteristic that has received the most attention is icon concreteness. In this characteristic, icons are used to represent real-world objects because they happen to convey meaning accurately [23,39]. Abstract icons, in contrast, represent information using visual features such as shapes, arrows, and colors. We propose that the RE context cannot be wholly represented with concrete icons. As a consequence, we decided to com- bine concrete and abstract icons to represent RE artifacts. This combination is a plausible reason for making icon- based language scalable, so that a single icon may share the same semantic system. In Figure 3, we depict an icon-based ontology. First we need to derive the icon library of a visual notation being designed to attach to the requirement itself, re- quirements process and user interface. The main element is the class Icon-based Information which defines icon characteristics. To benefit scalability and variability, we build libraries for Icon-based Information into two cate- gories: separated and shared icon libraries. A MainLib acts as a centric base and will store all icons that can be shared among other three Libraries. UILib mainly col- lects icons that will be utilized for user interface whereas ProcessLib serves icons that associate to the process output. Likewise, AttributeLib provides icons related to attributes that can be adhere to every requirement. Icons in these four libraries must be design in accordance with cultural aspects of Hoftede’s dimensions. Other four subclasses are: Position which characterizes the icon orientation in X and Y axis, Size which exemplifies icon size including 1D iconic elements (lines), 2D iconic ele- Open Access JSEA 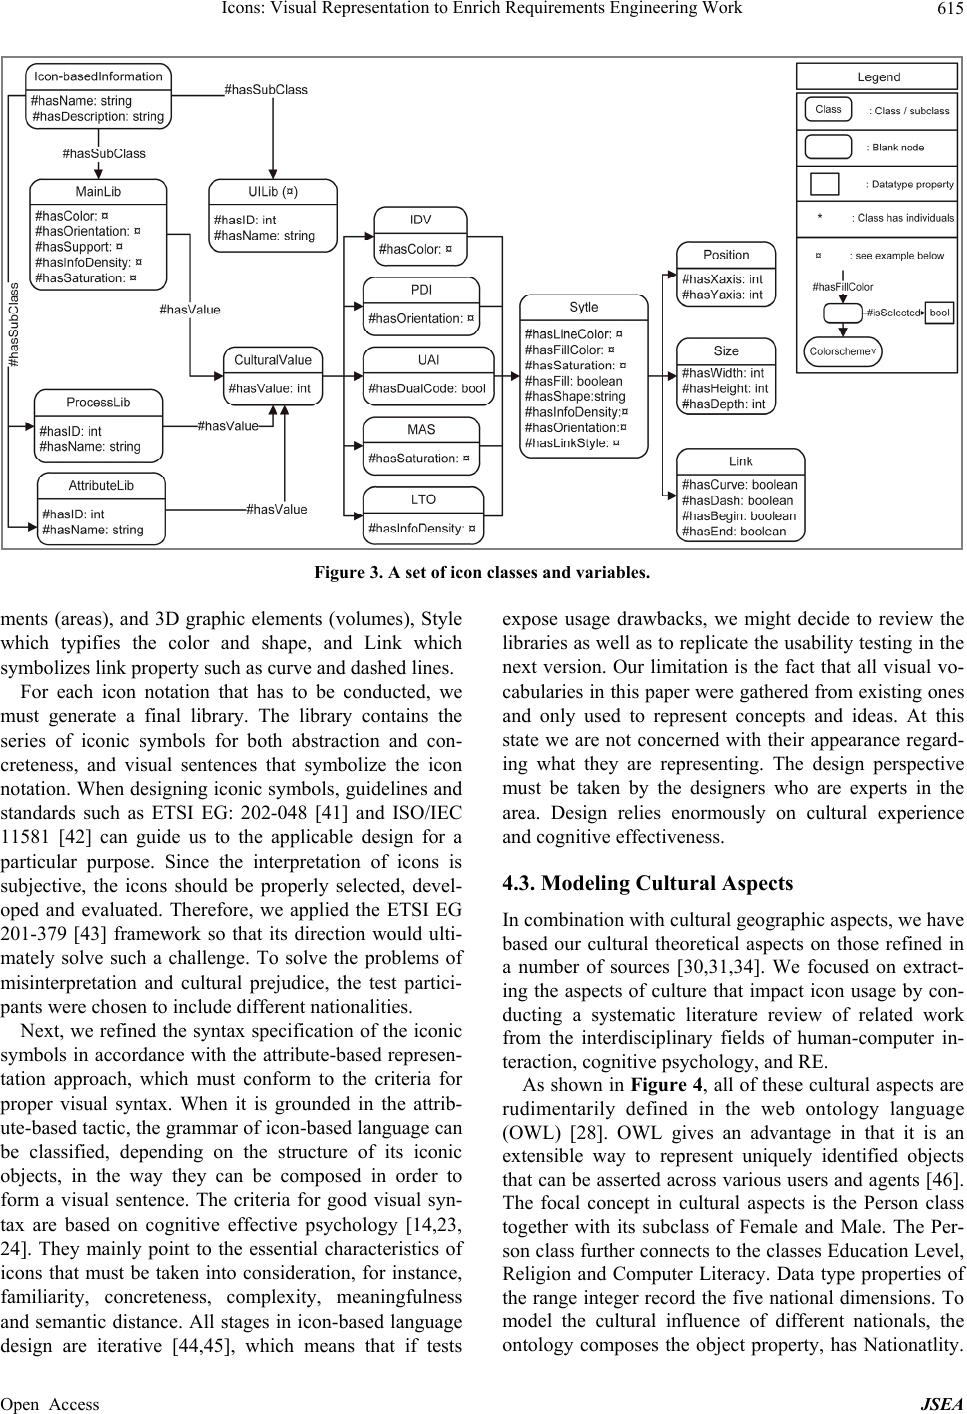 Icons: Visual Representation to Enrich Requirements Engineering Work 615 Figure 3. A set of icon classes and variables. ments (areas), and 3D graphic elements (volumes), Style which typifies the color and shape, and Link which symbolizes link property such as curve and dashed lines. For each icon notation that has to be conducted, we must generate a final library. The library contains the series of iconic symbols for both abstraction and con- creteness, and visual sentences that symbolize the icon notation. When designing iconic symbols, guidelines and standards such as ETSI EG: 202-048 [41] and ISO/IEC 11581 [42] can guide us to the applicable design for a particular purpose. Since the interpretation of icons is subjective, the icons should be properly selected, devel- oped and evaluated. Therefore, we applied the ETSI EG 201-379 [43] framework so that its direction would ulti- mately solve such a challenge. To solve the problems of misinterpretation and cultural prejudice, the test partici- pants were chosen to include different nationalities. Next, we refined the syntax specification of the iconic symbols in accordance with the attribute-based represen- tation approach, which must conform to the criteria for proper visual syntax. When it is grounded in the attrib- ute-based tactic, the grammar of icon-based language can be classified, depending on the structure of its iconic objects, in the way they can be composed in order to form a visual sentence. The criteria for good visual syn- tax are based on cognitive effective psychology [14,23, 24]. They mainly point to the essential characteristics of icons that must be taken into consideration, for instance, familiarity, concreteness, complexity, meaningfulness and semantic distance. All stages in icon-based language design are iterative [44,45], which means that if tests expose usage drawbacks, we might decide to review the libraries as well as to replicate the usability testing in the next version. Our limitation is the fact that all visual vo- cabularies in this paper were gathered from existing ones and only used to represent concepts and ideas. At this state we are not concerned with their appearance regard- ing what they are representing. The design perspective must be taken by the designers who are experts in the area. Design relies enormously on cultural experience and cognitive effectiveness. 4.3. Modeling Cultural Aspects In combination with cultural geographic aspects, we have based our cultural theoretical aspects on those refined in a number of sources [30,31,34]. We focused on extract- ing the aspects of culture that impact icon usage by con- ducting a systematic literature review of related work from the interdisciplinary fields of human-computer in- teraction, cognitive psychology, and RE. As shown in Figure 4, all of these cultural aspects are rudimentarily defined in the web ontology language (OWL) [28]. OWL gives an advantage in that it is an extensible way to represent uniquely identified objects that can be asserted across various users and agents [46]. The focal concept in cultural aspects is the Person class together with its subclass of Female and Male. The Per- son class further connects to the classes Education Level, Religion and Computer Literacy. Data type properties of the range integer record the five national dimensions. To model the cultural influence of different nationals, the ntology composes the object property, has Nationatlity. o Open Access JSEA 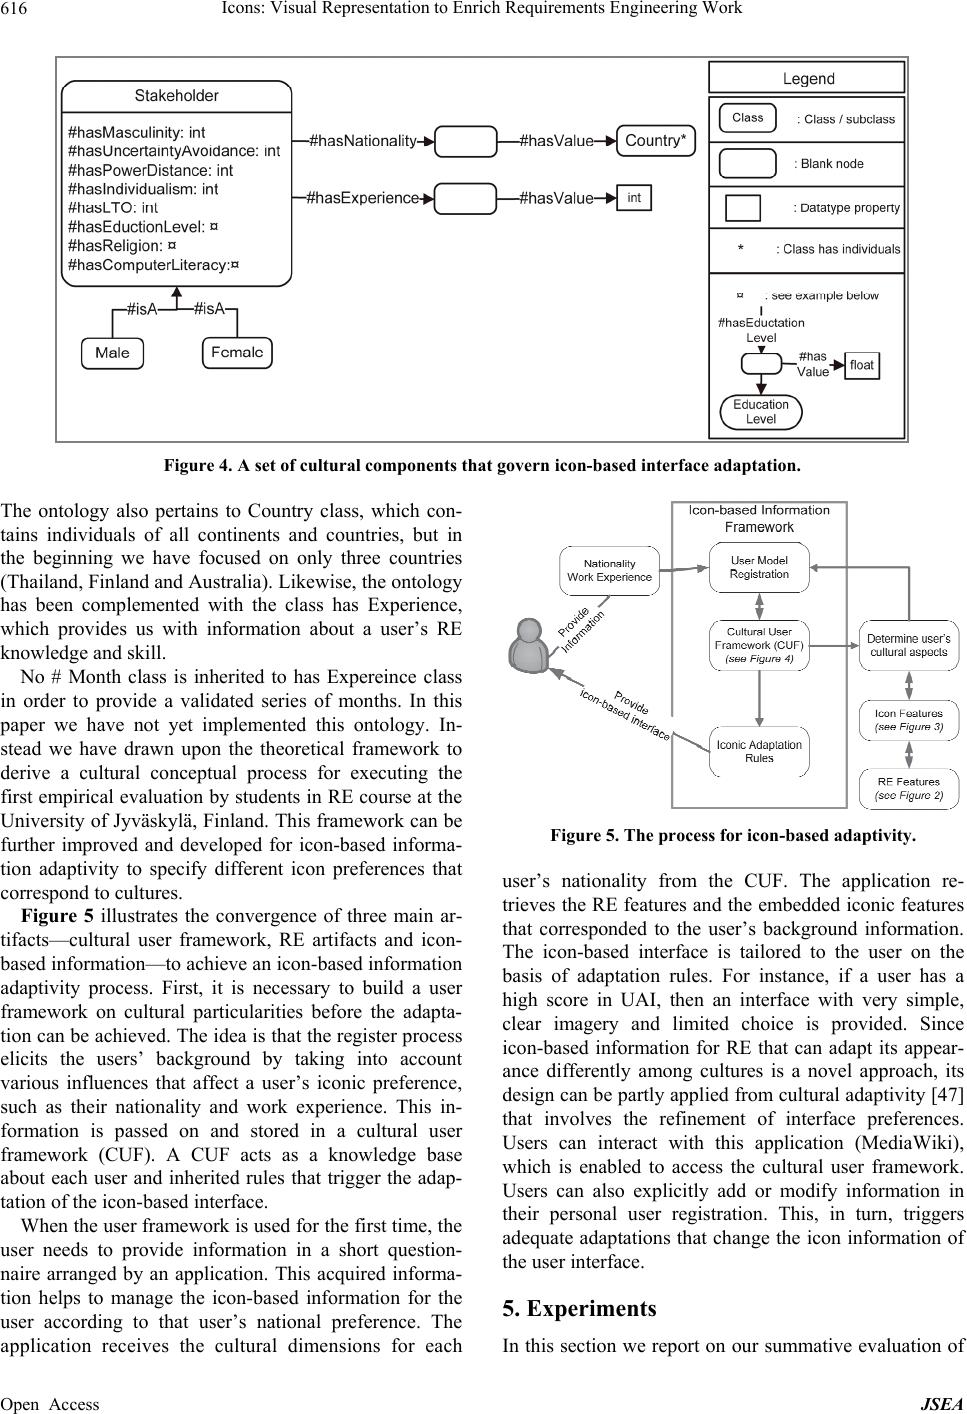 Icons: Visual Representation to Enrich Requirements Engineering Work 616 Figure 4. A set of cultural components that govern icon-based interface adaptation. The ontology also pertains to Country class, which con- tains individuals of all continents and countries, but in the beginning we have focused on only three countries (Thailand, Finland and Australia). Likewise, the ontology has been complemented with the class has Experience, which provides us with information about a user’s RE knowledge and skill. No # Month class is inherited to has Expereince class in order to provide a validated series of months. In this paper we have not yet implemented this ontology. In- stead we have drawn upon the theoretical framework to derive a cultural conceptual process for executing the first empirical evaluation by students in RE course at the University of Jyväskylä, Finland. This framework can be further improved and developed for icon-based informa- tion adaptivity to specify different icon preferences that correspond to cultures. Figure 5 illustrates the convergence of three main ar- tifacts—cultural user framework, RE artifacts and icon- based information—to achieve an icon-based information adaptivity process. First, it is necessary to build a user framework on cultural particularities before the adapta- tion can be achieved. The idea is that the register process elicits the users’ background by taking into account various influences that affect a user’s iconic preference, such as their nationality and work experience. This in- formation is passed on and stored in a cultural user framework (CUF). A CUF acts as a knowledge base about each user and inherited rules that trigger the adap- tation of the icon-based interface. When the user framework is used for the first time, the user needs to provide information in a short question- naire arranged by an application. This acquired informa- tion helps to manage the icon-based information for the user according to that user’s national preference. The application receives the cultural dimensions for each Figure 5. The process for icon-based adaptivity. user’s nationality from the CUF. The application re- trieves the RE features and the embedded iconic features that corresponded to the user’s background information. The icon-based interface is tailored to the user on the basis of adaptation rules. For instance, if a user has a high score in UAI, then an interface with very simple, clear imagery and limited choice is provided. Since icon-based information for RE that can adapt its appear- ance differently among cultures is a novel approach, its design can be partly applied from cultural adaptivity [47] that involves the refinement of interface preferences. Users can interact with this application (MediaWiki), which is enabled to access the cultural user framework. Users can also explicitly add or modify information in their personal user registration. This, in turn, triggers adequate adaptations that change the icon information of the user interface. 5. Experiments In this section we report on our summative evaluation of Open Access JSEA  Icons: Visual Representation to Enrich Requirements Engineering Work 617 the ability of icon-based information for RE to ade- quately adapt to varying requirements scenarios. The evaluation was carried out to ensure that icons are effec- tive and usable. Icon usability testing was conducted to assess the degree to which the graphic chosen for the icon represented the intended concept, so-called icon intuitiveness [39]. The study focuses on participants with a Finnish cultural background. 5.1. Participants To evaluate the cognition of icon-based information for requirements engineering by diverse participants, we invited students attending a Requirements Engineering course at the University of Jyväskylä to participate in the study. Some of them were studying the subject for first time and some already had experience in software engi- neering. A total of 45 students took part in this study: 14 novices, (0 years of experience) and 31 experts (an aver- age of 1.2 years of experience). Each student completed three testing dimensions: individual icon interpretation, multiple icon interpretation and compound icon con- struction. 5.2. Test Apparatus A web-based survey, a common instrument for gathering information from participants, was set up for the empiri- cal evaluation. The icons were presented to participants on webpages. The website consisted of three primary sections: background information, a form for personal information and the icon test. Each test contained an ex- planation that helped users to complete the task. 5.3. Procedure Prior to the real execution of tasks, we briefly explained to participants the purpose of the testing, the amount of tasks they needed to complete and the step-by-step inter- action. In addition, iconic symbols were chosen from a variety of sources in order to ensure that they were rep- resentative of the icons that are currently well-known in the broad spectrum of RE artifacts. These included the use of norms from standards such as ISO/IEC-11581 [42]. All the selected icons were abstract ones with predictable meanings. However, we selected the icons that could be simply interpreted and recognized without requiring prior knowledge. For this study, our selection consisted of 14 icons, including 5 icons for priority, 5 icons for status, and 4 icons for stakeholder type. Throughout the experi- ment, participants were encouraged to interpret the icons from the details they were given. The empirical survey ended with a small questionnaire that gathered feedback and comments on icon-based information in RE. Partici- pants completed three series of tasks. For examples, see Figure 6. 5.4. Preliminary Result 5.4.1. Individual Icon Interpretation The requirements life cycle diagram, which consists of five blanks (see Figure 6(a)), was delivered to all replies, in conjunction with icons that resemble all five stages of the requirements life cycle: Propose, Accept, Reject, Im- plement and Verify. The participant selected the most correlated icon and dropped it into every single blank stage. The number of accurate selections per stage varied from 52% to 94%. 5.4.2. Multiple Icon Interpretation We categorized the iconic symbols into three require- ments attributes: five status states, five priority types and four stakeholder kinds. Each respondent mapped icons to their corresponding meaning from two lists (see Figure 6(b)): one list of icons and another list of meanings. Ta- ble 2 presents the outcomes for interpreting the icons and their meaning for three distinct categories. 5.4.3. Compound Icon Construction The icons were also used to represent requirements type symbols and relationships imitating the concept of a goal-oriented model (see Figure 6(c)). We offered four types (business requirement, functional requirement, non-functional requirements, and constraint), four rela- tionship symbols (Refine, Require, AND and OR), and five priority symbols (Very high, High, Fair, Low and Very low). Each respondent constructed the iconic sen- tence according to the statement. The correctness of iconic constructs achieved a prediction accuracy of ap- proximately 84%. 5.5. Role of Experience The expected outcome of this study was that practitioners would be able to recognize the iconic symbols represent- ing RE artifacts, such as stakeholders, attributes and rela- tionships. From the results, we observed that icons were interpreted very well. The average correct prediction accuracy was more than 50 percent. This finding informs our direction to explore improvement possibilities of icon-based information. The individual icon testing re- vealed that the participants’ capability to answer the status states required prior knowledge and experience of the requirements life cycle and the interaction that takes place during the process, from the beginning of propos- ing to the end of verification. Training before taking part in this test would probably assist the respondents in un- derstanding the basic elements of RE. The multiple icons testing showed that a participant’s interpretation de- pended to some extent on their conventional knowledge. For example, participants who have children might per- ceive a baby carriage as high priority. There was also Open Access JSEA  Icons: Visual Representation to Enrich Requirements Engineering Work Open Access JSEA 618 Figure 6. The test task series, (a) type 1: individual icon mapping that exemplifies the requirements life cycle; (b) type 2: mul- tiple icon meaning that typifies requirements attributes; and (c) type 3: iconic sentence construction that characterizes re- quirements type s and relationships. confusion over whether a train or a car is faster. The re- sults for multiple icon testing also revealed that out of interpretations for 14 icons, roughly 7.5% generated misunderstanding. In the difficult recognition of goal- graph relationship, compound icon construction gener- ated positive feedback. Apparently, the use of dual-code symbols with label captions enabled easy apprehension, with the result being roughly 80% correct for the con- structions. We proposed the null hypothesis (H0) that the inter- pretations for icons of practitioners in the same country are similar and we also put forward the hypothesis (H1) that the interpretations of icons by practitioners in the same country can be different. These hypotheses were informed by statistical results from binomial confidence intervals. The binomial confidential interval is persuasive because only two outcomes are possible in each identical trial: success (correct) or failure (incorrect). As the out- puts in Table 3 show, we reject the null hypothesis and accept H1 because even though people in the same coun- try tested icons, some misinterpretations remained. We conclude, therefore, that iconic representations are de- pendent on context and personal perspective. The diffi- culties of interpretation might have arisen because the set of icons chosen were not obviously representative exam- ples of the intended functions. We tested another hypothesis that no differences exist in the interpretation of icons by novices and experienced participants among the three test series. In Table 4, we sed the Fisher Exact Probability Test to investigate the u  Icons: Visual Representation to Enrich Requirements Engineering Work 619 Table 2. Summary of the icon-tested results for N = 45 (in percent). Priority types Life Cycle (status) states Stakeholder kinds Icon & Meaning Correct prediction Icon & Meaning Correct prediction Icon & Meaning Correct prediction Very Low 66.66 Propose 82.22 Manager 84.44 Low 68.88 Verify 88.88 Business 77.77 Fair 73.33 Accept 95.55 Analyst 97.77 High 75.55 Implement 82.22 Other 91.11 Very High 77.77 Reject 66.66 Table 3. Three categories of icons test for finnish country with confidential level 95%. Type of Question Test Results Individual Icon Interpretation The 95% confidence interval for the proportion of potential practitioners who can place icons in the requirements life cycle stage well is 0.3650 to 0.6572. Multiple Icon Interpretation The 95% confidence interval for the proportion of potential practitioners who can interpret multi-icons well is 0.7242 to 0.9297. Compound Icon Construction The 95% confidence interval for the proportion of potential practitioners who can construct iconic sentence well is 0.7386 to 0.9503. Table 4. The differences in the distribution of interpretation between novices and spec ialists within Finnish culture. Finnish culture P value between two groups Individual Icon Interpretation 0.659 Multiple Icon Interpretation 0.720 Compound Icon Construction 0.749 distribution of two participant groups: novices and spe- cialists. This test resulted in a contingency table with α = 0.05. We can reject the above hypothesis only if the P value is less than the alpha value. With derived prob- abilities (P value) for all tests greater than α = 0.05, it would confirm the hypothesis. We conclude that work experience is not associated (at the α = 0.05 level) with how novices and specialists were able to comprehend the meaning of icons. 6. Discussions and Recommendations for Improvement We have mentioned the survey outcomes of three sample sizes that belong to other nationalities. Not only can we not use these small numbers as nationally representative, but also all of them are affiliated with the experienced group, so it is insufficient to analyze a two-sample test. Table 5 shows the proportional correctness by percent- age. Even though it was our intention to focus on par- ticipants with a multicultural background, the low num- ber (3) of other participants of other nationalities means those are not significant enough to be systematically ex- ploited for cultural summarization. We can only make clear conclusions regarding users with Finnish national- ity. This limitation motivates us to further evaluate these issues with a significant number of participants from other cultures. However, the satisfactory result for priority types has several implications for our approach. We cannot readily presume that our proposed icons generalize to any person in any country. This means that it is important to provide users with clear-cut groups of requirements priorities. Breaking down priority into three scales—high, medium, and low—could advance straightforward recognition and utilization [48]. First, high priority requirements are im- portant and urgent. We advise the use of an aircraft icon for high priority. Second, medium priority requirements are important but not urgent. We recommend a car icon for medium priority. Finally, low priority requirements are neither important nor urgent. We encourage the use Open Access JSEA 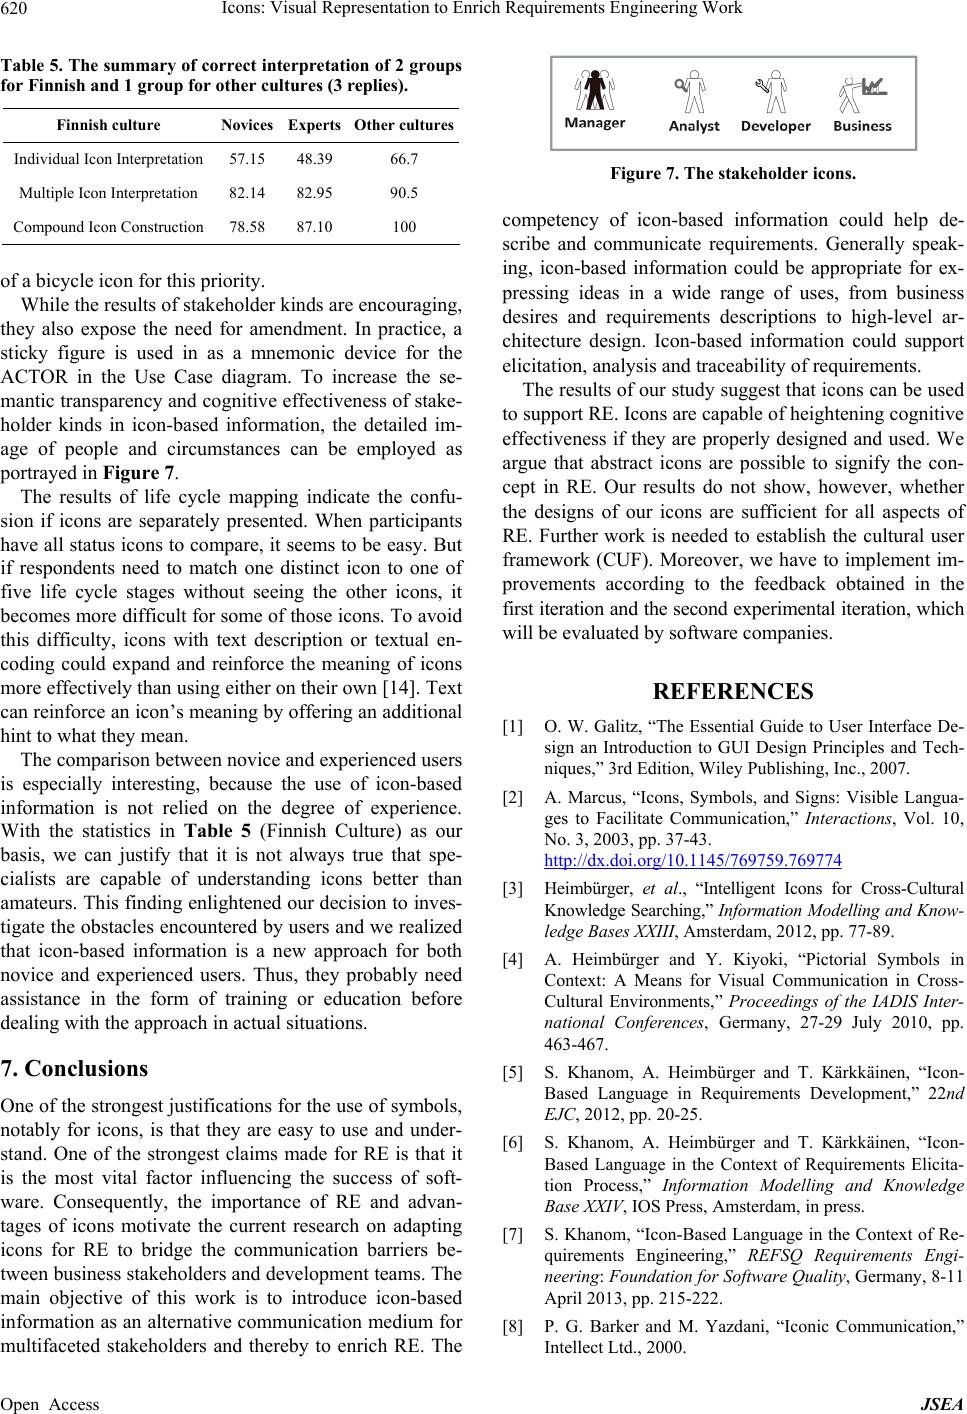 Icons: Visual Representation to Enrich Requirements Engineering Work 620 Table 5. The summary of correct inter pretation of 2 groups for Finnish and 1 group for other cultures (3 replies). Finnish culture Novices Experts Other cultures Individual Icon Interpretation 57.15 48.39 66.7 Multiple Icon Interpretation 82.14 82.95 90.5 Compound Icon Construction 78.58 87.10 100 of a bicycle icon for this priority. While the results of stakeholder kinds are encouraging, they also expose the need for amendment. In practice, a sticky figure is used in as a mnemonic device for the ACTOR in the Use Case diagram. To increase the se- mantic transparency and cognitive effectiveness of stake- holder kinds in icon-based information, the detailed im- age of people and circumstances can be employed as portrayed in Figure 7. The results of life cycle mapping indicate the confu- sion if icons are separately presented. When participants have all status icons to compare, it seems to be easy. But if respondents need to match one distinct icon to one of five life cycle stages without seeing the other icons, it becomes more difficult for some of those icons. To avoid this difficulty, icons with text description or textual en- coding could expand and reinforce the meaning of icons more effectively than using either on their own [14]. Text can reinforce an icon’s meaning by offering an additional hint to what they mean. The comparison between novice and experienced users is especially interesting, because the use of icon-based information is not relied on the degree of experience. With the statistics in Table 5 (Finnish Culture) as our basis, we can justify that it is not always true that spe- cialists are capable of understanding icons better than amateurs. This finding enlightened our decision to inves- tigate the obstacles encountered by users and we realized that icon-based information is a new approach for both novice and experienced users. Thus, they probably need assistance in the form of training or education before dealing with the approach in actual situations. 7. Conclusions One of the strongest justifications for the use of symbols, notably for icons, is that they are easy to use and under- stand. One of the strongest claims made for RE is that it is the most vital factor influencing the success of soft- ware. Consequently, the importance of RE and advan- tages of icons motivate the current research on adapting icons for RE to bridge the communication barriers be- tween business stakeholders and development teams. The main objective of this work is to introduce icon-based information as an alternative communication medium for multifaceted stakeholders and thereby to enrich RE. The Figure 7. The stakeholder icons. competency of icon-based information could help de- scribe and communicate requirements. Generally speak- ing, icon-based information could be appropriate for ex- pressing ideas in a wide range of uses, from business desires and requirements descriptions to high-level ar- chitecture design. Icon-based information could support elicitation, analysis and traceability of requirements. The results of our study suggest that icons can be used to support RE. Icons are capable of heightening cognitive effectiveness if they are properly designed and used. We argue that abstract icons are possible to signify the con- cept in RE. Our results do not show, however, whether the designs of our icons are sufficient for all aspects of RE. Further work is needed to establish the cultural user framework (CUF). Moreover, we have to implement im- provements according to the feedback obtained in the first iteration and the second experimental iteration, which will be evaluated by software companies. REFERENCES [1] O. W. Galitz, “The Essential Guide to User Interface De- sign an Introduction to GUI Design Principles and Tech- niques,” 3rd Edition, Wiley Publishing, Inc., 2007. [2] A. Marcus, “Icons, Symbols, and Signs: Visible Langua- ges to Facilitate Communication,” Interactions, Vol. 10, No. 3, 2003, pp. 37-43. http://dx.doi.org/10.1145/769759.769774 [3] Heimbürger, et al., “Intelligent Icons for Cross-Cultural Knowledge Searching,” Information Modelling and Know- ledge Bases XXIII, Amsterdam, 2012, pp. 77-89. [4] A. Heimbürger and Y. Kiyoki, “Pictorial Symbols in Context: A Means for Visual Communication in Cross- Cultural Environments,” Proceedings of the IADIS Inter- national Conferences, Germany, 27-29 July 2010, pp. 463-467. [5] S. Khanom, A. Heimbürger and T. Kärkkäinen, “Icon- Based Language in Requirements Development,” 22nd EJC, 2012, pp. 20-25. [6] S. Khanom, A. Heimbürger and T. Kärkkäinen, “Icon- Based Language in the Context of Requirements Elicita- tion Process,” Information Modelling and Knowledge Base XXIV, IOS Press, Amsterdam, in press. [7] S. Khanom, “Icon-Based Language in the Context of Re- quirements Engineering,” REFSQ Requirements Engi- neering: Foundation for Software Quality, Germany, 8-11 April 2013, pp. 215-222. [8] P. G. Barker and M. Yazdani, “Iconic Communication,” Intellect Ltd., 2000. Open Access JSEA  Icons: Visual Representation to Enrich Requirements Engineering Work 621 [9] S. Hansen and K. Lyytinen, “Challenges in Contemporary Requirements Practice,” 43rd Hawaii International Con- ference on System Sciences (HICSS), Honolulu, 5-8 Janu- ary 2010, pp. 1-11. [10] L. Mathiassen, T. Tuunanen, T. Saarinen and M. Rossi, “A Contigency Model for Requirements Development,” JAIS, Vol. 8, No. 11, 2007, pp. 569-597. [11] H. Kaiya, D. Shinbara, J. Kawano and M. Saeki, “Im- proving the Detection of Requirements Discordances among Stakeholders,” Requirements Engineering, Vol. 10, No. 4, 2005, pp. 289-303. [12] N. Cerpa and J. M. Verner, “Why Did Your Project Fail?” Communication of the ACM, Vol. 52, No. 12, 2009, pp. 130-134. http://dx.doi.org/10.1145/1610252.1610286 [13] K. El Emam and A. G. Koru, “A Replicated Survey of IT Software Project Failures,” IEEE Software, Vol. 25, No. 5, 2008, pp. 84-90. http://dx.doi.org/10.1109/MS.2008.107 [14] D. L. Moody, “The ‘Physics’ of Notations: Toward a Sci- entific Basis for Constructing Visual Notations in Soft- ware Engineering,” IEEE Transactions on Software En- gineering, Vol. 35, No. 6, 2009, pp. 756-779. http://dx.doi.org/10.1109/TSE.2009.67 [15] N. Aykin, “Usability and Internationalization of Informa- tion Technology,” Lawrence Erlbaum Association, Inc., London, 2005. [16] R. Bendraou, J. Jezequel, M. Gervais and X. Blanc, “A Comparison of Six UML-Based Languages for Software Process Modeling,” IEEE Transactions on Software En- gineering, Vol. 36, No. 5, 2010, pp. 662-675. http://dx.doi.org/10.1109/TSE.2009.85 [17] S. Morris and G. Spanoudakis, “UML: An Evaluation of the Visual Syntax of the Language,” Proceedings of the 34th Annual Hawaii International Conference on System Sciences, Hawaii, 3-6 January 2001, p. 10. [18] L. Duboc, E. Letier and D. S. Rosenblum, “Systematic Elaboration of Scalability Requirements through Goal- Obstacle Analysis,” IEEE Transactions on Software En- gineering, Vol. 39, No. 1, 2013, pp. 119-140. http://dx.doi.org/10.1109/TSE.2012.12 [19] D. L. Moody, P. Heymans and R. Matulevičius, “Visual Syntax Does Matter: Improving the Cognitive Effective- ness of the i* Visual Notation,” Requirements Engineer- ing, Vol. 15, No. 2, 2010, pp. 141-175. http://dx.doi.org/10.1007/s00766-010-0100-1 [20] D. L. Moody and J. V. Hillegersberg, “Evaluating the Visual Syntax of UML: An Analysis of the Cognitive Ef- fectiveness of the UML Family of Diagrams,” Software Language Engineering, Vol. 5452, 2009, pp. 16-34. http://dx.doi.org/10.1007/978-3-642-00434-6_3 [21] S. J. P. McDougall, M. B. Curry and O. D. Bruijn, “The Effects of Visual Information on Users’ Mental Models: An Evaluation of Pathfinder Analysis as a Measure of Icon Usability,” Journal of Cognitive Ergonomics, Vol. 5, No. 1, 2001, pp. 59-84. http://dx.doi.org/10.1207/S15327566IJCE0501_4 [22] H. F. Wang, S. H. Hung and C. C. Liao, “A Survey of Icon Taxonomy Used in the Interface Design,” Proceed- ings of the 14th European Conference on Cognitive Er- gonomics: Invent! Explore! London, 28-31 August 2007, pp. 203-206. [23] A. W. Y. Ng and A. H. S. Chan, “Visual and Cognitive Features on Icon Effectiveness,” Proceedings of the In- ternational Multiconference of Engineers and Computer Scientists, Vol. 2, 2008, pp. 19-21. [24] S. J. P. McDougall, M. B. Curry and O. D. Bruijn, “Mea- suring Symbol and Icon Characteristics: Norms for Con- creteness, Complexity, Meaningfulness, Familiarity, and Semantic Distance for 239 Symbols,” Behavior Research Methods, Instruments & Computers, Vol. 31, No. 3, 1999, pp. 487-519. http://dx.doi.org/10.3758/BF03200730 [25] Y. Yu and J. D. He, “An Analysis of Users’ Cognitive Factors towards Icon in Interactive Interface,” Intelligent 2nd International Conference on Intelligent Human-Ma- chine Systems and Cybernetics (IHMSC), Nanjing, 26-28 August 2010, pp. 26-28. [26] S. Fitrianie and L. J. M. Rothkrantz, “A Visual Commu- nication Language for Crisis Management,” International Journal of Intelligent Control and Systems, Vol. 12, No. 2, 2007, pp. 208-216. [27] S. Fitrianie, D. Datcu and L. J. M. Rothkrantz, “Human Communication Based on Icons in Crisis Environments,” Usability and Internationalization, Vol. 4560, 2007, pp. 57-66. http://dx.doi.org/10.1007/978-3-540-73289-1_7 [28] D. L. McGuinness and F. V. Harmelen, “OWL Web On- tology Language Overview,” 2004. http://www.w3.org/TR/owl-features/ [29] G. Hofstede, “Cultures and organizations: Software of the Mind,” McGraw-Hill, New York, 1997. [30] K. Reinecke and A. Bernstein, “Improving Performance, Perceived Usability, and Aesthetics with Culturally Adap- tive User Interfaces,” ACM Transactions on Computer- Human Interaction, Vol. 18, No. 2, 2011, pp. 8-29. http://dx.doi.org/10.1145/1970378.1970382 [31] D. E. Leidner and T. Kayworth, “A Review of Culture in Information Systems: Toward a Theory of Information Technology Culture Conflict,” MIS Quarterly, Vol. 30, No. 2, 2006, pp. 357-399. [32] A. Heimbürger, et al., “Communication across Cultures in the Context of Multicultural,” Software Development. Reports of the Department of MIT. Series C. Software and Computational Engineering, 2011. [33] S. K. Ackerman, “Mapping User Interface Design to Cul- ture Dimensions,” Proceedings of IWIPS, Texas, 11-13 July 2002, pp. 89-100. [34] S. Shen, M. Woolley and S. Prior, “Towards Culture- Centred Design,” Interacting with Computers, Vol. 18, No. 4, 2006, pp. 820-852. http://dx.doi.org/10.1016/j.intcom.2005.11.014 [35] A. Marcus and E. W. Gould, “Crosscurrents: Cultural Di- mensions and Global Web User-Interface Design,” In- teractions, Vol.7, No. 2, 2002, pp. 32-46. [36] A. R. Hevner, S. T. March, J. Park and S. Ram, “Design Science in Information Systems Research,” MIS Quar- terly, Vol. 28, No. 1, 2004, pp. 74-105. [37] K. Peffers, T. Tuunanen, M. A. Rothenberger and S. Chatterjee, “A Design Science Research Methodology for Open Access JSEA  Icons: Visual Representation to Enrich Requirements Engineering Work Open Access JSEA 622 Information Systems Research,” Journal of Management Information Systems, Vol. 24, No. 3, 2007, pp. 45-78. http://dx.doi.org/10.2753/MIS0742-1222240302 [38] ISO/IEC 9126, “IT-Software Product Evaluation-Quality Characteristics,” International Organization for Standard- ization, Geneve, 1991. [39] S. J. P. McDougall and M. Burry, “More than Just a Pic- ture: Icon Interpretation in Context,” Coping with Com- plexity Workshop, University of Bath, 2007, pp. 1-8. [40] S. Isherwood, “Graphics and Semantics: The Relationship between What Is Seen and What Is Meant in Icon De- sign,” Engineering Psychology and Cognitive Ergonom- ics, Vol. 5639, 2009, pp. 197-205. http://dx.doi.org/10.1007/978-3-642-02728-4_21 [41] ETSI EG 202-048, “Human Factors (HF); Guideline on the Multimodality of Icons, Symbols, and Pictograms,” European Telecommunication Standard Institute, France, 2002. [42] ISO/IEC 11581, “Information Technology-User System Interfaces-Icon Symbols and Functions. Part 1: General Icons, Part 2: Object Icons, Part 6: Action Icons,” ISO Copyright, Switzerland, 2002. [43] ETSI EG 201-379, “Human Factors (HF); Framework for the Development, Evaluation and Selection of Graphical Symbols,” European Telecommunications Standards In- stitute, France, 1998. [44] G. Costagliola, V. Deufemia and G. Polese, “A Frame- work for Modeling and Implementing Visual Notations with Applications to Software Engineering,” ACM Trans- actions on Software Engineering and Methodology, Vol. 13, No. 4, 2004, pp. 431-487. http://dx.doi.org/10.1145/1040291.1040293 [45] S. Khanom, A. Heimbürger and T. Kärkkäinen, “Icon- Based Language: Auxiliary Communication for Require- ments Engineering,” Ijest, Vol. 5, 2013, pp. 1076-1082. [46] Aroyo, et al., “Interoperability in Personalized Adaptive Learning,” Educational Technology & Society, Vol. 9, No. 2, 2006, pp. 4-18. [47] K. Reinecke and A. Bernstein, “Knowing What a User Likes: A Design Science Approach to Interfaces That Automatically Adapt to Culture,” MIS Quarterly, Vol.37, No. 2, 2013, pp. 427-453. [48] K. E. Wiegers, “Software Requirements,” 2nd Edition, Microsoft Press, 2003.
|