 Journal of Software Engineering and Applications, 2013, 6, 597-609 Published Online November 2013 (http://www.scirp.org/journal/jsea) http://dx.doi.org/10.4236/jsea.2013.611072 Open Access JSEA 597 Analysis of Software Development and Enhancement Projects Work Effort per Unit Based on the COSMIC Method with Regard to Technological Factors—Case Study Beata Czarnacka-Chrobot Institute of Information Technology and Digital Economy, Warsaw School of Economics, Warsaw, Poland. Email: bczarn@sgh.waw.pl Received October 3rd, 2013; revised November 1st, 2013; accepted November 10th, 2013 Copyright © 2013 Beata Czarnacka-Chrobot. This is an open access article distributed under the Creative Commons Attribution Li- cense, which permits unrestricted use, distribution, and reproduction in any medium, provided the original work is properly cited. ABSTRACT This paper aims to present a case study that consists in the analysis of work effort per unit of software systems Devel- opment and Enhancement Projects (D&EP) depending on technological factors. That analysis was commissioned by one of the largest public institutions in Poland. This is the COSMIC (Common Software Measurement International Consortium) function points method that is chosen by this institution as a point of reference for size of software systems developed/enhanced for supporting its functions and therefore this method is the base for the analysis of D&EP work effort per unit with regard to technological factors. Keywords: Software Systems Development and Enhancement Projects; Work Effort per Unit; Functional Size Measurement; COSMIC Method; IFPUG Method 1. Introduction Software systems, like any other product, especially of engineering character, are characterised by certain attrib- utes that should be subject to measurement. Basic attrib- ute of each and every product is its size. Software engi- neering, however, cannot boast about being as mature in terms of units designed for size measurement (here: of software) as other engineering disciplines (e.g. construc- tion engineering). This constitutes fundamental cause of the problems in reliable and objective estimation of such basic attributes of projects aimed at development, en- hancement and maintenance of software systems as: total work effort and total cost, work effort per unit and cost per unit, project execution duration and project produc- tivity. However, it is not possible to answer the question about the size of these attributes—particularly of the work effort per unit of software system Development and Enhancement Projects (D&EP)—without having previ- ously assumed its appropriate size unit. Among three measures of the software products size being used in practice, that is (for more details see e.g. [1]): 1) programming units (e.g. source lines of code); 2) construction complexity units (e.g. object points); 3) functionality units, this is functionality units in the form of the so called Function Points (FP) that are now being recognised to the highest extent worldwide. This has been proven by the fact of ISO (International Organiza- tion for Standardization) and IEC (International Electro- technical Commission) having accepted them as the only adequate (i.e. sufficiently reliable and objective) units of software size—in the ISO/IEC 14143 norm [2], that stan- dardises the concept of the so called Functional Size Measurement (FSM). As a result of many years’ verification of reliability and objectivity of particular FSM methods, five among them (out of approx. 25) have been acknowledged by the ISO and IEC as conforming to the rules laid down in the ISO/IEC 14143 norm. They are the following (for more details see e.g. [3,4]): A. First generation methods: 1) International Function Point Users Group (IFPUG) method in its part limited to the so called unadjusted FP—normalised in the ISO/IEC 20926 standard [5]; in this method a measure unit is 1 IFPUG FP; 2) Netherlands Software Metrics Association (NESMA) function point method in its part taking into account functional size—normalised in the ISO/IEC 24570  Analysis of Software Development and Enhancement Projects Work Effort per Unit Based on the COSMIC Method with Regard to Technological Factors—Case Study 598 standard [6]; in this method a measure unit is 1 NESMA FP, which now is considered to be equiva- lent to 1 IFPUG FP; 3) Mark II (MkII) function point method, having been developed by the United Kingdom Software Metrics Association (UKSMA) in its part taking into account functional size—normalised in the ISO/IEC 20968 standard [7]. B. Second generation methods: 4) Common Software Measurement International Con- sortium (COSMIC) function point method—nor - malised in the ISO/IEC 19761 standard [8]; in this method a measure unit is 1 COSMIC Function Point (1 CFP); 5) FSM method having been developed by the Finnish Software Measurement Association (FiSMA)—nor- malised in the ISO/IEC 29881 standard [9]. As indicated above, first generation methods have been accepted by the ISO/IEC in their part concerning only the functional size measurement, that is, further steps proposed by the organisations developing them (IFPUG, NESMA, UKSMA) have not been approved. On the other hand, second generation methods are ac- cepted by the ISO/IEC in their full versions. However, the IFPUG FP method continues to be the most popular FSM method—hence, for this very method, the largest resources of benchmarking data can be found [10], on the basis of which the above mentioned attrib- utes of software systems D&EP, including work effort (total as well as per unit) and cost (total as well as per unit), are being estimated. On the other hand, for the past couple of years, this is COSMIC method that has been growing dynamically, however, the existing resources of benchmarking data for it are considerably scarce com- pared to such data available for IFPUG method as it is a much newer approach. This paper aims to present a case study that consists in the analysis of work effort per unit of software systems D&EP depending on technological factors that is com- missioned by one of the largest public institutions in Po- land. This is the COSMIC method that is chosen by this institution as a point of reference for software size in case of development/enhancement of modules/applica- tions of software system (being one of the largest in Europe) and therefore for the D&EP work effort per unit analysis. Thus the structure of the paper reads as follows: after presented in Section 2, the assumptions are adopted in the considered case study and in Section 3, the resources of benchmarking data are worth using in the analysis of the issues considered; Section 4 will present selected data that are recommended to be used in direct calculation of the work effort per unit. Then Section 5 is devoted to major problems related to its indirect calculation. In Sec- tion 6, a synthesis of conclusions for the considered case study is presented while Section 7 features key conclu- sions resulting from all the considerations presented in the paper. 2. Assumptions for the Considered Case Study Work effort per unit of software systems D&EP is diffi- cult to determine since it depends on numerous factors, among others: on the type of software system, type of project, field of application, technological environment of project execution (mainly hardware platform and pro- gramming languages being used) as well as on many other factors affecting high differentiation in productivity of development/enhancement teams’ work. Thus, in addition to the assumption that analysis is to be based on COSMIC method, it should be also stressed that the subject matter being considered in this paper is work effort per unit of actions concerning applications dedicated to the needs of the considered institution (not commercial software packages) whereas these actions consist in development/enhancement of such systems, in particular in development of new applications from scratch and in modification/enhancement of the existing ones, and not in their maintenance, in case of which work effort per unit requires analysis of different resources of benchmarking data. Moreover, client declares that all modules/applications considered should be treated as business applications (contrary to real-time projects). What’s more, the purpose of the presented case study is to demonstrate how the effort per unit of software de- velopment/enhancement depends on several specific technological factors, i.e. technology of development/ enhancement (programming languages), hardware plat- form and processing mode—with the sizes of modules/ applications being taken into account. Information pro- vided by client indicates that the considered modules/ applications are estimated to be within the following software size ranges: 1) less than 100 CPF—approx. 5% of the modules, 2) from 101 CFP up to 500 CFP—approx. 45% of the modules, 3) from 501 CFP up to 1000 CFP— approx. 40% of the modules, 4) over 1001 CFP—approx. 10% of the modules. The above assumptions determine the use of specific benchmarking data resources. 3. Benchmarking Data Resources for Work Effort per Unit of Dedicated Business Applications Development/Enhancement Appropriate resources of own benchmarking data, which would allow to determine specific to a given software Open Access JSEA  Analysis of Software Development and Enhancement Projects Work Effort per Unit Based on the COSMIC Method with Regard to Technological Factors—Case Study 599 development organisation work effort per unit or own productivity (being reverse of the work effort per unit) are owned by relatively few development organisations since owning such resources is conditioned not only by the effective implementation of measurement program- mes for software products and processes, which in its own right does not occur often, but also by collecting such data for relatively many projects completed in the past, being similar in terms of application and technology, and additionally, referring them to the correct units of software systems size (for more details see [11]). This situation is all the more likely to happen in Poland where FSM methods, including COSMIC method, have been employed for a relatively short time now. In the situation like that repositories with general benchmarking data prove useful. The largest, commonly known and widely available repository containing gen- eral benchmarking data for dedicated software systems D&EP, whose products are measured using the FSM methods, is managed by the International Software Benchmarking Standards Group (ISBSG)1. The ISBSG is a non-profit organisation founded in the second half of the 1990s. with the purpose to enhance the processes of IT resources management both in business entities as well as in public administration institutions. This goal is being fulfilled by developing and maintaining several repositories with benchmarking data. One of them, the biggest one (current version of this repository contains data concerning more than 5600 projects from about 30 countries) includes data for software D&EP2. It is nor- malized according to the ISO/IEC 15939 standard [12], verified and representative of the current technology. Data gathered in the discussed repository have been classified by the ISBSG with regard to the following cri- teria (see [13,14]): country where a project was undertaken; context of a project, including: type of organisation (including: developed for public institutions—approx. 750 projects) and area of business; type of project, including: type of actions (modifica- tion/enhancement of a system—approx. 60%, devel- opment from scratch—approx. 40%), purpose of a project (internal needs—approx. 48%, external needs —approx. 52%) and size of development team; type of product, including: type of application (in- cluding business applications) and product size—for the most part expressed in IFPUG FP, however prod- ucts measured in CFP are represented sufficiently too (approx. 400 projects); project execution environment, including: program- ming language (over 100 programming languages, among them 64% are 3GL languages, 33% - 4GL lan- guages, while 3% are application generators; main programming languages include: COBOL, C/C++/C#, Java/J2EE/Javascript, Visual Basic, PL/I, PL/SQL, Oracle, .Net, SQL, Natural, Access, PowerBuilder, ASP, and Lotus Notes) and hardware platform (approx. 40% are mainframe projects); development methods and tools being used. Using data gathered by this organisation one should bear in mind that they are representative of rather above- average projects which results from the following (for more details see [11]): criteria of gathering data in ISBSG repository take into account only those organisations that are using FSM methods while such organisations are consid- ered more mature than others because they execute programmes concerning implementation of software measures; this is developers themselves that choose projects whose data they provide to the ISBSG repository— those may include projects that are typical of them as well as projects having best parameters; the ISBSG repository does not feature too many data about very large projects. It should be stressed that ISBSG data are subject to rigorous process of verification with regard to quality. Hence they are appreciated in the IT industry while gen- eral conclusions coming from their analysis correspond with the conclusions coming from the projects of devel- opment/enhancement of software systems, including business applications. Based on the data about dedicated software system D & EP the ISBSG produces cyclic analytical reports. From the perspective of the issues discussed in this paper the most important one is the report of March 2012 entitled, “The Performance of Business Application, Real-Time and Component Software Projects. An analysis of COS- MIC-measured projects in the ISBSG database” [15], which the ISBSG made in collaboration with the COS- MIC. It analyses the size of work effort per unit with regard to 1 CFP, that is the so called Project Delivery Rate (PDR), for various types of software systems de- pending on major impact factors. Thus PDR is the ratio of the work effort (expressed in work-hours) to the ap- 1http://www.isbsg.org (23.08.2013). C. Jones estimates that there are dozen or so sources of benchmarking data at the moment however definite majority of them are not widely available. What’s more, part o them contain data about relatively low number of projects, in addition they do not always concern the FSM methods (see [10]). Due to these reasons, among others, the ISBSG repository of benchmarking data is recognised as best at the moment. 2As it indicates, at this level the ISBSG does not differ development o new software products from scratch from the projects consisting in enhancement of the existing software believing that they are of similar character with regard to key attributes. However, the ISBSG clearly differentiates software maintenance and support projects from them since data for such projects are collected in a different, separate reposi- tory–which is not a subject of our analysis here. Open Access JSEA  Analysis of Software Development and Enhancement Projects Work Effort per Unit Based on the COSMIC Method with Regard to Technological Factors—Case Study 600 plication size (expressed in function points—here in CFP). It is worth noting that this attribute is the inverse of other attribute that may be found more often both in the analy- ses as well in practice, namely productivity. In the dis- cussed report total productivity (effort) is normalized on the so called first level, which means that it comprises all actions making up the project’s life cycle: from specifi- cation to implementation. As indicated by the adopted assumptions, what is of interest here in this paper is PDR for development/enhancement of business applications. 4. Work Effort per Unit with Regard to 1 CFP—Direct Calculation In the considered report, the analysis of PDR with regard to 1 COSMIC function point (CFP) is based on data coming from 314 business application projects (they were completed in 1999-2011), among them [15, p. 7]): 162 projects consisted in development of new busi- ness applications whereas: - their sizes ranged from 10 to nearly 2000 CFP, - their effort oscillated between 60 and 46000 work- hours (i.e. approx. 30 work-years) with median3 amounting to 3289 work-hours (i.e. approx. 2.5 work- years). 152 projects consisted in enhancement of business applications whereas: - their sizes ranged from 3 to over 2000 CFP, - their effort oscillated between 24 and over 21000 work-hours (i.e. approx. 15 work-years) with median amounting to 3289 work-hours (i.e. approx. 2.5 work- years). 4.1. Business Application Development Projects Data presented in the report [15, pp. 8-13, 16-17] indi- cate that work effort per unit with regard to 1 CFP for business application development projects depending on the programmin g language generation reads as follows: For 3GL (82% of the projects under analysis), the PDR median is 24.5 work-hours/1 CFP, minimum value is 2.7 work-hours/1 CFP, while maximum value— as many as 330.6 work-hours/1 CFP, however 90% of the projects have PDR not higher than 64.8 work- hours/1 CFP. For 4GL (18% of the projects under analysis—main programming languages include ASP. Net and Ora- cle), the PDR median is 9.2 work-hours/1 CFP, mini- mum value is 1.6 work-hours/1 CFP, while maximum value-82 work-hours/1 CFP, however 90% of the pro- jects have PDR not higher than 31.2 work-hours/1 CFP. The above indicates that application development pro- jects using 4GL programming language on average are approx. 2.5 times more efficient comparing to application development projects employing 3GL languages. More detailed analysis of specific 3GL programming languages that were analysed allowed stating that: For programming languages: C, C#, C#.Net and C++, the PDR median is 14 work-hours/1 CFP, minimum value is 4 work-hours/1 CFP, while maximum value- 52 work-hours/1 CFP, however 90% of the projects have PDR not higher than 43 work-hours/1 CFP. For programming language COBOL, the PDR median is 28 work-hours/1 CFP, minimum value is 8 work- hours/1 CFP, while maximum value–as many as 330 work-hours/1 CFP, however 90% of the projects have PDR not higher than 110 work-hours/1 CFP. For programming language Java/J2EE, the PDR me- dian is 23 work-hours/1 CFP, minimum value is 3 work-hours/1 CFP, while maximum value-139 work- hours/1 CFP, however 90% of the projects have PDR not higher than 61 work-hours/1 CFP. For programming language Visual Basic, the PDR median is 23 work-hours/1 CFP, minimum value is 3 work-hours/1 CFP, while maximum value-57 work- hours/1 CFP, however 75% of the projects have PDR not higher than 38 work-hours/1 CFP. Thus, the PDR median for the analysed 3GL pro- gramming languages differs significantly. Hence it is important to take into account the influence that factors such as hardware platform or size of delivered applica- tion may have on it. For 3GL programming languages the PDR with regard to hardware platform reads as follows: Mainframe–median is 29 work-hours/1 CFP, with minimum value being 8 work-hours/1 CFP, and maximum value being 330 work-hours/1 CFP, how- ever 90% of the projects are characterized by PDR not going higher than 101 work-hours/1 CFP. Mid-range–median is 36 work-hours/1 CFP, with minimum value being 10 work-hours/1 CFP, and maximum value being 65 work-hours/1 CFP, how- ever 75% of the projects are characterized by PDR not exceeding 38 work-hours/1 CFP. PC—median is 23 work-hours/1 CFP, with minimum value being 3 work-hours/1 CFP, and maximum value being 139 work-hours/1 CFP, however 90% of the projects are characterized by PDR not going higher than 55 work-hours/1 CFP. Multi-platform–median is 21 work-hours/1 CFP, with minimum value being 3 work-hours/1 CFP, and maximum value being 66 work-hours/1 CFP, how- ever 90% of the projects are characterized by PDR 3Here, the median appears to be more reliable value than arithmetic mean as it allows to avoid the influence of several atypical (the so called outstanding) projects. Open Access JSEA  Analysis of Software Development and Enhancement Projects Work Effort per Unit Based on the COSMIC Method with Regard to Technological Factors—Case Study 601 not exceeding 52 work-hours/1 CFP. As indicated by the above, mainframe application pro- jects are characterised by visibly lower productivity/ higher work effort per unit as compared to PC projects and multi-platform projects. Conclusions coming from the influence of particular 3GL programming languages and hardware platform on the PDR median are displayed in Table 1. The PDR varies also with regard to the software size. Relevant data for 3GL and 4GL languages (of all busi- ness application development projects under analysis) are displayed in Figure 1, showing productivity (instead of PDR) calculated as the ratio of CFP value to the work- month, with the assumption taken that work-month con- sists of 120 work-hours on average. As indicated by the chart shown in Figure 1, econo- mies of scales may be noted for business application de- velopment projects since median of their productivity goes up with the increase of software size (at least up to the size of over 1000 CFP). This is a conclusion of great significance as it contradicts the hitherto numerous stud- ies of economies/diseconomies of scale in software en- gineering that as a rule provide quite the opposite con- clusion (for more details see e.g. [16]). In the opinion of the author of this paper, fundamental cause for this status quo is referring, in this very case, work effort to appro- priate units of software systems size (CFP), whereas other works take into account units of software size that hardly may be considered as appropriate (e.g. source lines of code). Table 1. Business application development projects–PDR median by programming language and hardware platfor m. Mainframe Multi-platform PC All C type - 16 11 COBOL 28 - - Java 33 19 25 Source: [15, p. 9]. 0 2 4 6 8 10 12 14 Productivity median in CFP/work month 10-5050-100100-200200-300300-500 500-10001000+ Size band in CFP Figure 1. The productivity median by the size of business applications development. Source: [15, p. 10]. Taking into account the described observations it is suggested for business application development projects to use such PDR values as those displayed in Table 2, which is showing how PDR depends on programming language and hardware platform in the situation where PDR median is normalised for the application size of 100 - 200 CFP range. On the other hand if this is possible to consider all 3 key impact factors (or rather a combination of them) be- ing analysed by the ISBSG and COSMIC, that is pro- gramming languages, hardware platform and software size, then the data from Table 2 are suggested to be treated as initial data for which correction coefficients shown in Table 3, taking into account the influence of application size on PDR, should be applied. Thus if we want to determine work effort per unit with regard to 1 CFP for example for a project of development of business application whose size is estimated to be 400 CFP, using Java language on multi-platform, then from Table 2 we choose normalised PDR median taking into account combination of programming language and hardware platform, which equals 20, and next we multi- ply it by coefficient for estimated application size, in this case being 0.8, as a result getting PDR amounting to 16 work-hours/1 CFP. It should be stressed that in the discussed report it is stated explicitly that factors having strongest influence on PDR include (following the order given): 1) applica- tion size, 2) generation of programming language being used, and next 3) hardware platform, whereas specific language of given generation shows relatively lower in- fluence on the work effort per unit4 [15, p. 12]. Other technological factors are considered as having less significant impact on PDR; among them the proc- essing modes-divided into batch, online and mixed mode, may be regarded as worth noting. Data contained in the ISBSG and COSMIC report indicate that batch applica- tion development projects are characterised by 1.7 Table 2. Business application development projects–nor- malisation of PDR median with regard to programming language and hardware platform for the application size of 100 - 200 CFP range. Mainframe Multi-platform PC All C type - 17 ± 7 20 ± 10 COBOL 25 ± 9 - - Java 25 ± 9 20 ± 7 20 ± 10 4GL - 9 ± 4 9 ± 4 Source: [15, p. 12]. 4Size of development team is considered to be another important factor, however it is not being analysed in the considered report. Open Access JSEA  Analysis of Software Development and Enhancement Projects Work Effort per Unit Based on the COSMIC Method with Regard to Technological Factors—Case Study Open Access JSEA 602 Table 3. Business application development proje c t s–P DR c orrec tion coefficient for data shown in Table 2 by application size. Application size in CFP 10 - 50 50 - 100 100 - 200 200 - 300 300 - 500 500 - 1000 1000+ PDR correction coefficient 1.2 1.1 1.0 0.9 0.8 0.65 0.5 Source: [15, p. 12]. times higher work effort per unit (PDR median equalling 30 work-hours per 1 CFP) than projects consisting in development of online application (PDR median equal- ling approx. 18 work-hours per 1 CFP) while in the case of projects developing software working in a mixed mode, the PDR is 2.2 times higher (PDR median equals approx. 40 work-hours per 1 CFP) than that noted for online application projects. Explanation of such relative results is as follows: technology designed for online software development provides functionality (e.g. GUI interfaces) particu- larly easily comparing with technology used to de- velop batch software; development of batch software requires negotiating of interfaces with other systems which decreases pro- ductivity (increases PDR). However, using these median values as well as spe- cific conversion rates one should bear in mind that size of the sample on which their calculation was based was small: 23 projects in total, among them there were 15 batch, 4 online and 4 mixed projects therefore these data can hardly be regarded as representative. There is no doubt, however, that in case of batch processing the PDR value will be higher than that of online processing and this being due to the above mentioned reasons. 4.2. Business Application Enhancement Projects The report [15, pp. 17-22] indicates that for projects con- sisting in enhancement of business applications (adding new, modifying and/or removing the existing functional- ity—approx. 75% of total 152 projects under analysis included all those actions together) the PDR median amounts to 27 work-hours/1 CFP, with minimum value being 1.5 work-hours and maximum value being as many as 315 work-hours/1 CFP, however 90% of the projects are characterised by the effort per unit being up to 81 work-hours/1 CFP. What seems interesting is that enhancement projects show little differentiation in PDR median with regard to programm ing language, respectively: For COBOL language, the PDR median amounts to 27 work-hours/1 CFP (thus it is almost identical as in case of business application development projects), minimum value is 3 work-hours/1 CFP while maxi- mum value-187 work-hours/1 CFP, however 90% of the projects prove having PDR not higher than 84 work-hours/1 CFP. For Java language, the PDR median amounts to 26 work-hours/1 CFP (similar to that of business appli- cation development projects), minimum value is 5 work-hours/1 CFP, while maximum value—as many as 326 work-hours/1 CFP, however 90% of the pro- jects prove having PDR not higher than 188 work- hours/1 CFP. For VB and VC++ languages, the PDR median amounts to 21 work-hours/1 CFP, minimum value is 1.5 work-hours/1 CFP, while maximum value-52 work-hours/1 CFP, however 90% of the projects prove having PDR not higher than 38 work-hours/1 CFP. For 4GL languages, the PDR median amounts to 29 work-hours/1 CFP (note: value higher than that for the above mentioned 3GL languages), minimum value is 3 work-hours/1 CFP, while maximum value- 68 work-hours/1 CFP, however 90% of the projects prove having PDR not higher than 41 work-hours/1 CFP. With similar situation (PDR median slightly differen- tiated) we are dealing with regard to hardware platform, where PDR reads as follows: Mainframe–median amounts to 27 work-hours/1 CFP (similar to that of business application development projects), while minimum value equals 3 work-hours/ 1 CFP, and maximum value-316 work-hours/1 CFP, however 90% of the projects are characterized by PDR not higher than 80 work-hours/1 CFP. PC—median amounts to 30 work-hours/1 CFP, while minimum value equals 2 work-hours/1 CFP, and maximum value-248 work-hours/1 CFP, however 90% of the projects are characterized by PDR not ex- ceeding 149 work-hours/1 CFP. Multi-platform–median amounts to 29 work-hours/1 CFP, while minimum value equals 17 work-hours/1 CFP, and maximum value-49 work-hours/1 CFP, however 75% of the projects are characterized by PDR not higher than 38 work-hours/1 CFP. In case of the considered projects this is also produc- tivity that grows as the size of business application en- hancement increases, which may be seen in the chart in Figure 2. As indicated by the data displayed in Figure 2 being compared to the data shown in Figure 1, productivity growth in case of business application enhancement pro- jects is very similar (at least for the values up to 750 CFP) to productivity growth characteristic of business applica-  Analysis of Software Development and Enhancement Projects Work Effort per Unit Based on the COSMIC Method with Regard to Technological Factors—Case Study 603 0 1 2 3 4 5 6 7 8 9 Productivity medi an in CFP/ work- month 3-5050-100100-200 200-300300-500 500-750 Si z e band in CFP Figure 2. The productivity median by the size of business application enhancement. Source: [15, p. 19]. tion development projects. What’s more, it is stated in the report explicitly that large projects of business appli- cation enhancement (above 1000 CFP) should be treated as projects of their development (see Section 4.1). 4.3. Summary Generalising the above presented results it should be stated that (see [15, pp. 42-44]): 1) For 4 basic categories of business application projects the PDR median reads as follows: development, 3GL languages, multi-platform/PC: 20 work-hours/1CFP, development, 3GL languages, mainframe: 25 work- hours/1CFP, development, 4GL languages: 9 work-hours/1CFP, enhancement: 27 work-hours/1CFP. 2) Thus business application enhancement projects re- quire more work-hours per 1 CFP than business ap- plication development projects do. On the other hand, business application development projects employing the 4GL languages are characterised by significantly higher (more than double) productivity (lower PDR) comparing with business application development pro- jects based on 3GL—assuming, of course, that pro- duct size is the same. What seems interesting, how- ever, is that such differences with regard to the gen- eration of programming language employed do not occur in case of business application enhancement projects (lack of significant difference in terms of productivity). 3) Productivity median for business application devel- opment projects increases (and PDR median de- creases) as the application size grows—more than double for projects having product of the 500 - 1000 CFP range comparing to those with product below 50 CFP. 4) Productivity median for business application en- hancement projects increases (and PDR median de- creases) as the size of application enhancement grows—more than double for projects having product of the 500 - 750 CFP range comparing to those with product below 50 CFP. 5) Due to small sample of projects differentiated with regard to the processing mode the ISBSG data cannot be regarded as representative although they do con- firm the assumption that batch processing decreases productivity (increases PDR). It is also worth noting that both in business application development as well as in business application enhance- ment projects the following regularities were observed (see [13, pp. 33-34]): PDR is low (productivity is high) if 20% to 40% of the total work effort is allocated to the stage of speci- fication and design in project’s lifecycle; PDR is high (productivity is low) if: - less than 20% of the total effort is allocated to the stage of specification and design—since part of the actions need to be undertaken in further stages of project where they require higher expenditure; - more than 40% of the total effort is allocated to the stage of specification and design—since this as a rule implies difficulties with determining specification and/or with design. Undoubtedly, the presented benchmarking data are valuable to an organisation that wants to compare its ef- fectiveness against its environment as well as for the es- timations of the future projects. 5. Work Effort per Unit with Regard to 1 CFP—Possibility of Indirect Calculation? 5.1. COSMIC Method versus IFPUG Method—Differences Being of Significance in the Context of Work Effort per Unit Calculation Current benchmarking data of the ISBSG are based on the analysis of approx. 4500 business application devel- opment or enhancement projects, among them approx. 4000 are projects in which software products were meas- ured using the IFPUG/NESMA FP method. Thus they constitute decidedly larger group of projects than those whose products were measured in CFP. What’s more, these are business applications, which the IFPUG and NESMA methods were intended for. Hence one may consider using benchmarking data also for IFPUG/ NESMA methods in order to determine work effort per unit with regard to 1 CFP indirectly, that is taking into account conversion rates for IFPUG/NESMA function points and COSMIC function points. However one should bear in mind that (see [15,17]): The COSMIC method is a significantly younger method therefore data pertaining to it concern other Open Access JSEA  Analysis of Software Development and Enhancement Projects Work Effort per Unit Based on the COSMIC Method with Regard to Technological Factors—Case Study 604 time than that of data for IFPUG/NESMA methods, what also entails change of productivity of develop- ing/enhancing software products over the years, e.g. due to the emergence of new programming languages, new types of products, etc. Any comparisons should be made only with regard to unadjusted IFPUG/NESMA function points [18], on which the latest ISBSG calculations are based. It has been proved that there is certain correlation for the sizes of the same fragment of software expressed in IFPUG/NESMA FP and COSMIC FP. Due to significant differences in both discussed ap- proaches, in case of measurement of software modi- fication size it is rather not possible to correctly com- pare PDR for enhancement projects versus PDR for development projects being calculated using those two different methods. All methods of software functional size measurement originate from A. Albrecht’s concept of Function Point Analysis (FPA) hence there are some similarities between them. For IFPUG and COSMIC methods, such similari- ties include most of all the same concept of software functional size measurement, based on similar under- standing of measurement’s purpose, measurement’s range and definition of application boundaries (see e.g. [19]). Both approaches, although differently, meet also the requirements that the ISO/IEC 14143 norm imposed on FSM methods therefore both were recognised as in- ternational standards for such measurement (the IFPUG method, however, not in the full version yet in its most important part) (for more details see [3]). However there are features these two methods differ with and which are of significance from the perspective of calculation of software development effort per unit (see e.g. [4], [20, pp. 270-280]): The rules of both methods are based on similar yet not identical meaning of terms linked with data where such key notions of IFPUG method as: entity, file and data element type (DET) have the following equiva- lents in COSMIC method: object of interest, data group and data attribute. What’s also similar yet not identical is the concept of data transformation, that is of elementary processes/ transactional functions (IFPUG) and functional proc- esses (COSMIC) as well as the users viewed generally —as recipients of functionality of the measured soft- ware. Phases of measurement—both approaches make simi- lar but again not identical assumption on the occur- rence of the elements identification phase on the basis of which functional size is being determined, and of the phase of proper measurement where those ele- ments are conveyed on that size expressed numeri- cally [21]. In the IFPUG method, however, the first phase is not described explicitly as a part of meas- urement process although it assumes that measure- ment is based on the specification of functional user requirements (FUR). In the phase of proper meas- urement, with regard to these elements the explicitly described rules of this method are being used. On the other hand, the measurement phase in the COSMIC method is based only on the FUR specification which leads to the separation of various layers of software. Next, upon identification of appropriate boundaries, functional user requirements are being decomposed into a set of functional processes, each of them con- sisting of the set of data movements. In the phase of proper measurement each movement must be identi- fied as the functional size is being determined based on them. Different way of expressing functional user require- ments—in both methods they are being expressed with the use of the so called basic functional compo- nents (BFC); these components however differ. In the approach having been developed by the IFPUG, the following 5 types of BFC are singled out: internal lo- gical file, external interface file, external input, exter- nal output, and external inquiry, while in the COS- MIC method there are 4 BFC types that were isolated: entry, exit, read and write. There is no simple analogy between them since in the COSMIC method data are not measured explicitly and they are not distinguished as type of BFC although in both methods logical transactions are being measured (somewhat differ- ently), which may be proved by the schematic com- parison of both methods displayed in Table 4. Rules of measurement. Fundamental difference in this area is the fact that the IFPUG method takes into ac- count General System Characteristics (GSC), ex- pressing the impact of technological and quality re- quirements on the functional size. This is the reason why this approach has not been fully approved by the ISO/IEC, however including GSC to the calculations is not necessary (when skipping them we obtain un- adjusted number of function points). Characteristics of this type do not exist in COSMIC method where the measurement is based solely on FUR. Boundaries of process sizes. In the IFPUG method, the size of all five BFC is arbitrarily limited therefore the size of software depends on the number of those components. In the COSMIC approach, on the other hand, there is no upper limit for the size of functional process as the size of process is determined by the number of data movements. Besides, from the per- spective of the level of measurement, this is data movements of COSMIC method rather than its func- Open Access JSEA  Analysis of Software Development and Enhancement Projects Work Effort per Unit Based on the COSMIC Method with Regard to Technological Factors—Case Study Open Access JSEA 605 Table 4. Comparison of basic functional components of the methods: IFPUG vs. COSMIC. FSM method Data Data size Transactional f n ti n TransactionsTransaction size internal file external input external output IFPUG external file - number of data element types (DET) - number of record element types ( RET) external inquiry - number of data element types (DET) - number of file type referenced ( FTR) entry transient exit read COSMIC persistent part of functional process functional process write number of data movements Source: [22, p. 146]. tional processes that correspond with elementary processes of the IFPUG method (i.e. inputs, outputs and inquiries) while their size is 1 CFP and does not depend on the number of attribute data nor files to which they pertain as it is the case of the IFPUG method. Way of including data stored in a system. In the method having been developed by the IFPUG, data are included to the calculations in two ways: sepa- rately as internal/external files as well as referenced files affecting the size of elementary process. In case of the COSMIC method, data stored in a system are included into calculations at each movement of data of read or write type. Thus using IFPUG method re- quires constructing of data model which is not neces- sary (yet useful) in the COSMIC approach [22, p. 145]. In the IFPUG method, data model provides also base for early estimations whereas in the COSMIC approach this is process model that is more often used for approximation. Different perspective of measurement. With the use of IFPUG method, functional size is being measured from the perspective of the end user while using COSMIC method—from the point of view of func- tional user that comprises, next to end user, also de- velopers, and they give notice to other applications and devices that interact with the measured software (see [21, p. 115], [23]). Perspective limited to the end user only carries danger of missing out in the calcula- tions such functionality that is not visible to a user- human, on the condition however that we assume that only user being human may be recipient of function- ality. Thus it is not possible–at least for the time being—to make exact conversion of the results of the two methods. When using mathematical formula for this purpose, main reason for this status quo is the fact that basic functional components of the IFPUG method cannot be mapped accurately into BFC of the COSMIC method, and vice versa (see Table 4), however differences in the rules of measurement are of significance here too. This first of all concerns: 1) different understanding of file and its influence on size in the IFPUG method as compared with object of interest in the COSMIC method, 2) different calculation rules for elementary process of the IFPUG method as compared with functional process of the COSMIC method, 3) the fact that in the IFPUG method the influence that number of attribute data has on the size is taken into account whereas in the COSMIC method this is only number of objects of interest that is taken into ac- count, 4) the fact that in the IFPUG method all types of BFC have their upper limit of the size which does not exist for functional processes in the COSMIC method, 5) concept of software layers existing in the COSMIC method, contrary to the IFPUG method, 6) different way of measuring software modifications, which has been already mentioned and which results in a situation where for projects consisting in modifi- cation of the existing software conversion of sizes, even approximate one, is practically impossible. 5.2. COSMIC Method versus IFPUG Method—Attempts on Approximate Conversion of Functional Sizes There are, however, three potential approaches to ap- proximate conversion of results obtained with the use of IFPUG (or NESMA) method into the results expressed in COSMIC function points—for more details see [17, pp. 22-25, 28-29]. One of them is conversion based on statis- tical formula. Numerous studies had been undertaken that aimed to obtain adequate statistical formula ex- pressing the correlation between the sizes obtained with the use of both methods, their results, however, signifi- antly differ (see Table 5). Thus it is recommended that c 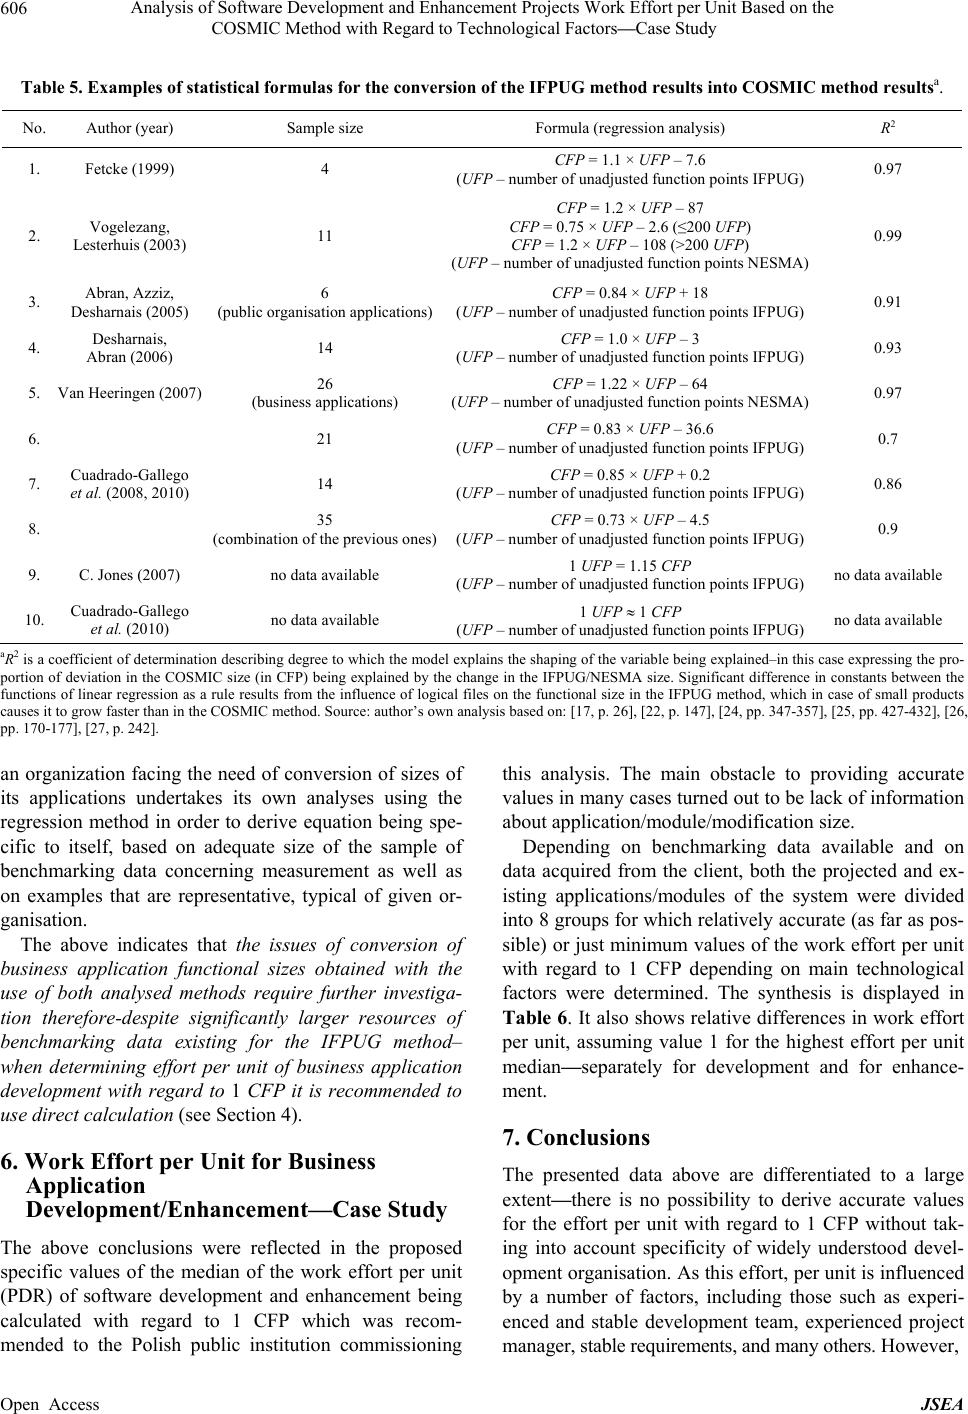 Analysis of Software Development and Enhancement Projects Work Effort per Unit Based on the COSMIC Method with Regard to Technological Factors—Case Study 606 Table 5. Examples of statistical formulas for the conversion of the IFPUG method results into COSMIC method resultsa. No. Author (year) Sample size Formula (regression analysis) R2 1. Fetcke (1999) 4 CFP = 1.1 × UFP – 7.6 (UFP – number of unadjusted function points IFPUG) 0.97 2. Vogelezang, Lesterhuis (2003) 11 CFP = 1.2 × UFP – 87 CFP = 0.75 × UFP – 2.6 (≤200 UFP) CFP = 1.2 × UFP – 108 (>200 UFP) (UFP – number of unadjusted function points NESMA) 0.99 3. Abran, Azziz, Desharnais (2005) 6 (public organisation applications) CFP = 0.84 × UFP + 18 (UFP – number of unadjusted function points IFPUG) 0.91 4. Desharnais, Abran (2006) 14 CFP = 1.0 × UFP – 3 (UFP – number of unadjusted function points IFPUG) 0.93 5. Van Heeringen (2007) 26 (business applications) CFP = 1.22 × UFP – 64 (UFP – number of unadjusted function points NESMA) 0.97 6. 21 CFP = 0.83 × UFP – 36.6 (UFP – number of unadjusted function points IFPUG) 0.7 7. 14 CFP = 0.85 × UFP + 0.2 (UFP – number of unadjusted function points IFPUG) 0.86 8. Cuadrado-Gallego et al. (2008, 2010) 35 (combination of the previous ones) CFP = 0.73 × UFP – 4.5 (UFP – number of unadjusted function points IFPUG) 0.9 9. C. Jones (2007) no data available 1 UFP = 1.15 CFP (UFP – number of unadjusted function points IFPUG) no data available 10. Cuadrado-Gallego et al. (2010) no data available 1 UFP 1 CFP (UFP – number of unadjusted function points IFPUG) no data available aR2 is a coefficient of determination describing degree to which the model explains the shaping of the variable being explained–in this case expressing the pro- portion of deviation in the COSMIC size (in CFP) being explained by the change in the IFPUG/NESMA size. Significant difference in constants between the functions of linear regression as a rule results from the influence of logical files on the functional size in the IFPUG method, which in case of small products causes it to grow faster than in the COSMIC method. Source: author’s own analysis based on: [17, p. 26], [22, p. 147], [24, pp. 347-357], [25, pp. 427-432], [26, pp. 170-177], [27, p. 242]. an organization facing the need of conversion of sizes of its applications undertakes its own analyses using the regression method in order to derive equation being spe- cific to itself, based on adequate size of the sample of benchmarking data concerning measurement as well as on examples that are representative, typical of given or- ganisation. The above indicates that the issues of conversion of business application functional sizes obtained with the use of both analysed methods require further investiga- tion therefore-despite significantly larger resources of benchmarking data existing for the IFPUG method– when determining effort per unit of business application development with regard to 1 CFP it is recommended to use direct calculat i o n (see Section 4). 6. Work Effort per Unit for Business Application Development/Enhancement—Case Study The above conclusions were reflected in the proposed specific values of the median of the work effort per unit (PDR) of software development and enhancement being calculated with regard to 1 CFP which was recom- mended to the Polish public institution commissioning this analysis. The main obstacle to providing accurate values in many cases turned out to be lack of information about application/module/modification size. Depending on benchmarking data available and on data acquired from the client, both the projected and ex- isting applications/modules of the system were divided into 8 groups for which relatively accurate (as far as pos- sible) or just minimum values of the work effort per unit with regard to 1 CFP depending on main technological factors were determined. The synthesis is displayed in Table 6. It also shows relative differences in work effort per unit, assuming value 1 for the highest effort per unit median—separately for development and for enhance- ment. 7. Conclusions The presented data above are differentiated to a large extent—there is no possibility to derive accurate values for the effort per unit with regard to 1 CFP without tak- ing into account specificity of widely understood devel- opment organisation. As this effort, per unit is influenced by a number of factors, including those such as experi- enced and stable development team, experienced project manager, stable requirements, and many others. However, Open Access JSEA 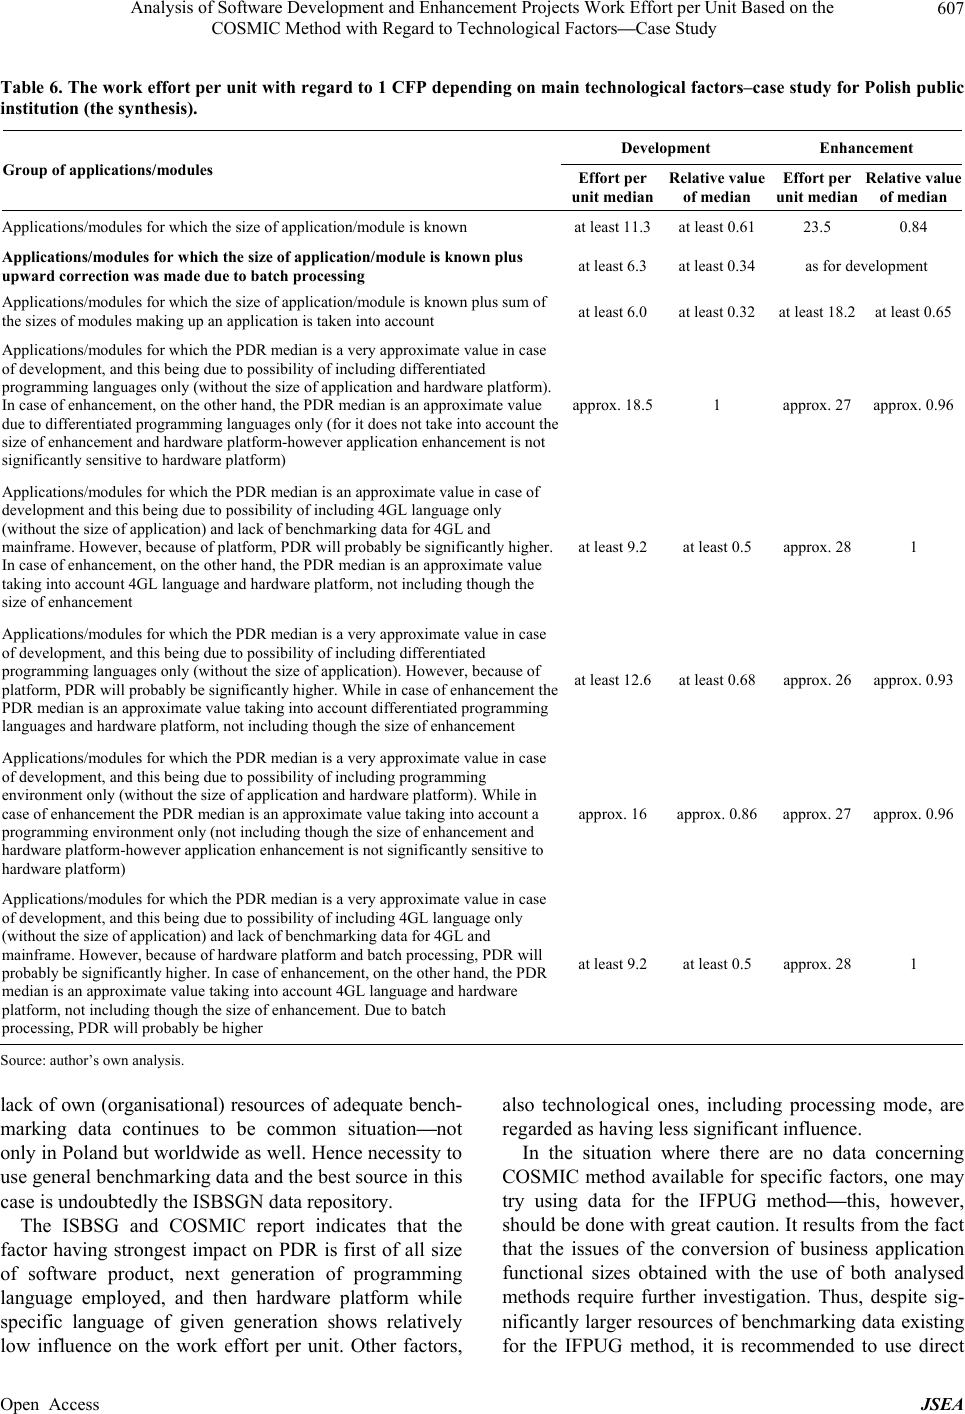 Analysis of Software Development and Enhancement Projects Work Effort per Unit Based on the COSMIC Method with Regard to Technological Factors—Case Study 607 Table 6. The work effort per unit with regard to 1 CFP de pending on main technological factors–case study for Polish public institution (the synthesis). Development Enhancement Group of applications/modules Effort per unit medianRelative value of median Effort per unit median Relative value of median Applications/modules for which the size of application/module is known at least 11.3at least 0.61 23.5 0.84 Applications/modules for which the size of application/module is known plus upward correction was made due to batch processing at least 6.3 at least 0.34 as for development Applications/modules for which the size of application/module is known plus sum of the sizes of modules making up an application is taken into account at least 6.0 at least 0.32 at least 18.2 at least 0.65 Applications/modules for which the PDR median is a very approximate value in case of development, and this being due to possibility of including differentiated programming languages only (without the size of application and hardware platform). In case of enhancement, on the other hand, the PDR median is an approximate value due to differentiated programming languages only (for it does not take into account the size of enhancement and hardware platform-however application enhancement is not significantly sensitive to hardware platform) approx. 18.51 approx. 27 approx. 0.96 Applications/modules for which the PDR median is an approximate value in case of development and this being due to possibility of including 4GL language only (without the size of application) and lack of benchmarking data for 4GL and mainframe. However, because of platform, PDR will probably be significantly higher. In case of enhancement, on the other hand, the PDR median is an approximate value taking into account 4GL language and hardware platform, not including though the size of enhancement at least 9.2 at least 0.5 approx. 28 1 Applications/modules for which the PDR median is a very approximate value in case of development, and this being due to possibility of including differentiated programming languages only (without the size of application). However, because of platform, PDR will probably be significantly higher. While in case of enhancement the PDR median is an approximate value taking into account differentiated programming languages and hardware platform, not including though the size of enhancement at least 12.6at least 0.68 approx. 26 approx. 0.93 Applications/modules for which the PDR median is a very approximate value in case of development, and this being due to possibility of including programming environment only (without the size of application and hardware platform). While in case of enhancement the PDR median is an approximate value taking into account a programming environment only (not including though the size of enhancement and hardware platform-however application enhancement is not significantly sensitive to hardware platform) approx. 16 approx. 0.86 approx. 27 approx. 0.96 Applications/modules for which the PDR median is a very approximate value in case of development, and this being due to possibility of including 4GL language only (without the size of application) and lack of benchmarking data for 4GL and mainframe. However, because of hardware platform and batch processing, PDR will probably be significantly higher. In case of enhancement, on the other hand, the PDR median is an approximate value taking into account 4GL language and hardware platform, not including though the size of enhancement. Due to batch processing, PDR will probably be higher at least 9.2 at least 0.5 approx. 28 1 Source: author’s own analysis. lack of own (organisational) resources of adequate bench- marking data continues to be common situation—not only in Poland but worldwide as well. Hence necessity to use general benchmarking data and the best source in this case is undoubtedly the ISBSGN data repository. The ISBSG and COSMIC report indicates that the factor having strongest impact on PDR is first of all size of software product, next generation of programming language employed, and then hardware platform while specific language of given generation shows relatively low influence on the work effort per unit. Other factors, also technological ones, including processing mode, are regarded as having less significant influence. In the situation where there are no data concerning COSMIC method available for specific factors, one may try using data for the IFPUG method—this, however, should be done with great caution. It results from the fact that the issues of the conversion of business application functional sizes obtained with the use of both analysed methods require further investigation. Thus, despite sig- nificantly larger resources of benchmarking data existing for the IFPUG method, it is recommended to use direct Open Access JSEA  Analysis of Software Development and Enhancement Projects Work Effort per Unit Based on the COSMIC Method with Regard to Technological Factors—Case Study 608 calculation when determining effort per unit of business application development/enhancement with regard to 1 CFP. This calculation was used in the analysis of the effort per unit of software systems development/enhance- ment projects based on the COSMIC method, depending on main technological factors and by taking into account software product size, having been carried out for one of the biggest public institutions in Poland, having in its disposal software system that was listed among the larg- est ones in Europe. REFERENCES [1] B. Czarnacka-Chrobot, “The Economic Importance of Business Software Systems Development and Enhance- ment Projects Functional Assessment,” International Journal on Advances in Systems and Measurements, Vol. 4, No. 1-2, 2011, pp. 135-146. [2] ISO/IEC 14143, “1998-2011 Information Technology— Software Measurement—Functional Size Measurement— Part 1-6,” ISO, Geneva. [3] B. Czarnacka-Chrobot, “The ISO/IEC Standards for the Software Processes and Products Measurement,” Fron- tiers in Artificial Intelligence and Applications, Vol. 199, 2009, pp. 187-200. [4] B. Czarnacka-Chrobot, “The Effectiveness of Business Software Systems Functional Size Measurement,” Pro- ceedings of the 6th International Multi-Conference on Computing in the Global Information Technology (ICCGI 2011), Luxemburg City, Luxemburg, 2011, pp. 63-71. [5] ISO/IEC 20926, “2009 Software and Systems Engineer- ing—Software Measurement—IFPUG Functional Size Measurement Method,” 2nd Edition, ISO, Geneva, 2009. [6] ISO/IEC 24570, “2005 Software Engineering—NESMA Functional Size Measurement Method Version 2.1. Defi- nitions and Counting Guidelines for the Application of Function Point Analysis,” ISO, Geneva. [7] ISO/IEC 20968, “2002 Software engineering—Mk II Function Point Analysis—Counting Practices Manual,” ISO, Geneva. [8] ISO/IEC 19761, “2011 Software Engineering—COSMIC: A Functional Size Measurement Method,” 2nd Edition, ISO, Geneva. [9] ISO/IEC 29881, “2008 Information Technology—Soft- ware and Systems Engineering—FiSMA 1.1 Functional Size Measurement Method,” ISO, Geneva. [10] C. Jones, “Sources of Software Benchmarks, Version 13,” Capers Jones & Associates LLC., Narragansett, 2011. [11] B. Czarnacka-Chrobot, “The Role of Benchmarking Data in the Software Development and Enhancement Projects Effort Planning,” Frontiers in Artificial Intelligence and Applications, Vol. 199, 2009, pp. 106-127. [12] ISO/IEC 15939, “2007 Systems and Software Engineer- ing—Measurement Process,” ISO, Geneva. [13] International Software Benchmarking Standards Group, “Data Demographics-Release 11,” ISBSG, Hawthorn, VIC, 2009. [14] International Software Benchmarking Standards Group, “Release 10 Repository Demographics,” ISBSG, Haw- thorn, VIC, 2007. [15] H. Heeringen and Ch. Symons, “The Performance of Bu- siness Application, Real-Time and Component Software Projects. An Analysis of COSMIC-Measured Projects in the ISBSG Database, COSMIC and ISBSG,” 2012. [16] B. Czarnacka-Chrobot, “(Dis)economies of Scale in Busi- ness Software Systems Development and Enhancement Projects,” Computer Technology and Application, Vol. 3, No. 1, 2012, pp. 88-97. [17] Common Software Measurement International Consor- tium, “The COSMIC Functional Size Measurement Me- thod, Version 3.0, Advanced and Related Topics,” COS- MIC, Québec, 2007. [18] International Function Point Users Group, “Function Point Counting Practices Manual, Release 4.3, Part 0-5,” IF- PUG, NJ, 2010. [19] J. Cuadrado-Gallego, D. Rodríguez, F. Machado and A. Abran, “Convertibility between IFPUG and COSMIC Functional Size Measurements,” Proceedings of 8th In- ternational Conference on Product-Focussed Software Process Improvement (PROFES 2007), Riga, 2-4 July 2007, pp. 273-283. [20] B. Czarnacka-Chrobot, “Functional Measurement of Man- agement Software Systems Development and Enhance- ment Projects,” Warsaw School of Economics, Warsaw, 2009. [21] G. Xunmei, S. Guoxin and Z. Hong, “The Comparison between FPA and COSMIC-FFP,” Proceedings of Soft- ware Measurement European Forum (SMEF) Conference, Rome, 10-12 May 2006, pp. 113-114. [22] H. Heeringen, “Changing from FPA to COSMIC. A Tran- sition Framework,” Proceedings of Software Measure- ment European Forum (SMEF) Conference, Rome, 9-11 May 2007. [23] Common Software Measurement International Consor- tium (COSMIC), 2013. http://www.cosmicon.com/advantagecs.asp [24] J. Cuadrado-Gallego, L. Buglione, M. Domínguez-Alda, M. de Sevilla, J. Gutierrez de Mesa and O. Demirors, An “Experimental Study on the Conversion between IFPUG and COSMIC Functional Size Measurement Units,” In- formation and Software Technology, Vol. 52, No. 3, 2010. http://dx.doi.org/10.1016/j.infsof.2009.12.001 [25] J. Cuadrado-Gallego, L. Buglione, R. Rejas-Muslera and F. Machado-Piriz, “IFPUG-COSMIC Statistical Conver- sion,” Proceedings of the 34th Euromicro Conference on Software Engineering, Parma, 1-5 September 2008. [26] C. Gencel and C. Bideau, “Exploring the Convertibility between IFPUG and COSMIC Function Points: Prelimi- nary Findings,” Proceedings of Joint Conference of the 22nd International Workshop on Software Measurement Open Access JSEA  Analysis of Software Development and Enhancement Projects Work Effort per Unit Based on the COSMIC Method with Regard to Technological Factors—Case Study Open Access JSEA 609 and the 7th International Conference on Software Proc- ess and Product Measurement, Assisi, 17-19 October 2012. [27] C. Jones, “Estimation Software Costs,” McGraw Hill, New York, 2007.
|