Paper Menu >>
Journal Menu >>
 Energy and Power Engineering, 2013, 5, 1463-1467 doi:10.4236/epe.2013.54B277 Published Online July 2013 (http://www.scirp.org/journal/epe) Some Properties of the Electromagnetic Radiation Emitted by the HV Transformers Nikolay V. Kinsht, Natalia N. Petrun’ko, Peter V. Katz Tech. Diagnosis Lab. Institute of Automation & Control Processes FEB RAS, Vladivostok, Russia Email: kin@dvo.ru Received April, 2013 ABSTRACT One important way to control the technical condition of the high-voltage power equipment element is the monitoring and interpretation of electromagnetic radiation. Analysis of the spectra of emitted high-voltage equipment EMR pro- vides information on which determines the intensity discharge processes occurring in insulation and other structural elements of high voltage equipment under the operating voltage without interfering with the process. Keywords: Partial Discharge; Power Transformer; Emitted Electromagnetic Radiation; Technical Condition 1. Partial Discharges in the HV Devices Insulation Development of new methods of diagnostics is today one of the most science-intensive areas of research and as- sessment of the technical condition and residual resource of high-voltage transformer equipment (TE) in the early stages of degradation of its technical conditions (TC). One of the reasons for the lack of effectiveness of the methods of TE early diagnostics is the lag in the funda- mental component of comprehension of electrophysical processes occurring in the real objects. Technical conditions of the TE are largely determined by the condition of its insulation. Partial electrical dis- charges (PD) arise as during normal operation of the equipment, as when the degradation of the insulation and other structural elements. PD is the primary electro- physical process, and they characterize the equipment quality. According the International Electrotechnical Commis- sion (IEC) International Standard 60270 - 2000 [1] the principles of the method, which is applied to the present time and based on the concept of so-called “apparent charge” well known. They are formulated over 70 years ago. The simplest mathematical model based on "appar- ent charge" is constructed on the analysis of the dis- charge in the single inclusion in the insulation. However, the practice of operation of the responsible power equipment showed that the means of control of the TCS of the equipment, based on the concept of apparent charge, could not prevent large-scale accidents. Our researches [2] has shown that this concept is rather poor, it does not take into account a number of essential factors: the geometric arrangement of inclusion in the space of insulation, the variation of the ignition voltage of the PD, the uncertainties in the voltage of ex- tinction of the PD, the duration of the burning of the PD, insulation tgδ. These factors are the parameters of a common electrophysical processes; in the aggregate variation of these factors is the uncertainty in several orders of magnitude. In addition, this concept is funda- mentally not taking into account the collective effects of the large number PD. Some ways time-frequency repre- sentation of a set PD as, for example, it is represented in Figure 1 are known. However such analysis is insuffi- cient for practice. 2. EMR as a Diagnostic Sign PD are caused own electromagnetic radiation (EMR) in a wide range of frequencies, which can be clearly detected Figure 1. Example of a phase-numbers representation of ‘apparent’ charges. Copyright © 2013 SciRes. EPE 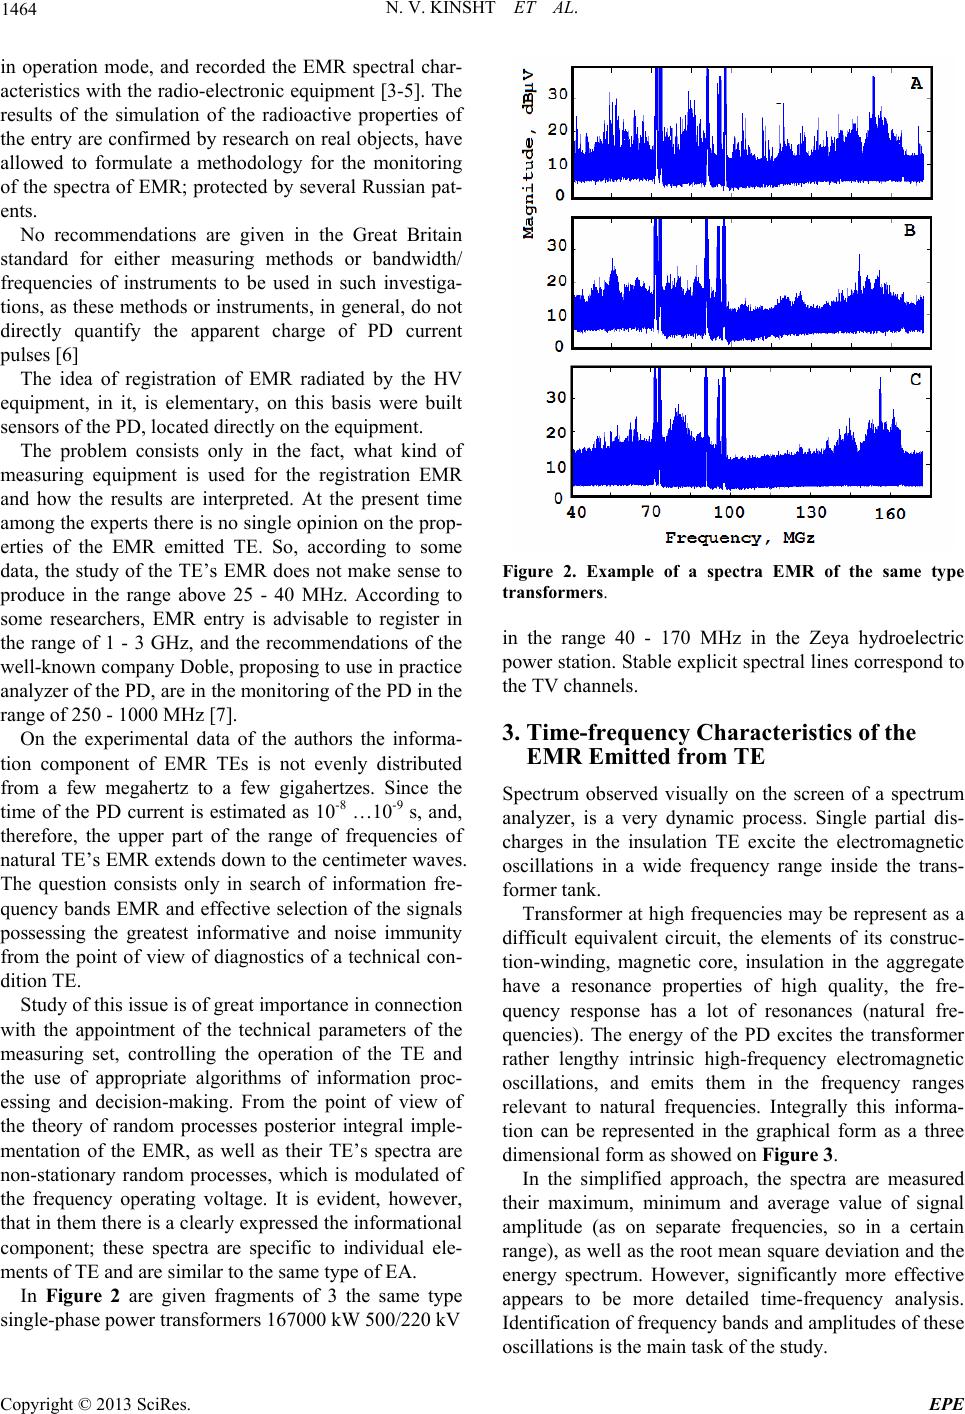 N. V. KINSHT ET AL. 1464 in operation mode, and recorded the EMR spectral char- acteristics with the radio-electronic equipment [3-5]. The results of the simulation of the radioactive properties of the entry are confirmed by research on real objects, have allowed to formulate a methodology for the monitoring of the spectra of EMR; protected by several Russian pat- ents. No recommendations are given in the Great Britain standard for either measuring methods or bandwidth/ frequencies of instruments to be used in such investiga- tions, as these methods or instruments, in general, do not directly quantify the apparent charge of PD current pulses [6] The idea of registration of EMR radiated by the HV equipment, in it, is elementary, on this basis were built sensors of the PD, located directly on the equipment. The problem consists only in the fact, what kind of measuring equipment is used for the registration EMR and how the results are interpreted. At the present time among the experts there is no single opinion on the prop- erties of the EMR emitted TE. So, according to some data, the study of the TE’s EMR does not make sense to produce in the range above 25 - 40 MHz. According to some researchers, EMR entry is advisable to register in the range of 1 - 3 GHz, and the recommendations of the well-known company Doble, proposing to use in practice analyzer of the PD, are in the monitoring of the PD in the range of 250 - 1000 MHz [7]. On the experimental data of the authors the informa- tion component of EMR TEs is not evenly distributed from a few megahertz to a few gigahertzes. Since the time of the PD current is estimated as 10-8 …10-9 s, and, therefore, the upper part of the range of frequencies of natural TE’s EMR extends down to the centimeter waves. The question consists only in search of information fre- quency bands EMR and effective selection of the signals possessing the greatest informative and noise immunity from the point of view of diagnostics of a technical con- dition TE. Study of this issue is of great importance in connection with the appointment of the technical parameters of the measuring set, controlling the operation of the TE and the use of appropriate algorithms of information proc- essing and decision-making. From the point of view of the theory of random processes posterior integral imple- mentation of the EMR, as well as their TE’s spectra are non-stationary random processes, which is modulated of the frequency operating voltage. It is evident, however, that in them there is a clearly expressed the informational component; these spectra are specific to individual ele- ments of TE and are similar to the same type of EA. In Figure 2 are given fragments of 3 the same type single-phase power transformers 167000 kW 500/220 kV Figure 2. Example of a spectra EMR of the same type transformers. in the range 40 - 170 MHz in the Zeya hydroelectric power station. Stable explicit spectral lines correspond to the TV channels. 3. Time-frequency Characteristics of the EMR Emitted from TE Spectrum observed visually on the screen of a spectrum analyzer, is a very dynamic process. Single partial dis- charges in the insulation TE excite the electromagnetic oscillations in a wide frequency range inside the trans- former tank. Transformer at high frequencies may be represent as a difficult equivalent circuit, the elements of its construc- tion-winding, magnetic core, insulation in the aggregate have a resonance properties of high quality, the fre- quency response has a lot of resonances (natural fre- quencies). The energy of the PD excites the transformer rather lengthy intrinsic high-frequency electromagnetic oscillations, and emits them in the frequency ranges relevant to natural frequencies. Integrally this informa- tion can be represented in the graphical form as a three dimensional form as showed on Figure 3. In the simplified approach, the spectra are measured their maximum, minimum and average value of signal amplitude (as on separate frequencies, so in a certain range), as well as the root mean square deviation and the energy spectrum. However, significantly more effective appears to be more detailed time-frequency analysis. Identification of frequency bands and amplitudes of these oscillations is the main task of the study. Copyright © 2013 SciRes. EPE 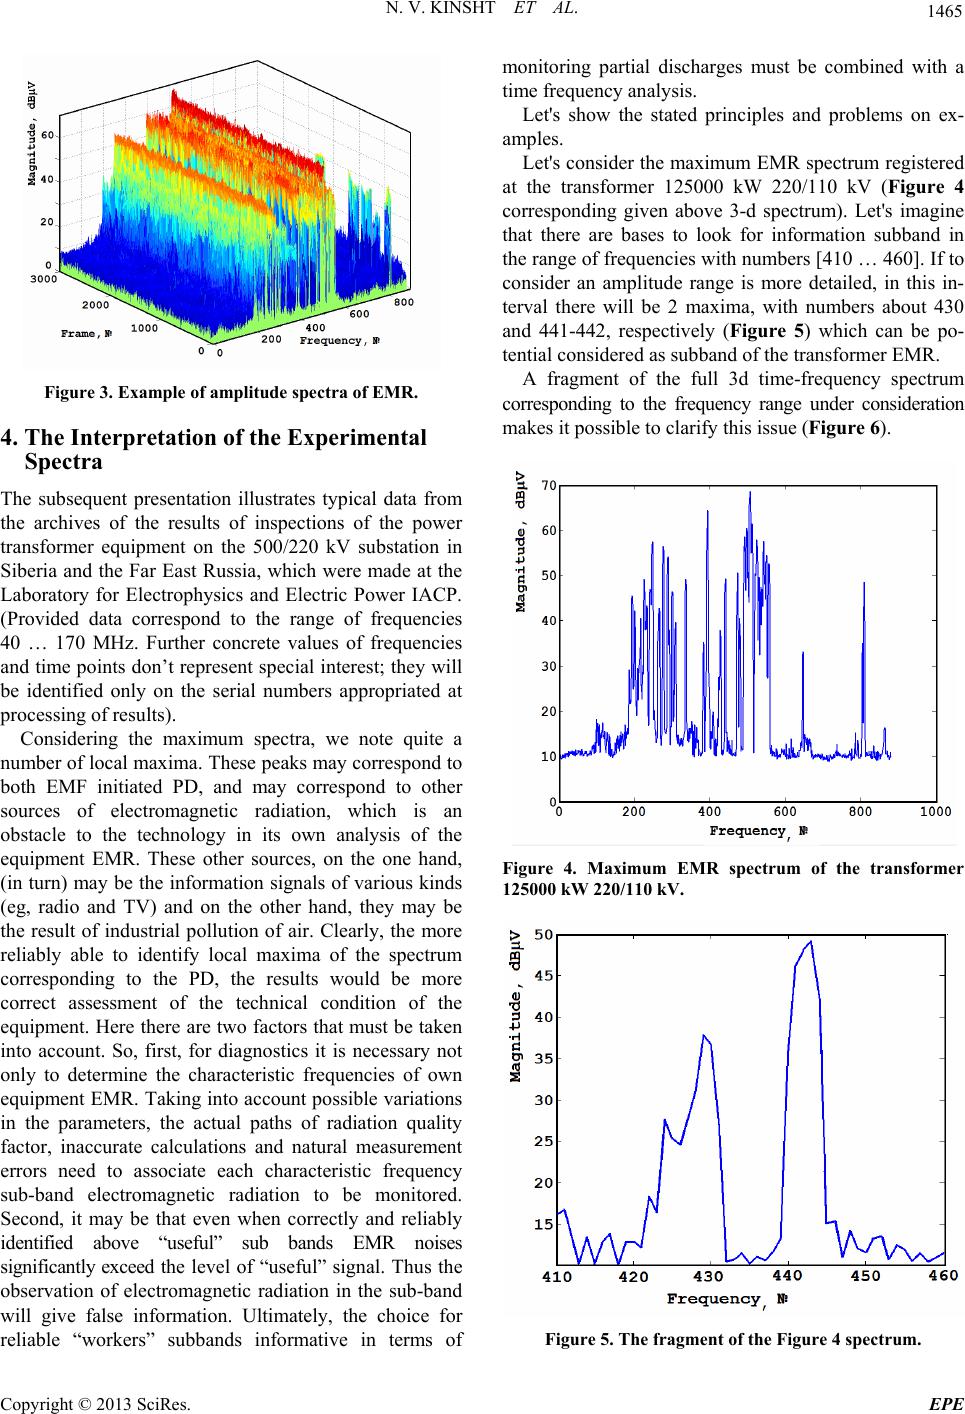 N. V. KINSHT ET AL. 1465 Figure 3. Example of amplitude spectra of EMR. 4. The Interpretation of the Experimental Spectra The subsequent presentation illustrates typical data from the archives of the results of inspections of the power transformer equipment on the 500/220 kV substation in Siberia and the Far East Russia, which were made at the Laboratory for Electrophysics and Electric Power IACP. (Provided data correspond to the range of frequencies 40 … 170 MHz. Further concrete values of frequencies and time points don’t represent special interest; they will be identified only on the serial numbers appropriated at processing of results). Considering the maximum spectra, we note quite a number of local maxima. These peaks may correspond to both EMF initiated PD, and may correspond to other sources of electromagnetic radiation, which is an obstacle to the technology in its own analysis of the equipment EMR. These other sources, on the one hand, (in turn) may be the information signals of various kinds (eg, radio and TV) and on the other hand, they may be the result of industrial pollution of air. Clearly, the more reliably able to identify local maxima of the spectrum corresponding to the PD, the results would be more correct assessment of the technical condition of the equipment. Here there are two factors that must be taken into account. So, first, for diagnostics it is necessary not only to determine the characteristic frequencies of own equipment EMR. Taking into account possible variations in the parameters, the actual paths of radiation quality factor, inaccurate calculations and natural measurement errors need to associate each characteristic frequency sub-band electromagnetic radiation to be monitored. Second, it may be that even when correctly and reliably identified above “useful” sub bands EMR noises significantly exceed the level of “useful” signal. Thus the observation of electromagnetic radiation in the sub-band will give false information. Ultimately, the choice for reliable “workers” subbands informative in terms of monitoring partial discharges must be combined with a time frequency analysis. Let's show the stated principles and problems on ex- amples. Let's consider the maximum EMR spectrum registered at the transformer 125000 kW 220/110 kV (Figure 4 corresponding given above 3-d spectrum). Let's imagine that there are bases to look for information subband in the range of frequencies with numbers [410 … 460]. If to consider an amplitude range is more detailed, in this in- terval there will be 2 maxima, with numbers about 430 and 441-442, respectively (Figure 5) which can be po- tential considered as subband of the transformer EMR. A fragment of the full 3d time-frequency spectrum corresponding to the frequency range under consideration makes it possible to clarify this issue (Figure 6). Figure 4. Maximum EMR spectrum of the transformer 125000 kW 220/110 kV. Figure 5. The fragment of the Figure 4 spectrum. Copyright © 2013 SciRes. EPE 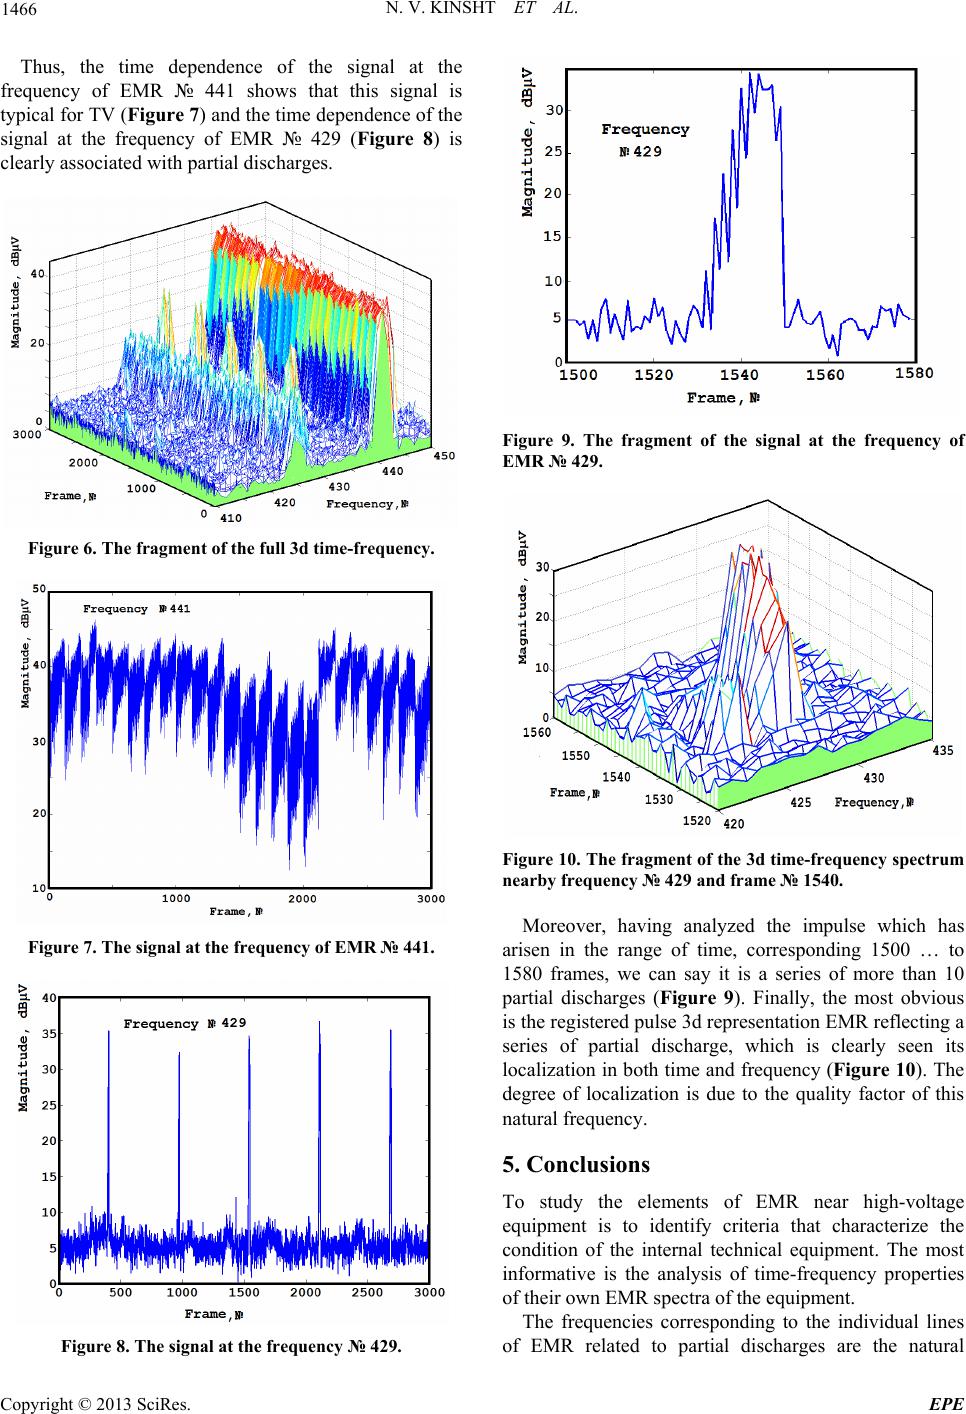 N. V. KINSHT ET AL. 1466 Thus, the time dependence of the signal at the frequency of EMR № 441 shows that this signal is typical for TV (Figure 7) and the time dependence of the signal at the frequency of EMR № 429 (Figure 8) is clearly associated with partial discharges. Figure 6. The fragment of the full 3d time-frequency. Figure 7. The signal at the frequency of EMR № 441. Figure 8. The signal at the frequency № 429. Figure 9. The fragment of the signal at the frequency of EMR № 429. Figure 10. The fragment of the 3d time-frequency spectrum nearby frequency № 429 and frame № 1540. Moreover, having analyzed the impulse which has arisen in the range of time, corresponding 1500 … to 1580 frames, we can say it is a series of more than 10 partial discharges (Figure 9). Finally, the most obvious is the registered pulse 3d representation EMR reflecting a series of partial discharge, which is clearly seen its localization in both time and frequency (Figure 10). The degree of localization is due to the quality factor of this natural frequency. 5. Conclusions To study the elements of EMR near high-voltage equipment is to identify criteria that characterize the condition of the internal technical equipment. The most informative is the analysis of time-frequency properties of their own EMR spectra of the equipment. The frequencies corresponding to the individual lines of EMR related to partial discharges are the natural Copyright © 2013 SciRes. EPE  N. V. KINSHT ET AL. Copyright © 2013 SciRes. EPE 1467 frequencies of the transformer. 6. Acknowledgements This work was supported by Russian Foundation for Basic Research (grant N13-08-00924) REFERENCES [1] International IEC Standard 60270-2000. [2] N. V. Kinsht and M. A. Katz, “Some Problems of the Partial Discharge Burning Time,” TEEM, Vol. 7, No. 6, 2006, pp. 319-323. [3] N. V. Kinsht and N. N. Petrun'ko, “The Experience of Inspection of a Technical Condition of the HV Equipment on Substations by a Method of Registration of the Own Electromagnetic Radiations,” in Proceedings of CMD2008, 2008, pp.738-740. [4] N. V. Kinsht and N. N. Petrun'ko, “Research on Charac- teristics of EMR of the High-Voltage Equipment during the Process of its Diagnostic,” in Proceedings of CMD2010, 2010, pp. 1149-1152. [5] N. V. Kinsht and N. N. Petrun'ko, “Interpretation of Monitoring Dataof Own Electromagnetic Radiation HV Transformers” in Proceedings of CMD2012, 2012, pp 569-572.http://www.samgor.com/pdf/IEC60270.pdf. [6] http://www.doble.com/litlib/files.html/download/395 |