 Open Journal of Earthquake Research, 2013, 2, 91-105 Published Online November 2013 (http://www.scirp.org/journal/ojer) http://dx.doi.org/10.4236/ojer.2013.24010 Open Access OJER Analysis of the Low-Energy Seismic Activity in the Southern Apulia (Italy) Pierpaolo Pierri1, Salvatore de Lorenzo1, Gildo Calcagnile1,2 1Dipartimento di Scienze della Terra e Geoambientali, Università degli Studi di Bari “Aldo Moro”, Bari, Italy 2Osservatorio Sismologico, Università degli Studi di Bari “Aldo Moro”, Bari, Italy Email: pierpaolo.pierri@uniba.it, salvatore.delorenzo@uniba.it, gildo.calcagnile@uniba.it Received September 20, 2013; revised October 25, 2013; accepted November 8, 2013 Copyright © 2013 Pierpaolo Pierri et al. This is an open access article distributed under the Creative Commons Attribution License, which permits unrestricted use, distribution, and reproduction in any medium, provided the original work is properly cited. ABSTRACT In this paper we analysed the historical and instrumental seismicity of the seismic district “Penisola Salentina” (Salento peninsula) in the southern part of the Apulia region, making use of the most recent seismological database. Relocation of available dataset points out that the events are spatially distributed over a belt of deformation that approximately corresponds to Soglia Messapica (Taranto-Brindisi depression). Besides, computed source characteristics indicate dex- tral strike-slip solutions with an approximately E-W orientation that seismologically confirm previous geodynamic studies indicating a NE-SW extension in the Taranto-Brindisi depression. In particular, the tensional stress associated to the present seismic activity could be the consequence of the relaxation of the buckling process following the extensional re-arrangement of the Apenninic belt masses. Moreover attenuation QP values obtained in this study are much greater than those inferred in other parts of Italian peninsula; this result agrees with previous macroseismic investigations and indicates a greater efficiency of the studied area in the transmission of body waves. Keywords: Salento Peninsula (Southern Italy); Seismicity; Focal Mechanisms; Source Parameters 1. Introduction The Apulian region stretches for about 350 km in the southern part of Italy, between the Adriatic and Ionian Sea. It is constituted by an emerged sector of the Apulian plate [1] or Adriatic subplate [2] or Adria [3], character- ized by a relatively thick lithosphere [4] and by a weakly deformed sedimentary cover [5]. This plate, which shows a marked elongation from NW to SE, represents the Plio-Pleistocene foreland (Apulian foreland) of the Southern Apennine orogenic system to west and of the Dinaric and Hellenic chains to east, generated along its boundaries by the interaction with more deformable lithospheric structures. These re- gions are affected by diffuse seismicity whose character- istics are correlated to a general counter-clockwise mo- tion of Adria [6,7] (Figure 1). The internal part of Adria shows a minor, but not neg- ligible, seismic activity [8,9]; in particular this region is near to different areas in which seismicity is frequent and intense; for example the Salento peninsula is less than 100 km far from Albanian and Greek coasts where many energetic earthquakes occurred. Besides the propagation characteristics of the lithosphere of the foreland permit to the energy irradiated by hypocenters distant a few hun- dreds of kilometres of arriving into the Salento peninsula only weakly attenuated, as demonstrated from felts of Albanian and Greek earthquakes [10,11] and from mac- roseismic field of recent earthquakes (e.g. 8 January 2006, 3 February 2007, 25 March 2007). The southern part of Apulia has been generally con- sidered practically aseismic [12]. The seismic history of Salento peninsula shows that only one event of magni- tude higher than 6.0 is reported in the historical cata- logues, killing hundreds of people, in particular in the town of Nardò and Francavilla Fontana: this earthquake, which occurred on 20 February 1743, caused damage maximum effects of IX-X degree on the Mercalli-Canca- ni-Sieberg scale (MCS) and also a tsunami [13], with boulder accumulations along the Otranto-Leuca coast [14]; it has been felt in an abnormally wide area, from Greece, Albanian, Malta to northern Italy; its magnitude was in the range 7.13 ± 0.19 [15]. It is affected by remark- able uncertainty in the location, but most likely occur- red south of the Salento Peninsula (Apulian Ridge), in the 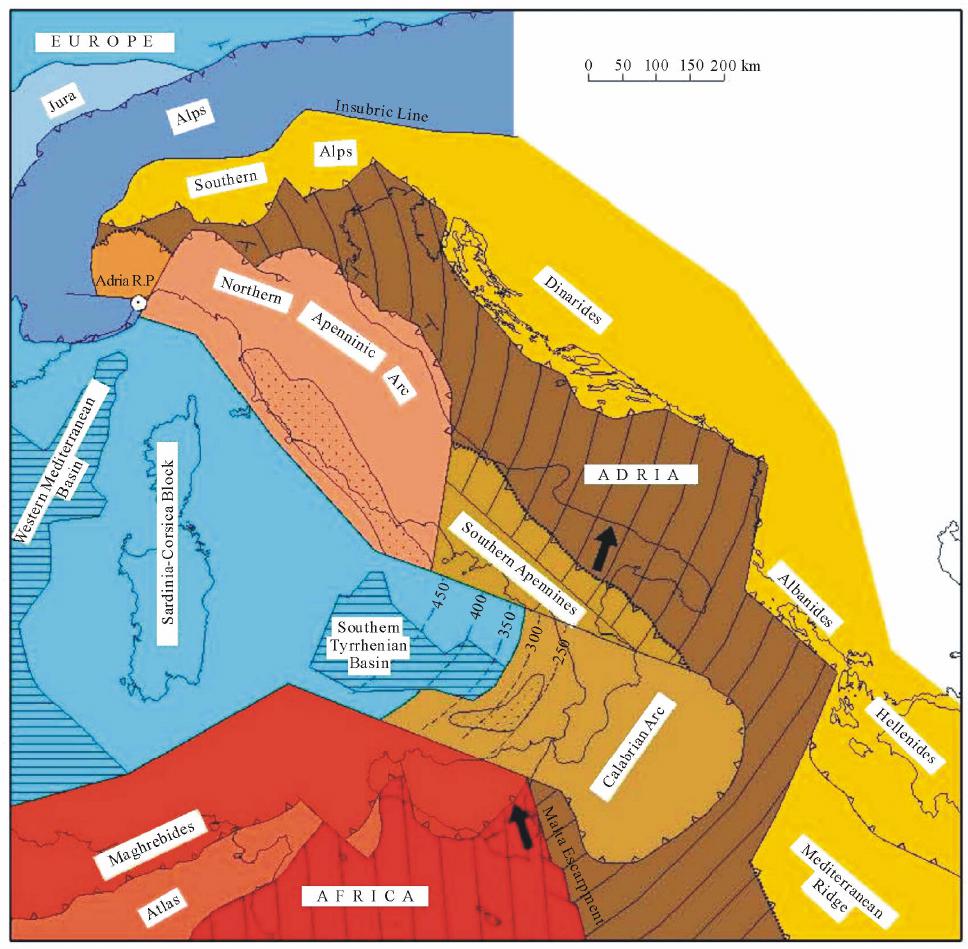 P. PIERRI ET AL. 92 Figure 1. Structural sketch of Italy and surrounding areas [6]. Black arrows indicate the slip vectors of Africa vs. Europe and of Adria vs. Europe obtained from geodetic data. Adria RP is the Adria rotation pole. same area where there have been several other recent earthquakes (e.g. 20 October 1974, 23 November 1974). According to Argnani et al. [16] the main triggering fac- tor is the local stress accumulation due to the small ra- dius of curvature of the Adriatic-Apulian plate under the double load of the Hellenides and Apennines-Calabrian arc. This event has been studied in detail by Galli and Naso [11]: it seems that the highest intensities in Salento peninsula have been controlled by local amplification (double resonance) that occurred in all localities charac- terized by thin Pleistocene basins filled with soft sedi- ments, such as Nardò, Francavilla Fontana and Leverano. The depth of the seismogenic source (30 - 40 km), its directivity effects (toward Salento, in NW-SE direction) and the strong site amplification were considered the reasons of both the large areal distribution of effects and the locally high gravity of damages causing the devas- tating shaking [11]. The occurrence of strong earthquakes in this area is also suggested by Pieri et al. [17], considering the sparse occurrence of seismites in the Tyrrhenian deposits along the Adriatic-Apulian coast; besides additional data on the Open Access OJER 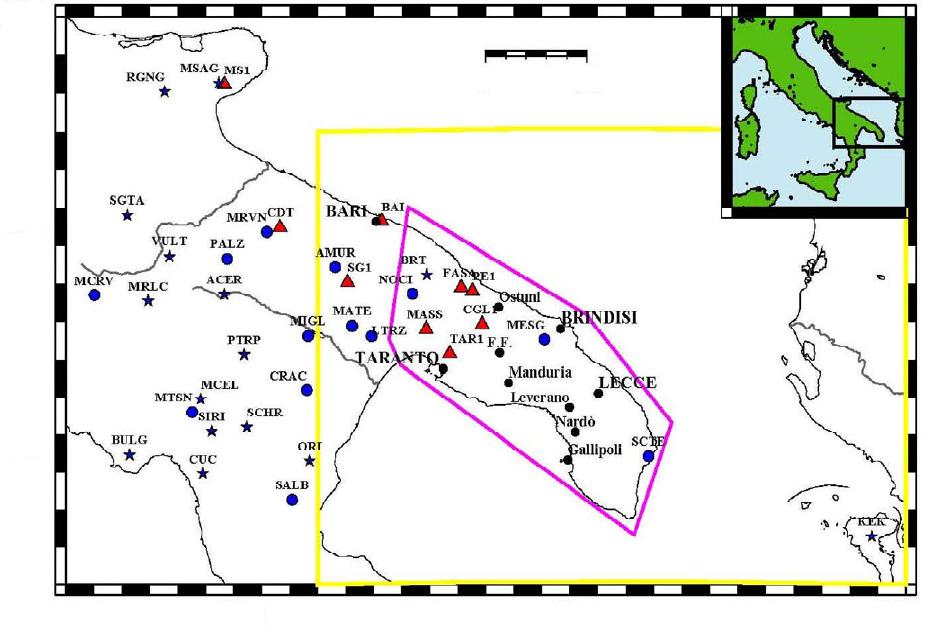 P. PIERRI ET AL. 93 possible presence of a strong seismic activity that would affect the Salento peninsula have been put forward on the basis of geomorphological (e.g. through the study of speleothems and tsunami traces) and archaeological evi- dence (recent excavations have revealed the possible origin of collapse of walls). The seismic activity inside Salento peninsula is almost absent or of low-energy and therefore it is rarely re- corded, due to the lack of seismic stations (until about 15 years ago the “Istituto Nazionale di Geofisica e Vulca- nologia” (INGV—Rome) managed only 2 stations in an area more than 5000 km2). In the last years, four seismic stations were implemented in the southern-central part of Apulia region and added to the network managed by the “Osservatorio Sismologico dell’Università di Bari” (OSUB). The recordings of this network, in conjunction with those of the Italian National Seismic Network (RSNC), operated by the INGV, allowed detecting sev- eral low-energy events, such as those occurred on 5 May, 2012 near Ostuni and felt by many inhabitants, of local magnitude ML 2.8. In this paper we present an analysis carried out on this earthquake and on other events located in the seismic district named “Penisola Salentina” (Figure 2). The main goals of this work are: 1) relocation of the recorded events with Vp/Vs computation using a modified Wadati method; 2) focal mechanisms computation; 3) determina- tion of source (corner frequency, source dimension, seismic moment and stress drop) and attenuation (quality factor) parameters. The geographical position of the most important lo- calities of the studied area and the seismic stations (be- longing to OSUB and INGV network), considered in the revision of instrumental seismicity, are shown in Figure 2. 2. Geological Setting The studied area is located in the southern part of the Apulian region, stretching between the Ionian and the Adriatic Sea (Figure 2). This region is the emerged part of the foreland domain of both Apenninic and Dinaric orogens; it constitutes a Variscan basement covered by a 3 - 5 km thick Mesozoic carbonate sequence and is over- lain by thin deposits of Tertiary and Quaternary age. The Apulian foreland is weakly deformed and affected by 42˚N 17˚E 0 50 km 41˚N 40˚N 16˚E 15˚E 18˚E 19˚E 20˚E Figure 2. Geographic location of the study area with the seismic stations used in the relocation. Red triangles represent the stations of OSUB network, while blue circles indicate the stations of INGV network. The yellow rectangle is the area selected for the extraction of seismic events shown in Figure 4; the fuchsia line encompasses the “Penisola Salentina” seismic district. eographical position of some localities mentioned in the paper is also shown (F.F. indicates Francavilla Fontana). G Open Access OJER 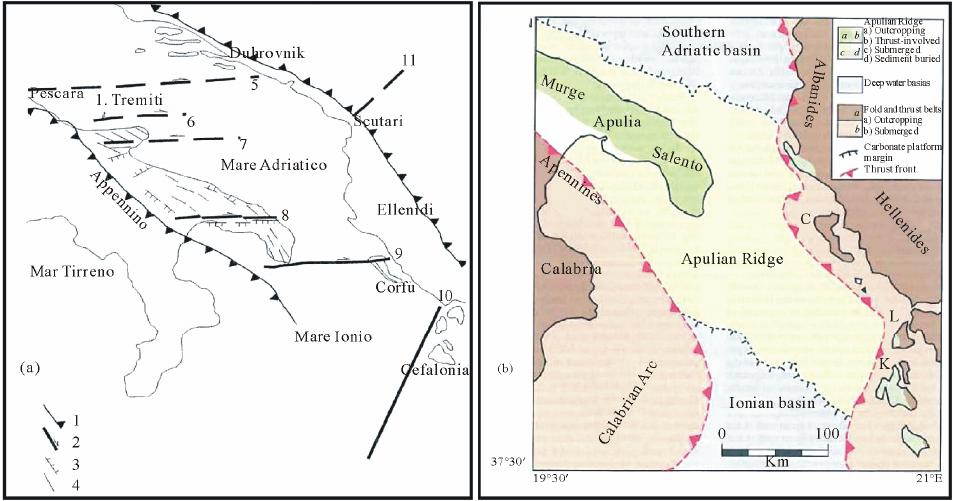 P. PIERRI ET AL. 94 Apenninic and anti-Apenninic trending faults which sub- divide it into five main structural blocks with different uplift rates (from NW to SE Gargano, Tavoliere, Murge, Taranto-Brindisi plain and Salento peninsula). The Salento peninsula and the Murge block are sepa- rated by the so-called “Soglia Messapica” [17], also named Taranto-Brindisi depression [5], which is a high scarp, mainly oriented E-W; the relationship between Salento and Murge is complicated by their different rota- tions [18] and by strike-slip movements along their boundary (Figure 3(a), North and South Salento Fault Zone by Gambini and Tozzi [19]). Normal faults, with trend NW-SE, are present in both the Salento peninsula and the Salento plateau, repre- sented by the “Apulian Ridge or Swell” [16,20] (Figure 3(b)); these faults, active in Plio-Pleistocene, almost transversal to the strike-slip fault in which occurred en- ergy transfer, dissect the large antiform structure due to the different regional uplift and the Pleistocene deposits, witnessing a tectonic activity in Quaternary. The Apulian Ridge is a morphological element that separates the deep Ionian basin from the shallower Southern Adriatic basin, extending from Salento peninsula to the island of Kefal- linia. 3. Data Selection All the events located in the area having a latitude be- tween 39.5˚ and 41.5˚N and a longitude between 16.5˚ and 20.0˚E in the period 2003-2012 were extracted from the Bulletin of the Instrumental Seismicity (http://bollettinosismico.rm.ingv.it/) and from the Italian Seismic Instrumental and parametric Data-basE (ISIDE) (http://iside.rm.ingv.it) of INGV. These events are distributed over the southern Apulia and surrounding regions. In Figure 4 the 743 extracted events, subdivided in 9 “seismic districts” (or epicentral regions), are shown; the districts where the highest num- ber of events occurred are “Murge” (273) and “Penisola Salentina” (163). However this map may be severely biased by the re- cording of quarry blasts. It has been in fact shown [21] that many of these events were caused by artificial ex- plosions. This observation is supported by both the dis- tribution of the events with respect to the day of occur- rence and to the hour of occurrence. In this paper we considered the seismic activity oc- curred inside the district named “Penisola Salentina”, where 163 earthquakes were located with a maximum magnitude ML = 2.8. Owing to the poor coverage of INGV stations in this area, some low-energy events were not detected by the INGV network. As an example, the events occurred on 6 August, 2012 (at 23:14 GMT) and on 6 September, 2012 (at 04:48) were detected only by OSUB stations. Figure 3. (a) Structural map of the Apulian foreland [19, simplified]: 1) Front of the external Calabrian Arc; 2) main strike-slip faults (the arrows indicate the movement versus); 3) main extensional faults; 4) other fault alignments; 5) Pescara- Dubrovnik fault; 6) Tremiti fault; 7) Mattinata fault; 8) North-Salento fault; 9) South-Salento fault; 10) Kefallinia fault; 11) Scutari fault. (b) Geological setting of the study area [16]: the Apulian Ridge (or Apulian Swell) represents the foreland of the Apennines and Hellenides fold and thrust belts. With C, L e K are indicated Corfu, Lefkas and Kefallinia Island. Open Access OJER 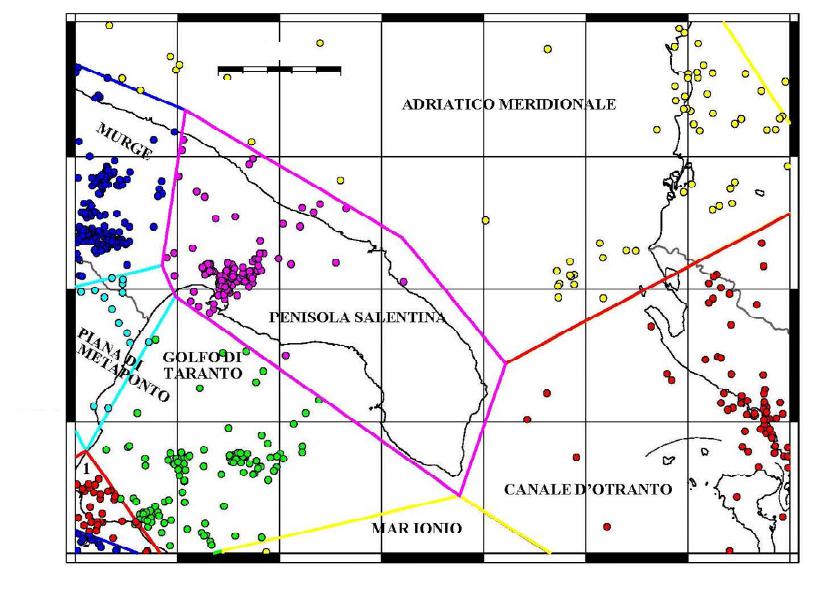 P. PIERRI ET AL. 95 17˚E 0 50 km 41˚N 40˚N 18˚E19˚E20˚E Figure 4. Map of instrumentally detected earthquakes of the Southern Apulia and surrounding regions extracted from the INGV on-line bulletins between 2003-2012. The 743 epicentres are localized in 9 seismic districts (1 and 2 represent the seis- mic districts “Piana di Sibari” and “Sila” in the SW corner). The southern and central part of Apulia is historically characterised by low seismicity [8]. Figure 5 shows the spatial distribution of historical earthquakes extracted from the last version of the Parametric Catalogue of Ital- ian Earthquakes (CPTI11) [15], which covers the period 1000-2006; Table 1 lists a few events located in “Peni- sola Salentina” seismic district or very close, including the instrumental (ML = 5.3) earthquake occurred in 1983 near Gallipoli (see Figure 2). In this catalogue the strong event occurred in 1743 is located (on macroseismic base obviously) offshore the southern-eastern Salento coast (at about 50 km), on the Salento plateau, in the ZS931 (named Otranto Channel) of the ZS9 seismogenic zonation [22], near well located epicentres of other earthquakes (Figure 5). Besides, analyzing the CFTI4Med catalogue [23] other 25 earthquakes located in the examined area occurred in XX century with M ≥ 3.0; it is important to stress that the strong earthquake occurred in 1743 is relocated in Salento peninsula, about 20 km north of Gallipoli (grey star in Figure 5). The seismic activity reported in the catalogue PFG [24] is also shown in Figure 5: this catalogue (which covers the period 1000 - 1980) contains 170 earthquakes oc- curred in the extraction area, of which 47 earthquakes with I ≥ VI MCS; several events are not present in the other 2 catalogues, for example the earthquakes occurred on 10 October, 1858 near Brindisi (I = VI MCS, M = 4.1) and 26 April, 1970 in the Ionian Sea (I = VII MCS, M = 4.6). On the whole, the existing pre-instrumental seismicity indicates the occurrence of many events of low magni- tude (M ≈ 4.0) in Southern Apulia. The spatial distribution of instrumentally located events, extracted from the CSI catalogue [25] in the pe- riod 1981-2002, has been also analysed; the seismicity is present everywhere in all the districts, although, consid- ering only the events with M ≥ 3.0, cluster of events can be noted, for example in the area near Lecce. Since data relative to these years and to “Penisola Salentina” seis- mic district are rather poor and with a remarkable uncer- tainty on the phase readings, we re-analysed the instru- mental seismicity only in the period 2003-2012. 4. Discrimination between Tectonic Earthquakes and Quarry Blasts The concentration of events near Taranto (Figure 4) is mainly due to an anthropic activity (explosions). We con- sidered the approach of Wiemer and Baer [26] to analyse Open Access OJER 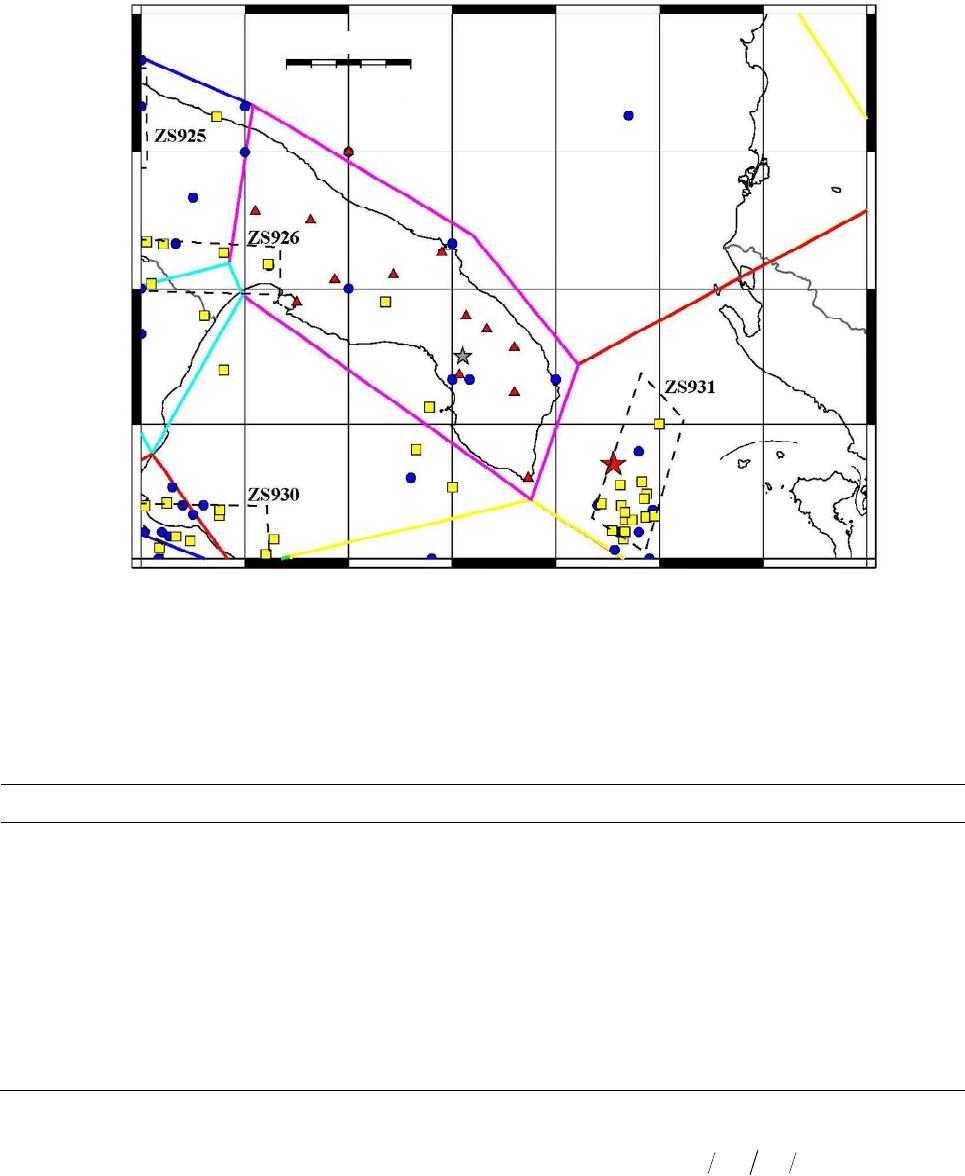 P. PIERRI ET AL. 96 17˚E 0 50 km 41˚N 40˚N 18˚E19˚E20˚E Figure 5. Map of historical detected (red circles and blue triangles for events with M ≥ 3.0) earthquakes of the Southern Apulia and surrounding regions extracted from the CPTI11 [15] (yellow squares), PFG catalogue with Imin ≥ VI MCS [24] (blue circles) and CFTI4Med catalogues [23] (red triangles) respectively. Red and grey stars indicate the epicentre of the 1743 earthquake located from CPTI11 and CFTI4Med respectively. The delimitation and the number of the seismogenic zones according to the ZS9 [22] (dashed lines) is reported. The boundaries of 9 seismic districts are shown. Table 1. List of historical earthquakes extracted from the Parametric Catalogue of Italian Earthquakes [15] occurred in the “Penisola Salentina” seismic district or very close to it. See Figures 2 and 9 for locations. Date Or. Time Lat. N Long. E Mw Imax Location 1087/09/10 - 41.128 16.864 4.93 VI-VII Bari 1713/01/03 - 40.589 17.113 4.51 VI-VII Massafra 1826/10/26 18 40.451 17.678 5.36 VI-VII Manduria 1932/03/30 09:56 40.633 16.900 4.80 VI Castellaneta 1983/05/07 22:09 40.062 17.890 4.96 - Gallipoli 1983/11/08 20:11 39.907 17.825 4.56 - Pen. Salent. 2001/09/23 21:16 39.767 18.001 4.96 - Pen. Salent. the frequency distribution of the events. It is known that dividing the number of events occurred in working hours (generally between 08:00 a.m.-04:00 p.m. for mining activity) or days (from Monday to Friday) by the number of events recorded in not-working hours (00:00 a.m.- 08:00 a.m. and 04:00 p.m.-00:00 a.m.) or days (Saturday, Sunday or holiday) the indicator Rq can be computed [26]: dn dn RqNNL L (1) Nd is the number of events recorded in diurnal hours, Nn is the number of events recorded in night hours and the term Ld/Ln is a normalization factor equal to the ratio between the number of diurnal and night hours (for hy- Open Access OJER 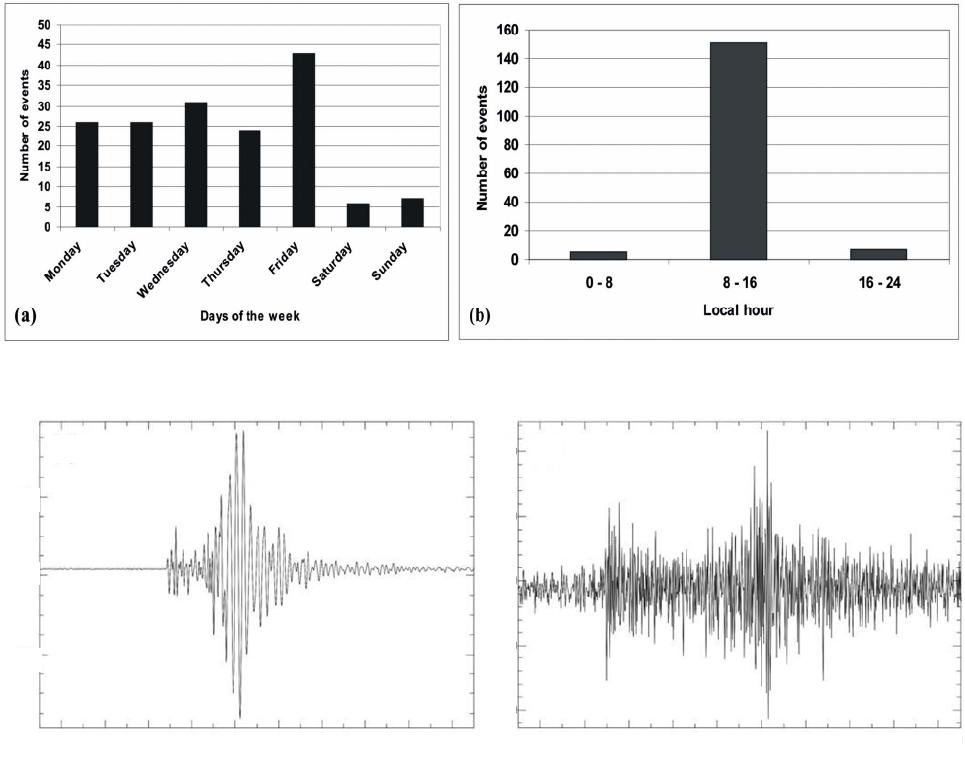 P. PIERRI ET AL. 97 pothesis 8 and 16 respectively). It has been shown that Rq is equal to unit in areas where are recorded only tec- tonic events, whose occurrence is clearly casual at any time or day, while anomalous values (>> 1) are obtained if also quarry explosions are present (effectuated usually between 08:00 a.m.-04:00 p.m.). In our case we inferred Nd equal to 151, Nn equal to 12, and therefore Rq ≈ 25; this result indicates that the major part of recorded events is represented by quarry blasts. This outcome is supported by the histograms represent- ing the distribution of the number of the events versus daytime and weekday (Figure 6), where the anomalous distribution, having a minimum on Saturday and Sunday and in intervals of not-working hours, is inferred. It is, however, highly probable that not all 151 diurnal events are due to quarry explosions, but the attention has been paid only to events surely of tectonic origin, very often easily distinguishable by the simple inspection of waveforms and by spectral analysis. It’s important to remember that exist a guideline for the discrimination of earthquakes from mine explosions on the web (http://earthquak e.usgs.g ov/earthqu akes/eqarchives/mine blast/evidence.php); a typical feature of explosion seis- mograms is the envelope with a “fish-like” shape (Fig- ure 7(a)), P-onset emergent with only compressive po- larity, lack of a clear S wave signature (the secondary phase is due to converted phases), magnitude less than 2.0, and waveforms very different from those of tectonic events (Figure 7(b)). Among the 151 diurnal events, an earthquake surely of tectonic origin, as suggested from different location and magnitude respect to classical “anthropic” events and as confirmed from waveform analysis (with some tensional polarities), is the event occurred on 13 May, 2011 in working time (06:21 GMT-08:21 local time) and day (Friday); it was one of the most energetic events, felt by the population. Adding other 9 events occurred in not working-days Figure 6. Distribution of the 163 “Penisola Salentina” events in the period 2003-2012 (a) versus days of the week and (b) three local hour intervals. 0 5 10 15 20 time (s) 0 510 15 20 time (s) 50 100 150 200 250 (b) 2000 2000 0 (a) TAR1 BHZ JUL 20 (201), 2007 12:16:16.000 TAR1 BHZ JUL 20 (201), 2007 04:29:25.000 Figure 7. Comparison between the waveform of (a) an anthropic event (quarry blast) and (b) a tectonic earthquake recorded at TAR1 station on 20 July, 2007 at 12:16:22 and at 04:29:29 (ID 6 in Table 2) respectively (GMT hour). Open Access OJER 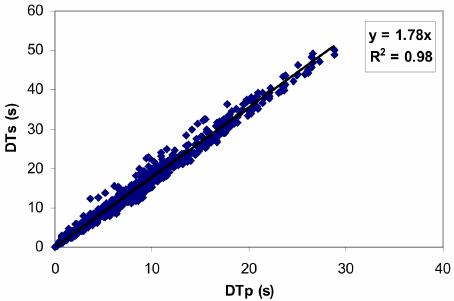 P. PIERRI ET AL. 98 (but in working hours), the resultant dataset includes 22 events. 5. Event Relocation First of all, we estimated the average Vp/Vs ratio, re- quired by the program HYPOELLIPSE [27]. In the de- termination of this ratio we required that the following three criteria were jointly satisfied by each earthquake: at least 5 stations, 8 phases and 2 OSUB phases. The last criteria is fundamental to better constrain the solution using the nearest stations. Based on these rules, about 700 phases of 14 earthquakes have been included and 8 earthquakes have been excluded (ID number 1, 2, 8, 10, 11, 12, 13 and 14 in Table 2), despite an accurate re-picking of their arrival times for both the INGV and the OSUB stations. In any case we relocated all 22 se- lected earthquakes, with maximum local magnitude equal to 2.8, using only data of stations having epicentral dis- tance up to 200 km, giving the maximum weight to sta- tions placed within 100 km. The Vp/Vs ratio was estimated by using a modified Wadati method [28]. In this method the average Vp/Vs ratio is equal to DTs/DTp ratio, where DTs and DTp are the time difference between phases Si and Sj and Pi and Pj in two stations i and j; the slope of the least square fit of DTs versus DTp for all available pairs of stations (Fig- ure 8) gives the value of the slope Vp/Vs (1.78 with a linear correlation coefficient of 98 %). For the choice of a local velocity model, trials were made adopting different models: the best results, in terms of minimum RMS and error ellipsoid, were obtained (considering whether 14 or 22 events) with the model OSUB (reported in [8]) which was definitely assumed in all the following processing. Compared to the locations provided by the INGV (214 arrival times) without the OSUB stations, relocations have an average RMS and azimuthal gap smaller (from Figure 8. Wadati diagram with average Vp/Vs ratio ob- tained (1.78) using linear least squares method. Linear cor- relation coefficient is equal to 98%. 0.43 s to 0.29 s and, respectively, from 245˚ to 218˚); in our study we exploited 324 phases. The accuracy in the location of events is about 2 km for the epicentral coordinates and about 5 km for the fo- cal depth; it becomes better for the most recent events, owing to the implementation of 3 seismic stations (CGL1, MASS, FASA) in the period October, 2010 December, 2010. As an example, for the event occurred on 11 May, 2008 the minimum source to receiver distance is almost 60 km (see Dmin in Table 2), while the minimum distance becomes about 15 km for the events of 2011-2012. As expected, almost all discarded events have rather high errors. The depths of hypocentres, about 15 km on the aver- age, indicate that this activity is located within the crys- talline basement and in the deepest part of the upper crust. The distribution of the relocated epicentres is rather sparse, but roughly follows an E-W striking trend that corresponds to Soglia Messapica (Figure 9). 6. Focal Mechanisms Since the earthquakes recorded in the “Penisola Salen- tina” seismic district have a low magnitude (ML ≤ 2.8), it is difficult to collect enough data for the determination of focal mechanisms; therefore fault plane solutions were computed only for three events (ID 9, 19, 21) having at least eight clear observations. We used FPFIT [29] to infer focal mechanisms. The velocity model used for the computation of the azimuths and take-off angles is the same as that used for the location of events. In all cases both the low number of seismic stations (the average number of polarities per event is 11) and their spatial distribution does not allow to obtain well constrained fault plane solutions. For all the events, the best provided solution (Figure 10 and Table 3) shows for the pressure axis P a trend of about 300˚ and a plunge of about 30˚, whereas the tension T axis has a trend of about 45˚ (NE-SW direction) and a plunge of 20˚. All events reveal strike-slip faulting mechanisms along E-W striking planes and in particular the best constrained mechanism of the 5 May, 2012 earthquake is well repre- sentative of this kind of solution. Due to the limited number of polarities and the eastern network gap (Adriatic Sea area) the reliability of the fault plane solution is not fully assessed. However the score of correct polarities is rather high (equal to 100% for the third event) and the uncertainty is very low for strike and dip of the two nodal planes (<15˚), whilst the uncertainty is rather high for the rake (in two cases > 20˚) even if it is worth noting that the fault plane solutions carried out remain approximately the same. For other events occurred in the “Penisola Salentina” Open Access OJER 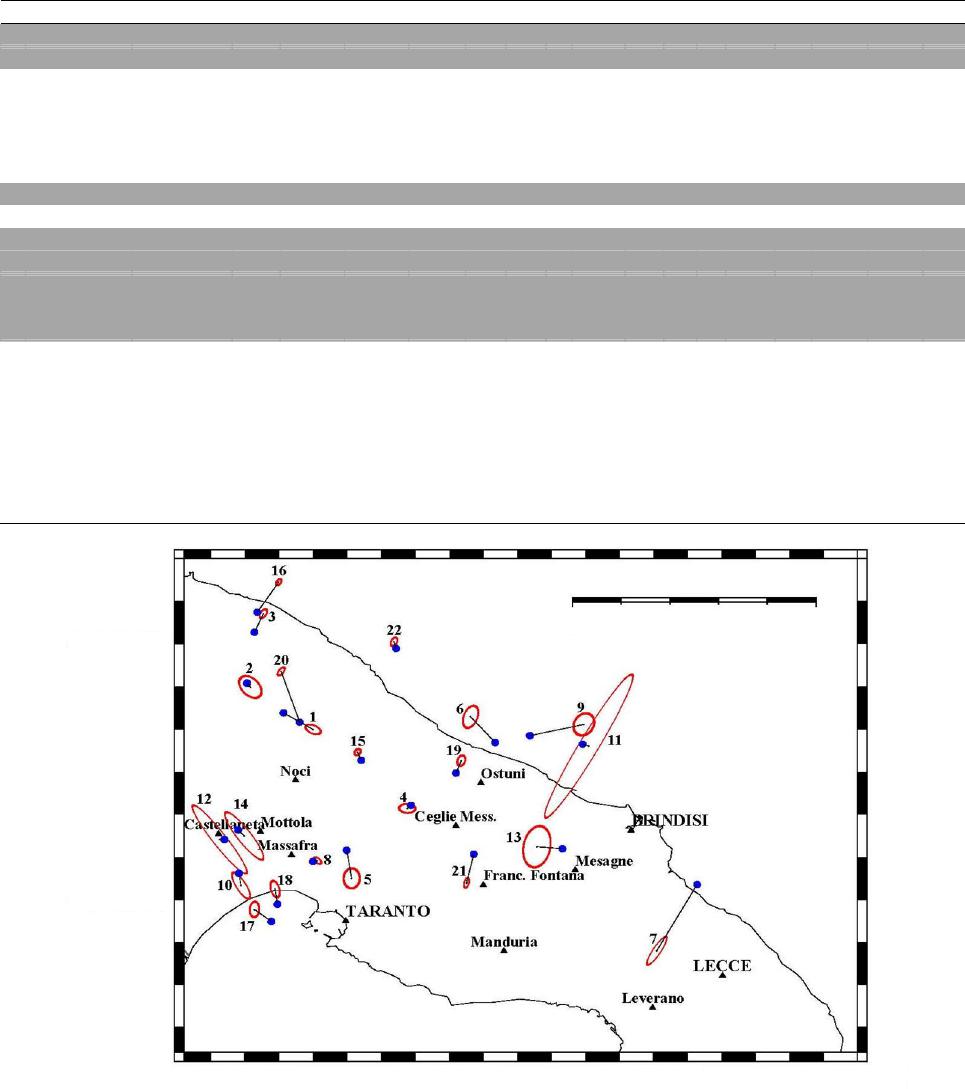 P. PIERRI ET AL. 99 Table 2. List of instrumentally earthquakes located from INGV in the “Penisola Salentina” seismic district and relocated in this study. ID = identification number. Time is the earthquake origin time (UTC). In the column “Days” H represents holiday, while days are numerated from 1 (Monday) to 7 (Sunday). Depth is the earthquake depth (fixed when marked as *). Nd1 and Nd2 represent the number of used phases of the OSUB and INGV stations. Ns is the number of used stations. Dmin is the minimum distance (in km). Md and Ml are the duration magnitude and the local magnitude (taken from INGV Seismic Bul- letin). The 8 events highlighted in grey have been excluded in the estimate of the Vp/Vs ratio. ID Date Time Days Lat. N Lon. EDepthNd1Nd2NsDminGapMdMlRMS AZ SEH1 SEH2SEZ 1 2005/08/29 15:05:54.2 1 40.833 17.1665.0* 0 6 34.7 2581.71.40.14 −66 1.7 0.9 2.1 2 2006/01/06 10:21:25.9 H 40.916 17.01310.90 5 312.32041.91.10.13 −43 2.8 1.8 6.6 3 2006/01/21 09:14:10.9 6 41.059 17.04410.17 6 714.92011.91.60.25 33 1.1 0.6 2.6 4 2006/04/23 07:55:07.7 7 40.679 17.3977.8 6 6 613.72031.91.30.38 −87 1.7 1.0 5.2 5 2007/04/10 15:05:31.8 2 40.542 17.26010.55 6 62.4 1442.21.60.41 1 2.2 1.7 2.9 6 2007/07/20 04:29:21.2 5 40.858 17.55215.25 8 712.92902.21.90.30 21 2.5 1.4 1.2 7 2007/12/23 11:53:35.8 7 40.400 18.00825.46 141153.41642.82.50.40 33 3.6 0.8 1.7 8 2008/04/30 14:22:58.5 3 40.577 17.17711.80 6 325.32982.01.60.07 −48 0.9 0.5 1.9 9 2008/05/11 23:03:13.2 1 40.843 17.8308.0 5 191758.1303/2.60.39 30 2.5 2.0 7.4 10 2008/10/16 15:19:21.5 4 40.528 16.9905.0* 0 6 316.72871.61.10.16 −31 3.3 1.0 14.5 11 2009/08/23 10:15:14.6 7 40.801 17.8414.3* 0 6 323.62372.22.00.51 30 18.2 2.0 99.0 12 2009/11/15 05:07:50.4 7 40.619 16.9372.5 0 5 310.12311.50.70.21 −37 9.2 1.4 65.9 13 2010/04/30 19:32:46.1 5 40.604 17.7152.1 0 8 458.73402.11.60.35 11 4.6 2.8 99.0 14 2010/05/14 03:53:16.6 5 40.625 16.9983.7 0 6 315.32441.41.10.36 −37 6.4 1.4 34.6 15 2010/09/11 02:47:25.1 6 40.789 17.2758.0 7 6 7 12.11262.01.60.23 40 0.8 0.6 2.9 16 2010/10/31 07:16:19.8 7 41.120 17.0823.5 8 141317.12252.22.10.19 32 0.8 0.5 8.8 17 2011/05/07 13:19:53.0 6 40.481 17.02322.64 6 719.72281.81.10.22 4 1.7 1.0 3.1 18 2011/05/07 13:40:21.8 6 40.521 17.07312.74 8 8 13.91651.71.00.40 −16 1.9 0.9 5.7 19 2011/05/13 06:21:29.8 5 40.772 17.52918.715191813.81782.52.30.38 20 1.2 0.8 0.8 20 2011/09/25 01:54:57.5 7 40.946 17.0889.5 128 1017.61672.21.40.34 38 1.0 0.5 3.4 21 2012/05/05 12:44:03.9 6 40.533 17.5427.3 14382914.799-2.80.43 15 1.1 0.5 3.3 22 2012/12/22 19:31:28.2 6 41.004 17.36523.6128 1020.9212 -2.10.27 26 1.0 0.6 1.8 41˚00'N 41˚30'N 17˚30'E 17˚00'E 18˚30'E 18˚00'E 050 km Figure 9. Events re-located in the “Penisola Salentina” seismic district with representation of the error ellipse estimated for each location (with ID number). In blue the INGV location is shown. Geographical position of main localities mentioned in the paper is also shown. Open Access OJER 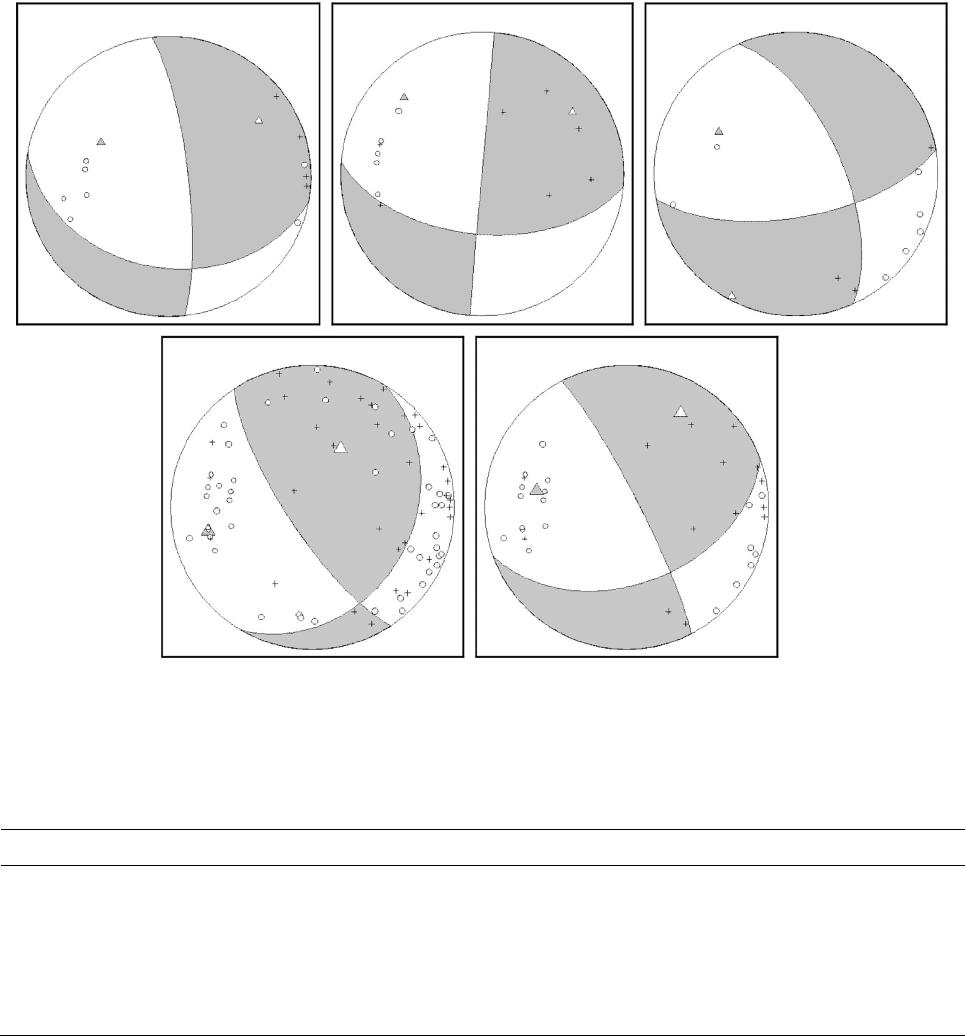 P. PIERRI ET AL. 100 20080511 2011051320120505 Composite 12 ev. - 79 pol. Composite 3 ev. - 34 pol. Figure 10. Focal mechanisms calculated with the code FPFIT [29] for three events (11 May 2008, 13 May 2011, 5 May 2012) and for the composite solution (two different tests): white and grey triangles mark the T and P axes, white circles and small crosses represent dilatational and compressive first arrivals. Table 3. “Penisola Salentina” fault plane solutions carried out for the 3 major events and 2 composite solutions (A and B): strike (S), dip (D) and rake (R) of a nodal plane, score polarities (ratio between correct and total polarities), trend and plunge of P and T axes. ID Date S D R Score polarities P-axis tr. P-axis pl. T-axis tr. T-axis pl. 9 2008/05/11 100 35 −160 10/11 = 0.91 297 46 58 26 19 2011/05/13 95 55 −180 11/13 = 0.85 314 24 56 24 21 2012/05/05 80 65 −150 10/10 = 1.00 299 38 208 1 A 13 events 30 30 150 56/79 = 0.71 257 26 26 52 B 3 events 70 45 −170 28/34 = 0.82 281 36 30 24 seismic district (very probably originated from the same fault system) it has not been possible to infer stable esti- mates of the focal mechanism owing to the small number of available polarities. To overcome this limitation a composite fault plane solution has been obtained by combining the P-onset polarities of these events. Some tests with different number of polarities (including or excluding groups of polarities belonging to events with the highest errors of relocation) have been carried out: in Figure 10 and Table 3 the two most opposite tests are shown, the first using all 79 polarities of 13 events (score 0.71) and the second joining only the polarities of the 3 above mentioned events (with 6 polarities in disagree- ment out of a total of 34). In both cases the composite solution fits well the solutions obtained for the single major events. 7. Source Parameters In this section we discuss the results of an analysis aimed Open Access OJER  P. PIERRI ET AL. 101 at inferring source parameters (corner frequency, source dimension, seismic moment and stress drop) and attenua- tion parameters from the inversion of P wave spectra. As we will detail in a next section, this has been possible only for 3 events (ID 9, 19, 21). 7.1. Data Analysis The seismic spectra were computed by considering a time window TL = 2.56 s which starts 0.1 s before the P wave arrival time. To reduce distortions due to the finite length of the signals [30], a cosine taper window with a 15% fraction of tapering was applied to the P wave time window before computing its amplitude spectrum. Traces were deconvolved for the instrumental response. In a preliminary analysis we noted that seismic noise dominates over the signal at low frequencies (f < 2 Hz) and at high frequencies (f > 40 Hz). For this reason, we applied a band-pass filter 2 < f < 40 Hz to data and removed the mean value before com- puting the spectra. The same data processing was applied for the calculation of seismic spectra of noise. The analy- sis was performed on a time window having a length of 2.56 s that is adjacent to the time window used for the calculation of P wave spectra. Finally, an average mov- ing window with a full width of five neighbouring points [31] was used to smooth the spectra. To obtain suffi- ciently stable estimates of model parameters, we selected only those signals having an average signal to noise ratio greater than 3. 7.2. Method The velocity spectrum Ui,j(f) of the i-th event observed at j-th station can be expressed as [e.g. 32]: i,ji,j i,jj Uf=SfBfRf (2) where S is the source spectrum, B is the attenuation spectrum and R is the site spectrum. In the far-field ap- proximation, the source spectrum can be written as: 0,i,j i,j 1/n γn c,i Ω Sf= f 1+ f (3) In the previous equation, fc,i is the corner frequency, Ω0,i,j is the low-level spectral amplitude, γ is the high- frequency spectral fall-off and n is a constant. The low- level spectral amplitude is related to the seismic moment by the equation: 3 0 0 θ,φ 4πρrc Ω M= R (4) where r is the source to receiver distance, ρ is the density of rocks, Rθ,Φ is the radiation pattern and c is the velocity of the considered wave. The source spectrum is generally described by the Brune source model [33], which corresponds to the so called “omega square” model (i.e. n = 1 and γ = 2). As, in some cases, the recordings of earthquakes show a corner sharper than the original Brune model (for a review see [34]), a different approximation to the source model that corresponds to γ = 2 and n = 2 is used. This choice cor- responds to the Boatwright source model [35], that we used in our analysis. The attenuation spectrum is described by the equation: i,j i,j πft Bf=exp Q (5) where ti,j is the travel time of the considered wave and Q is the quality factor of the waves. Q may depend on fre- quency; however, in many cases [e.g. 36] a constant Q model results in a best compromise between data fitting and simplicity of model. For this reason, in this study, we considered a constant Q model. As concerns the site response Rj(f), this is usually ex- pressed as the product of the near-site attenuation func- tion Kj(f) and the local site amplification Aj(f). The near-site attenuation is usually described above a limiting frequency known as fmax [37] in terms of the kj attenua- tion factor, which was first introduced by Anderson and Hough [38]: j Kf=exp πfk (6) The local site amplification Aj(f) is not described by any particular mathematical relationship, and it depends on the elastic and geometrical properties of the rocks near the recording site (e.g. [39]). It is generally com- puted by averaging residuals between theoretical and observed spectra, when many recordings of several earthquakes at a given station are available (e.g. [40,41]). In our case, we do not computed Rj(f) owing to the small number of available recordings. 7.3. Inversion Technique We used the 2-step inversion strategy developed by de Lorenzo et al. [36]. At the first step the whole physically admissible model parameter space is explored using a coarse grid. The range of model parameter values in the coarse grid is selected on the basis of the a priori analysis of the whole data set. At each point of this grid, a misfit function between the observed and the theoretical spec- trum is computed. We compared the results obtained using several misfit function, as proposed by Edwards et al. [40] and inferred that the best results are obtained using the following L1 misfit function of decimal loga- rithms of amplitude: Open Access OJER 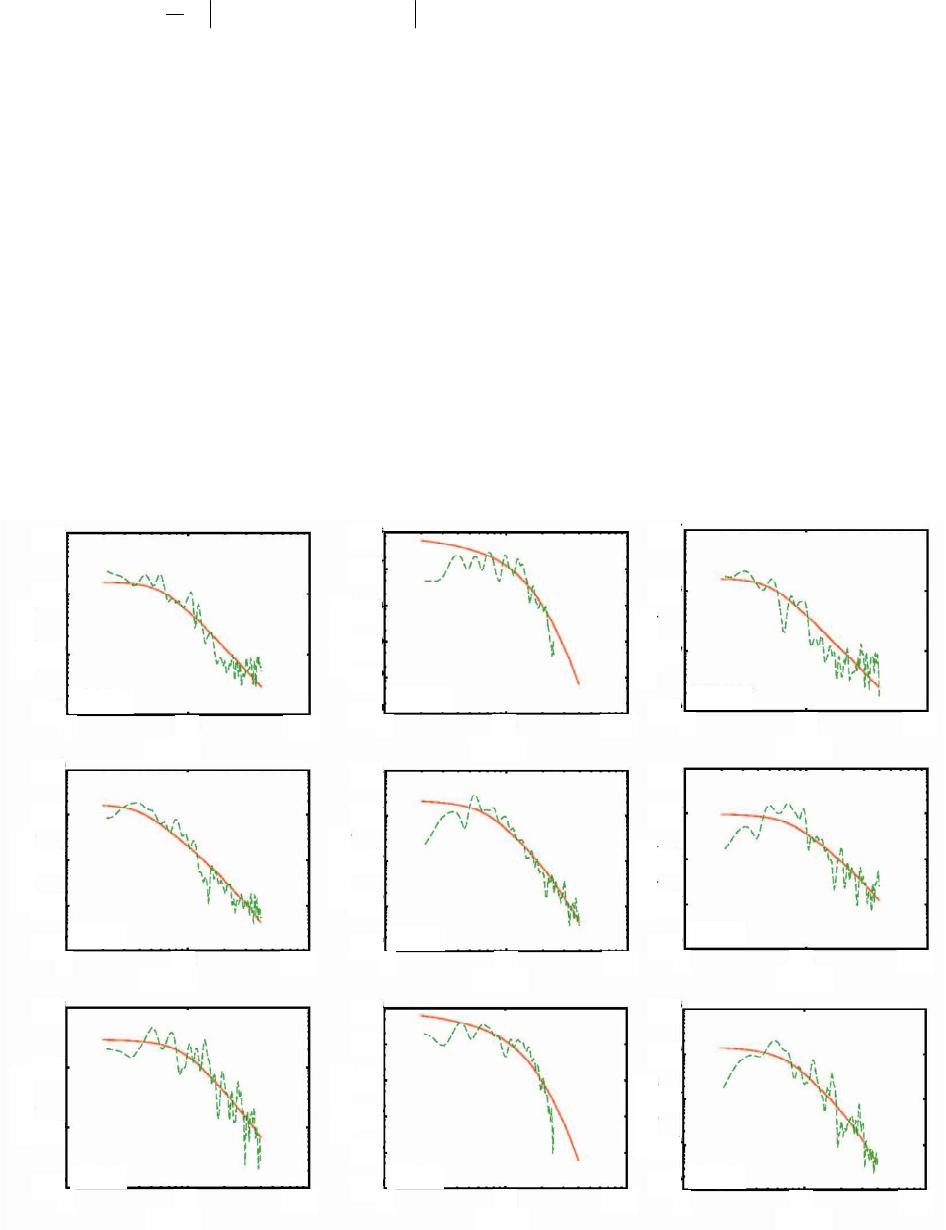 P. PIERRI ET AL. Open Access OJER 102 N * c010obs10teo i=1 1 σf,t,Ω=logUlogU N (7) This approach allows obtaining an initial estimate of model parameters mbest_ini without being subjected to the choice of an initial corner frequency. At the second step, a refined grid is built around mbest_ini and the misfit function is computed at each point of this grid, allowing us to estimate the best fit model parameters mbest for each station. Figure 11 shows the fit of model to data for the event occurred on 11 May, 2008. After the inversion the event corner frequency is ob- tained as the average of the station corner frequency, whereas average QP and the seismic moment are obtained by the logarithmic averages of station values. The estimated source parameters are summarized in Table 4. 8. Discussion and Concluding Remarks The main goal of this study was to deduce the charac- teristics of the low-energy seismic activity that affects the “Penisola Salentina” seismic district, a generally con- sidered substantially aseismic area. In the historical cata- logues is reported only one event of magnitude greater than 6.0, occurred in 1743, and several other earthquakes of lower magnitude. As regards the instrumental seismicity until 2002 the spatial coverage of the seismic stations was too poor in this area to obtain reliable relocations. Notwithstanding, the study of the set of seismic parameters, albeit in an area with a low seismic activity, might provide useful information on its seismological characteristics. There- fore we analysed the seismic activity from 2003 to 2012: the larger number of stations available in the last years, through the improvement of the OSUB network and the implementation of new INGV stations, allowed us to obtain more constrained relocation of low magnitude events compared to official locations (provided in Bulle- tin of the Instrumental Seismicity of INGV). The “Penisola Salentina” seismic district is subjected to very frequent quarry blasts that make more difficult 1 10 100 f(Hz) 110 100 f(Hz) 110 100 f(Hz) 1 10 100 f(Hz) 1 10 100 f(Hz) 110100 110 100 110 100 110 100 f(Hz) f(Hz) f(Hz) f(Hz) A(m s) A(m s) A(m s) A(m s) A(m s) A(m s) A(m s) 1e -7 1e -8 1e -9 1e -10 1e -10 1e -9 1e -8 1e -7 1e -6 1e -11 1e -7 1e -8 1e -9 1e -10 A(m s) 1e -7 1e -8 1e -10 1e -9 1e -6 1e -7 1e -8 1e -10 1e -9 1e -6 1e -7 1e -8 1e -10 1e -9 1e -6 A(m s) 1e -7 1e -8 1e -10 1e -9 1e -6 1e -11 1e -7 1e -8 1e -9 1e -6 1e -7 1e -8 1e -9 1e -6 1e -5 MIGL CRACNOCI PALZ AMUR MRVN MCRV LTRZ MTSN Figure 11. Fit of the P wave displacement spectra at different stations after the inversion for the event occurred on 11 May, 2008.  P. PIERRI ET AL. 103 Table 4. Source and attenuation parameters for the studied events determined using Boatwright source model [35]. M0, fc, L, Δσ and <QP> are the seismic moment, the corner frequency, the source dimension, the stress drop and the average attenua- tion of the P-wave respectively. ID Date M0 (Nm) fc (Hz) L (m) Δσ (Mpa) <QP> 9 2008/05/11 5.8E + 14 ± 1.5E + 14 8.2 ± 3.4 137 ± 57 18 2188 19 2011/05/13 3.1E + 12 ± 1.3E + 10 10.4 ± 4.4 107 ± 45 0.2 826 21 2012/05/05 4.2E + 13 ± 1.3E + 12 11.3 ± 3.5 99 ± 31 3 3982 the systematic collection of tectonic events; quarry blasts (probably 141 out of 163 events) and tectonic earth- quakes (at least 22) have been discriminated. These 22 events have been relocated to obtain more reliable esti- mations on their hypocenters. After several tests, a local velocity model, suitable for this area, has been adopted, with the Vp/Vs ratio equal to 1.78 estimated using a modified Wadati diagram. This value is slightly higher than the 1.73 Poissonian value and may indicate that the crust is partially fluid-perme- ated (e.g. [42]). Despite the high azimuthal gap and the quality of instruments (in some cases mono-component) the relocations are more precise. In fact a RMS reduction of 33% is obtained and an accuracy of about 2 km for the epicentral coordinates and about 5 km for the focal depth is inferred. The higher degree of accuracy in the com- puted locations, with respect to those available in the INGV database, is due to the use of data from both the INGV network and the OSUB network. The majority of these events (including the three most energetic) are lo- cated in a weakness zone, the Taranto-Brindisi depres- sion, near the North Salento Fault Zone (see Figure 3(a)). Information on the stress regime controlling this low- energy seismic activity is rather poor, because only for three events it has been possible to determine the focal mechanisms. The re-picking of the recordings allows us to detect 79 clear polarities on the whole, of which 34 for three major events. Our best constrained solutions of the 5 May, 2012 earthquake reveal strike-slip faulting mechanisms along E-W striking planes. All five focal mechanisms inferred in this study have a common characteristic with regard to the trend of the T axes (of about 45˚), which delineates the existence of an NE-SW extension direction. This pattern is similar to that found by some authors in Mur- gian area [8,43], despite the tectonic differences between the two adjacent areas. The presence of tensional stress in the Taranto-Brindisi depression is consistent with the hypothesis that the margin of the Adriatic plate has un- dergone a buckling process [44,45] following the exten- sional rearrangement of the Apenninic belt masses. The obtained focal mechanisms suggest that a tensional re- gime could be still active. The NE-SW active extension in this area was previously inferred also by Di Bucci et al. [46] on the basis of mesostructural analysis; they pro- posed other different geodynamic models to justify it, for example a consequence of the convergence between Af- rica and Europe. We also computed source (corner frequency, source dimension, seismic moment and stress drop) and attenua- tion (quality factor) parameters of the three major events. We inferred that the quality factor is generally at least a magnitude order higher than the average value (Q ≈ 300) determined in other parts of Italian peninsula (Central Apennines, Campi Flegrei, Southeastern Sicily) [36,47, 48]. Therefore, even if the energy radiated by these earthquakes is generally smaller than that of tectonic or volcanic earthquakes, it is transferred with a greater effi- ciency, as was previously hypothesized on the basis of macroseismic fields of Albanian and Greek events. This result probably reflects the differences between the geo- dynamic context of the areas where the studied earth- quakes occurred. In fact, whereas earthquakes occurring in the Apennine mark the limits among plates and there- fore occur in strongly deformed areas, the events oc- curred in the southern Apulia are probably located inside a plate. The variability of stress drop estimates (roughly between 10 and 100 bar) may indicate that stress drop is not a selective indicator of the geodynamic context, as early proposed by Kanamori and Anderson [49]. 9. Acknowledgements We warmly thank Franco Mele and Alberto Basili of the “Istituto Nazionale di Geofisica e Vulcanologia” who promptly satisfied our data requests. Most of figures were obtained by employing the GMT freeware package by Wessel and Smith [50]. This work was supported by MIUR (Italian Ministry of Education, University and Research) and by FCRP (Fondazione Cassa di Risparmio di Puglia, Bari). REFERENCES [1] J. M. Lort, “The Tectonics of the Eastern Mediterranean: A Geophysical Review,” Reviews of Geophysics, Vol. 9, No. 2, 1971, pp. 189-216. http://dx.doi.org/10.1029/RG009i002p00189 Open Access OJER  P. PIERRI ET AL. 104 [2] J. E. T. Channel and F. Horváth, “The African/Adriatic Promontory as a Palaeogeographical Premise for Alpine Orogeny and Plate Movements in the Carpatho-Balkan Region,” Tectonophysics, Vol. 35, No. 1-3, 1976, pp. 71- 101. http://dx.doi.org/10.1016/0040-1951(76)90030-5 [3] J. E. T. Channel, B. D’Argenio and F. Horváth, “Adria, the African Promontory, in Mesozoic Mediterranean Pa- laeogeography,” Earth-Science Reviews, Vol. 15, No. 3, 1979, pp. 213-292. http://dx.doi.org/10.1016/0012-8252(79)90083-7 [4] G. Calcagnile and G. F. Panza, “The Main Characteristics of the Lithosphere-Asthenosphere System in Italy and Surroundings Regions,” Pure and Applied Geophysics, Vol. 119, No. 4, 1980/81, pp. 865-879. http://dx.doi.org/10.1007/BF01131263 [5] G. Ricchetti, N. Ciaranfi, E. Luperto Sinni, F. Mongelli and P. Pieri, “Geodinamica ed Evoluzione Sedimentaria e Tettonica dell’Avampaese Apulo,” Memorie della Società Geologica Italiana, Vol. 41, 1988, pp. 57-82. [6] D. Slejko, R. Camassi, I. Cecić, D. Herak, M. Herak, S. Kociu, V. Kouskouna, J. Lapajne, K. Makropoulos, C. Meletti, B. Muço, C. Papaioannou, L. Peruzza, A. Rebez, P. Scandone, E. Sulstorova, N. Voulgaris, M. Živčić and P. Zupančić, “Seismic Hazard Assessment for Adria,” Annals of Geophysics, Vol. 42, No. 6, 1999, pp. 1085- 1107. http://dx.doi.org/10.4401/ag-3771 [7] C. Meletti, E. Patacca and P. Scandone, “Construction of a Seismotectonic Model: The Case of Italy,” Pure and Ap- plied Geophysics, Vol. 157, No. 1-2, 2000, pp. 11-35. http://dx.doi.org/10.1007/PL00001089 [8] V. Del Gaudio, P. Pierri, G. Calcagnile and N. Venisti, “Characteristics of the Low Energy Seismicity of Central Apulia (Southern Italy) and Hazard Implications,” Jour- nal of Seismology, Vol. 9, No. 1, 2005, pp. 39-59. http://dx.doi.org/10.1007/s10950-005-1593-9 [9] V. Del Gaudio, P. Pierri, A. Frepoli, G. Calcagnile, N. Venisti and G. Cimini, “A critical revision of the seismic- ity of Northern Apulia (Adriatic Microplate—Southern Italy) and Implications for the Identification of Seismo- genic Structures,” Tectonophysics, Vol. 436, No. 1-4, 2007, pp. 9-35. http://dx.doi.org/10.1016/j.tecto.2007.02.013 [10] S. Castenetto, E. Di Loreto, L. Liperi and C. Margottini, “Studio Macrosismico e Risentimento in Italia dei Terre- moti del Mediterraneo Centro-Orientale del 26 Giugno 1926 e del 17 Gennaio 1983,” Atti 4° Conv. GNGTS, Rome, 1986, pp. 439-456. [11] P. Galli and G. Naso, “The ‘Taranta’ Effect of the 1743 Earthquake in Salento (Apulia, Southern Italy),” Bolle- ttino di Geofisica Teorica ed Applicata, Vol. 49, No. 2, 2008, pp. 177-204. [12] N. Ciaranfi, A. Cinque, S. Lambiase, P. Pieri, L. Rapi- sardi, G. Ricchetti, I. Sgrosso and L. Tortorici, “Proposta di Zonazione Sismotettonica dell’Italia Meridionale,” Rendiconti della Società Geologica Italiana, Vol. 4, 1981, pp. 493-496. [13] S. Tinti, A. Maramai and L. Graziani, “The New Cata- logue of Italian Tsunamis,” Natural Hazards, Vol. 33, No. 3, 2004, pp. 439-465. http://dx.doi.org/10.1023/B:NHAZ.0000048469.51059.65 [14] G. Mastronuzzi, C. Pignatelli, P. Sansò and G. Selleri, “Boulder Accumulations Produced by the 20th of Febru- ary, 1743 Tsunami along the Coast of South-Eastern Salento (Apulia Region, Italy),” Marine Geology, Vol. 242, No. 1-3, 2007, pp. 191-205. http://dx.doi.org/10.1016/j.margeo.2006.10.025 [15] A. Rovida, R. Camassi, P. Gasperini and M. Stucchi, “CPTI11, the 2011 Version of the Parametric Catalogue of Italian Earthquakes,” Milano, Bologna, 2011. http://dx.doi.org/10.6092/INGV.IT-CPTI11 [16] A. Argnani, F. Frugoni, R. Cosi, M. Ligi and P. Favali, “Tectonics and Seismicity of the Apulian Ridge South of Salento Peninsula (Southern Italy),” Annals of Geophys- ics, Vol. 44, No. 3, 2001, pp. 527-540. http://dx.doi.org/10.4401/ag-3573 [17] P. Pieri, V. Festa, M. Moretti and M. Tropeano, “Quarter- nary Tectonic Activity of the Murge area (Apulian Fore- land—Southern Italy),” Annals of Geophysics, Vol. 40, No. 5, 1997, pp. 1395-1404. http://dx.doi.org/10.4401/ag-3876 [18] M. Tozzi, “Assetto Tettonico dell’Avampaese Apulo Me- ridionale (Murge Meridionali—Salento) Sulla Base dei dati Strutturali,” Geologica Romana, Vol. 29, 1993, pp. 95-111. [19] R. Gambini and M. Tozzi, “Tertiary Geodynamic Evolu- tion of Southern Adria Microplate,” Terra Nova, Vol. 8, No. 6, 1996, pp. 593-602. http://dx.doi.org/10.1111/j.1365-3121.1996.tb00789.x [20] S. Merlini, G. Cantarella and C. Doglioni, “On the Seismic Profile CROP M5 in the Ionian Sea,” Bollettino della Società Geologica Italiana, Vol. 119, 2000, pp. 227-236. [21] F. Mele, L. Arcoraci, P. Battelli, M. Berardi, C. Castellano, G. Lozzi, A. Marchetti, A. Nardi, M. Pirro and A. Rossi, “Bollettino Sismico Italiano 2008,” Quaderni di Geofisica, Vol. 85, 2010, 45 p. [22] Gruppo di Lavoro MPS, “Redazione Della Mappa di Pericolosità Sismica Prevista dall’Ordinanza PCM 3274 del 20 Marzo 2003,” Rapporto Conclusivo per il Dipar- timento della Protezione Civile, INGV, Milano-Roma, 2004, 65 p. [23] E. Guidoboni, G. Ferrari, D. Mariotti, A. Comastri, G. Tarabusi and G. Valensise, “CFTI4Med, Catalogue of Strong Earthquakes in Italy (461 B.C.-1997) and Medi- terranean Area (760 B.C.-1500),” INGV-SGA, 2007. http://storing.ingv.it/cfti4med/ [24] D. Postpischl, “Catalogo dei Terremoti Italiani dall’Anno 1000 al 1980,” C.N.R.—Progetto Finalizzato Geodina- mica—Quaderni della Ricerca Scientifica, 114 2B, Bolog- na, 1995, 239 p. [25] B. Castello, G. Selvaggi, C. Chiarabba and A. Amato, “CSI—Catalogo Della Sismicità Italiana 1981-2002,” Versione 1.1, INGV-CNT, Roma, 2006. http://csi.rm.ingv.it/ [26] S. Wiemer and M. Baer, “Mapping and Removing Quarry Blast Events from Seismicity Catalogs,” Bulletin of the Seismological Society of America, Vol. 90, No. 2, 2000, pp. 525-530. http://dx.doi.org/10.1785/0119990104 Open Access OJER  P. PIERRI ET AL. Open Access OJER 105 [27] J. C. Lahr, “HYPOELLIPSE—Version 2.0: A Computer Program for Determining Local Earthquakes Hypocentral Parameters, Magnitude, and First-Motion Pattern,” US Geol. Surv. Open-File Rep. 89-116, 1989, 92 p. [28] J. L. Chatelain, “Etude Fine de la Sismicité en Zone de Collision Continentale à l’Aide d’un Réseau de Stations Portables: La Région Hindu-Kush-Pamir,” Ph. D. Thesis, Univ. Paul Sabatier, Toulouse, 1978. [29] P. Reasenberg and D. Oppenheimer, “FPFIT, FPPLOT and FPPAGE: FORTRAN Computer Programs for Cal- culating and Displaying Earthquake Fault-Plane Solu- tions,” US Geol. Surv. Open-File Rep. 85-739, 1985. [30] S. Stein and M. Wysession, “An Introduction to Seismo- logy, Earthquakes and Earth Structure,” Blackwell, Mal- den, 2003. [31] W. H. Press, B. P. Flannery, S. A. Teukolsky and W. T. Vetterling, “Numerical Recipes: The Art of Scientific Computing (Fortran Version),” Cambridge Univ. Press, Cambridge, 1989. [32] F. Scherbaum, “Combined Inversion for the Three-Dimen- sional Q Structure and Source Parameters Using Micro- earthquake Spectra,” Journal of Geophysical Research, Vol. 95, No. B8, 1990, pp. 12423-12438. http://dx.doi.org/10.1029/JB095iB08p12423 [33] J. N. Brune, “Tectonic Stress and the Spectra of Seismic Shear Waves from Earthquakes,” Journal of Geophysical Research, Vol. 75, No. 26, 1970, pp. 4997-5009. http://dx.doi.org/10.1029/JB075i026p04997 [34] R. E. Abercrombie, “Earthquake Source Scaling Rela- tionships from −1 to 5 ML Using Seismograms Recorded at 2.5 km Depth,” Journal of Geophysical Research, Vol. 100, No. B12, 1995, pp. 24015-24036. http://dx.doi.org/10.1029/95JB02397 [35] J. Boatwright, “A Spectral Theory for Circular Seismic Sources: Simple Estimates of Source Dimension, Dy- namic Stress Drop and Radiated Seismic Energy,” Bulle- tin of the Seismological Society of America, Vol. 70, No. 1, 1980, pp. 1-27. [36] S. de Lorenzo, A. Zollo and G. Zito, “Source, Attenuation, and Site Parameters of the 1997 Umbria-Marche Seismic Sequence from the Inversion of P Wave Spectra: A Comparison between Constant QP and Frequency De- pendent QP Models,” Journal of Geophysical Research, Vol. 115, No. B09, 2010. http://dx.doi.org/10.1029/2009JB007004 [37] T. C. Hanks, “fmax,” Bulletin of the Seismological Soci- ety of America, Vol. 72, 1982, pp. 1867-1879. [38] J. G. Anderson and S. E. Hough, “A Model for the Shape of the Fourier Amplitude Spectrum at High Frequencies,” Bulletin of the Seismological Society of America, Vol. 74, 1984, pp. 1969-1993. [39] N. Tsumura, A. Hasegawa and S. Horiuchi, “Simultane- ous Estimation of Attenuation Structure, Source Parame- ters and Site Response Spectra—Application to the Nor- theastern Part of Honshu, Japan,” Physics of the Earth and Planetary Interiors, Vol. 93, No. 1-2, 1996, pp. 105- 121. http://dx.doi.org/10.1016/0031-9201(95)03091-3 [40] B. Edwards, A. Rietbrock, J. J. Bommer and B. Baptie, “The Acquisition of Source, Path, and Site Effects from Microearthquake Recordings Using Q Tomography: Ap- plication to the United Kingdom,” Bulletin of the Seis- mological Society of America, Vol. 98, No. 4, 2008, pp. 1915-1935. http://dx.doi.org/10.1785/0120070127 [41] B. Edwards and A. Rietbrock, “A Comparative Study on Attenuation and Source-Scaling Relations in the Kantõ, Tokai, and Chubu Regions of Japan, Using Data from Hi-Net and Kik-Net,” Bulletin of the Seismological Soci- ety of America, Vol. 99, No. 4, 2009, pp. 2435-2460. http://dx.doi.org/10.1785/0120080292 [42] C. Chiarabba and A. Amato, “Vp and Vp/Vs Images in the Mw 6.0 Colfiorito Fault Region (Central Italy): A Contribution to the Understanding of Seismotectonic and Seismogenic Processes,” Journal of Geophysical Resear- ch, Vol. 108, No. B5, 2003, p. 2248. http://dx.doi.org/10.1029/2001JB001665 [43] C. Maggi, A. Frepoli, G. B. Cimini, R. Console and M. Chiappini, “Recent Seismicity and Crustal Stress Field in the Lucanian Apennines and Surrounding Areas (Southern Italy): Seismotectonic Implications,” Tectonophysics, Vol. 463, No. 1-4, 2009, pp. 130-144. http://dx.doi.org/10.1016/j.tecto.2008.09.032 [44] G. Ricchetti and F. Mongelli, “Flessione e Campo Gra- vimetrico Della Micropiastra Apula,” Bollettino di Geo- fisica Teorica ed Applicata, Vol. 36, 1980, pp. 381-398. [45] C. Doglioni, F. Mongelli and P. Pieri, “The Puglia (SE Italy) Uplift: An Anomaly in the Foreland of the Ap- enninic Subduction Due to Buckling of a Thick Conti- nental Lithosphere,” Tectonics, Vol. 13, No. 5, 1994, pp. 1309-1321. http://dx.doi.org/10.1029/94TC01501 [46] D. Di Bucci, R. Caputo, G. Mastronuzzi, U. Fracassi, G. Selleri and P. Sansò, “Quantitative Analysis of Exten- sional Joints in the Southern Adriatic Foreland (Italy), and the Active Tectonics of the Apulia Region,” Journal of Geodynamics, Vol. 51, No. 1-2, 2011, pp. 141-155. http://dx.doi.org/10.1016/j.jog.2010.01.012 [47] S. de Lorenzo, A. Zollo and F. Mongelli, “Source Pa- rameters and Three-Dimensional Attenuation Structure from the Inversion of Microearthquake Pulse Width Data: Qp Imaging and Inferences on the Thermal State of the Campi Flegrei Caldera (Southern Italy),” Journal of Geo- physical Research, Vol. 106, No. B8, 2001, pp. 16265- 16286. http://dx.doi.org/10.1029/2000JB900462 [48] S. de Lorenzo, G. Di Grazia, E. Giampiccolo, S. Gresta, H. Langer, G. Tusa and A. Ursino, “Source and Qp Pa- rameters from Pulse Width Inversion of Microearthquake Data in Southeastern Sicily, Italy,” Journal of Geophysi- cal Research, Vol. 109, No. B07, 2004. http://dx.doi.org/10.1029/2003JB002577 [49] H. Kanamori and D. L. Anderson, “Theoretical Basis of Some Empirical Relations in Seismology,” Bulletin of the Seismological Society of America, Vol. 65, No. 5, 1975, pp. 1073-1095. [50] P. Wessel and W. H. F. Smith, “New, Improved Version of Generic Mapping Tools Released,” Eos, Transactions American Geophysical Union, Vol. 79, No. 47, 1998, 579 p.
|