 Open Journal of Applied Biosensor, 2013, 2, 112-119 Published Online November 2013 (http://www.scirp.org/journal/ojab) http://dx.doi.org/10.4236/ojab.2013.24015 Open Access OJAB Development of a QCM (Quartz Crystal Microbalance) Biosensor to the Detection of Aflatoxin B1 Katia Spinella1, Lucia Mosiello1, Giuseppe Palleschi2, Fabio Vitali1 1ENEA, Italian National Agency for New Technologies, Energy and the Environment, Rome, Italy 2Dipartimento di Scienze e Tecnologie Chimiche, Università di Roma Tor Vergata, Rome, Italy Email: lucia.mosiello@enea.it Received January 30, 2013; revised March 14, 2013; accepted April 1, 2013 Copyright © 2013 Katia Spinella et al. This is an open access article distributed under the Creative Commons Attribution License, which permits unrestricted use, distribution, and reproduction in any medium, provided the original work is properly cited. ABSTRACT In this study, we have used a direct immunoassay where the simple binding between antigen and an antibody is detected. Immunoassays were performed in a drop system, monitoring the frequency decrease of the quartz-crystal microbalance device because of mass increasing during immunoreaction. The QCM sensor was coated on both sides by gold elec- trodes, only one side of the crystal (liquid side) was in contact with the solution; the other side (contact side) was al- ways dry. We tested a piezoelectric immunosensor for aflatoxin B1 (AFLA-B1) mycotoxin detection through the immo- bilization of DSP-anti-AFLAB1 antibody (AFLA-B1-Ab anti AFLAB1) on gold-coated quartz crystals (AT-cut/5 MHz). The DSP (3,3’-Dithiodipropionic-acid-di-N-hydroxysuccinimide ester) was used for the covalent attachment of the pro- teins. The piezoelectric crystal electrodes were pretreated by DSP for 15 min, rinsed with water and dried in a gentle flow of nitrogen gas. Then the DSP-coated crystals were installed in a sample holder and exposed to the anti-AFLAB1 antibody and to the AFLA-BI. Frequency and resistance shifts (Δf and ΔR) were measured simultaneously. Δf versus AFLA-BI concentrations in the range of 0.5 - 10 ppb exhibited a perfect linear correlation with a coefficient of above 0.998. Keywords: Immunosensor; Quartz Crystal Microbalance; Aflatoxin B1; Antibody; Gold Electrodes 1. Introduction The term mycotoxins includes numerous secondary me- tabolites with high toxicity, products in suitable micro- climatic conditions by microscopic fungi and filamentous, better known by the term “mold”, that colonize the plants and/or the foodstuffs during their growth [1]. Aflatoxin B1 (AFLA-B1) is an example of a group of highly toxic difurancoumarin derivatives that are produced by many strains of Aspergillusflavus and A. parasiticus which often contaminate a variety of food and animal feed stored. The four major aflatoxins have been designated as B1, B2, G1 and G2 based on their fluorescence under UV light and their relative chromatographic mobility during thin layer chromatography. AFLA-B1 has been classified as a group 1 human carcinogen and aflatoxins G1, G2 and B2 belong to a group human carcinogens [2]. These toxins exhibit carcinogenic, teratogenic and muta- genic properties and have now been isolated from a wide variety of agricultural products [3,4]. AFLA-B1 can enter the food chain mainly through the ingestion of contami- nated human or animal food. The intake of AFLA-B1 over a long period of time, even in low concentrations, may be very deleterious to health [5]. The Food and Ag- ricultural Organization 2004 report on mycotoxins [6] revealed that as of December 2003, at least 99 countries worldwide had regulations in place for permitted my- cotoxin levels in food/or feed, and have set limits for AFLA-B1 alone or for the sum of aflatoxins B1, B2, G1 and G2. The maximum permissible level for AFLA-B1 in food was set at 2 μg/kg (2 ppb). Analytical methods for the determination of mycotoxins in food products generally provide a first stage of extraction of the toxin from the matrix (with a solution of methanol-water or ethanol-water, depending on the type of analysis later), a second purification step, and finally the revelation by an appropriate instrumental technique. Typically, the meth- ods used are of type chromatographic or immunochemi- cal but in recent years are being developed analytical techniques that use instead of antibodies, such as bio- logical elements, aptamers. In particular for the determi- K. SPINELLA ET AL. 113 nation of OchratoxinA (OTA) have been developed on solid phase extraction columns containing aptamers spe- cific for the OTA [6]. Generally tests are employed qua- litative or semi-quantitative rapid screening for as many samples (tendentially with immunochemical methods) and subsequent phases of confirmation with a precise quantification for positive samples (tendentially with chromatographic methods), these include thin-layer chro- matography (TLC) [7] and high-performance liquid chro- matography (HPLC) [8]. Though these techniques have excellent sensitivities they typically require skilled op- erators, extensive sample pre-treatment and expensive equipment [9]. The goal of more recent studies has been to simplify and expedite the method of detection while attempting to maintain or improve the sensitivity. Re- sponding to the need to achieve high sensitivity and move to the use of disposable probes, several electro- chemical immunosensors have been reported in literature for the detection of AFB1 in corn and barley [10-12] and AFM1 in milk [13]. Among the immunochemical ap- proaches, the enzyme-linked immunosorbent assay (ELI- SA) method is the most widely applied. Spectrophoto- meric ELISAs specific for AFLAB1 [14,15], total afla- toxins [16,17] and AFLAM1 [18,19] have been devel- oped and their simplicity, adaptability and sensitivity have been demonstrated. In order to achieve higher sen- sitivity and move to the use of disposable probes, elec- trochemical immunosensors for aflatoxins based on indi- rect competitive ELISA format have been proposed [20]. These immunosensors require the use of labeled secon- dary antibodies for detection. To achieve label-free im- munosensors, direct electrochemical immunosensors for AFB1 based on electrochemical impedance spectroscopy [21], optical waveguide lightmode spectroscopy [22] and room temperature ionic liquids [23] have been reported. However, results on ELISAs need several incubation, washing, and separation steps. Because of the labor of ELISAs, a great interest in developing label-free and less time-consuming on-line detection methods, such as the use of biosensors, is undiminished. With this purpose, piezoelectric quartz crystals are convenient for affinity- based sensors, particularly for immunosensors. The com- bination of low cost with increased sensitivity, selectivity, simplicity, and possible reusability make piezoelectric immunosensors a valuable alternative to other existing like optical (e.g., plasmon resonance or molecular fluo- rescence) and electrochemical immunosensors. The search for a simple and label-free piezoelectric immuno- sensor is of considerable interest. The mass sensing of the quartz-crystal microbalance (QCM) removes the need of any labelling step for the signal transduction and dis- play detection sensitivities up to a 1- to 100-fold linear ΔF vs. mass range with limit detections as few as nano- grams per milliliter levels. The QCM immunosensor is usually comprised of a quartz crystal with an antigen or antibody immobilised on its surface, which allows the label-free detection with a direct quantification of the im- munocomplex (Ab-Ag). A QCM that responds to changes in mass on the electrode surface and has a sensitivity in the ngand is used for a wide range of applications in the medical field [24,25]. Currently, the piezoelectric immu- nosensors are used to determine tumor markers in clini- cal diagnostics, since they allow performing the analysis in real time. Chou et al. [26] and Zhang et al. [27] have proposed respectively a piezoelectric immunosensor for the human ferritin and one for hCG (human chorionic gonadotropin). In this investigation, a piezoelectric im- munosensor for the detection of AFLA-B1 was devel- oped through the drop-coating of DSP-anti-AFLAB1 antibody (AFLA-B1-Ab anti AFLAB1) on gold-coated quartz crystals (AT-cut/5 MHz). Details of the prepara- tion, characterization and application of the immunosen- sor are described. 2. Experimental Section 2.1. Instrumentation Research Quartz Crystal Microbalance (RQCM) and the piezoelectric quartz crystals (AT-cut, 5 MHz, 1-inch dia- meter) were from Inficon (USA).The quartz crystals were obtained by cutting the quartz with an angle of 35˚ 25′ relative to the axis crystallographic z. The main ad- vantage of this cut is the obtainment of quartzes little sensitive to temperature, at least in a range that goes from 10˚C to 50˚C. The crystals are coated on both sides by gold electrodes, the crystals were installed in a sample holder and exposed to the anti-mycotoxin antibody and to the analyte (mycotoxin). Frequency and resistance shi- fts (Δf and ΔR) were measured simultaneously. Only one side of the crystal was in contact with the solution; the other side was always dry. All date is recorded and dis- played graphically using an integrated software based on Windows system. The heart of this system is an oscillator, a phase locked loop (PLO, Phase Lock Oscillator) which allows creating a signal whose phase has a fixed rela- tionship with that of a reference signal. The circuit also includes the ability to adjust the electrical capacity of the crystal, and this is essential for accurate measurements of thin films and for applications that provide a measure of the analyte in the flow. The PLO uses an internal oscil- lator indicated as a voltage controlled oscillator (VCO, Voltage Controlled Oscillator) for driving the crystal. 2.2. Immunochemicals and Chemicals Polyclonal rabbit antibody for Aflatoxin B1 (Rabbit anti- Aflatoxin B1) was from Sigma Aldrich (St. Louis, USA), monoclonal rabbit antibody immobilized on beads which Open Access OJAB 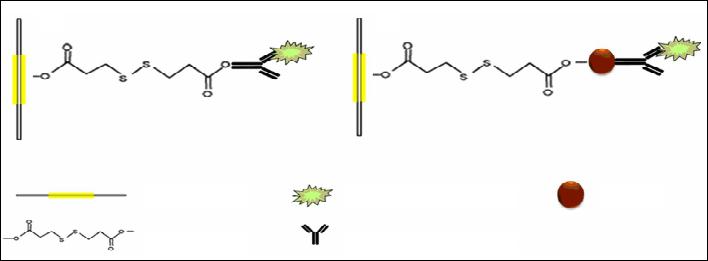 K. SPINELLA ET AL. Open Access OJAB 114 were recorded as a function of time at an interval of 300 s for a longtime monitoring (about 5 h). were extracted from immunoaffinity columns were from R- Biopharms.r.l, (Italy). Aflatoxin B1 from A. flavus (As- pergillusflavus), 3,3’-Dithiodipropionic-acid-di-N-hydro- xysuccinimide ester (DSP),acetone (C3H6O) and sepha- roase beads, similar to those usually used for the coating of Protein A in the production of affinity columns for the Fc region (Fragment crystallizable) immunoglobulin (IgG), were purchased from Sigma-Aldrich. Working buffer was the phosphate buffer saline (PBS) of pH = 7.4 (1.4 mM KH2PO4; 8.0 mM Na2PO4; 136 mM NaCl; 2.7 mM KCl). Caution AFLA-B1 is a potent carcinogen molecule, and extreme caution is therefore necessary to avoid con- tact with this. Contaminated materials must be appropri- ately discarded. 2.4. Immobilization of AFLA-B1 Antibody The coating of quartz was carried out under a hood to avoid contamination. We have developed two procedures for immobilization of Ab-specific antigen (Ab anti-afla- toxin) on the surface of the quartz crystals: absorption of specific antibodies directed and use of antibodies immo- bilized on the beads (Figure 1). As regards the direct absorption, antigen specific antibodies were directly added in drops on the surface of the quartz crystals pre- viously coated with DSP. The antibodies immobilized on the solid support were taken from immunoaffinity columns and added in a drop on quartz pre-treated with DSP. 2.3. Materials and Methods Used for the Coating of Quartz Crystals The piezoelectric crystal electrodes were pretreated with 20 ul DSP (3,3’-Dithiodipropionic-acid-di-N-hydroxy- succinimide ester) for 15 min rinsing with water, dried in a gentle flow of nitrogen gas and then were installed in a sample holder. The DSP was used for the covalent at- tachment of the proteins. The DSP binds covalently to proteins, including antibodies, which generally have dif- ferent primary amines in the amino acid side chains (ad. Example amines present in the chain of Lysine R), these residues and the N-terminal of each polypeptide are avai- lable as targets for the DSP. This phase functionalization of quartz crystals is extremely critical, you must obtain a homogeneous coating of the surface to be treated. Clean gold surfaces were immersed in a 3 mL solution of hy- drogen peroxide (30%), ammonia (25%) and deionized water heated to a temperature of about 75˚C for 5 min- utes. Immediately rince liberally with deionized water and dry in a gentle flow of nitrogen gas. Then the DSP- coated crystals were installed in a sample holder and ex- posed to the anti-mycotoxin antibody and to the analyte (mycotoxin). Frequency and resistance shifts (Δf and ΔR) were measured simultaneously. The frequency shifts 2.5. Method of Extraction of Aflatoxin from Contaminated Matrices For the extraction of aflatoxin B1 from real samples (peanuts) considered in this work applies a standard pro- tocol: the homogenized sample with a water-alcohol so- lution, then you make a dilution of the extract by the ad- dition of a phosphate buffer solution (PBS). The purifi- cation is carried out by passing it through the immunoaf- finity column (IAC) containing antibodies specific for AFB1; the mycotoxin is then eluted with methanol and quantified via RQCM. Initially were weighed directly homogenizer 5 g of sample (accuracy ± 0.1 g), and added 0.5 g of sodium chloride (NaCl) and 2 mL of extraction solvent (methanol: water in the proportions 80:20 v/v). The sample was agitated at high speed for 3 minutes. The extract was filtered on a paper filter and 2 mL of filtrate is taken and diluted with 2 mL of PBS (Phosphate Buff- ered Saline). The diluted sample was applied to the im- munoaffinity column as described in the next section. The aflatoxin B1 was eluted directly into 5 mL volumet- ric flask, following a two-step procedure: QCM sensore DSP Analita beads Ab-antigene specifico (a) (b) Figure 1. Diagram of immobilization of Ab on the surface of the electrode of gold of the quartz crystal. (a) Coating of the gold surface with DSP and Ab-specific antigen; (b) Coating of the gold surface with DSP and beads with monoclonal Ab specific mycotoxin. 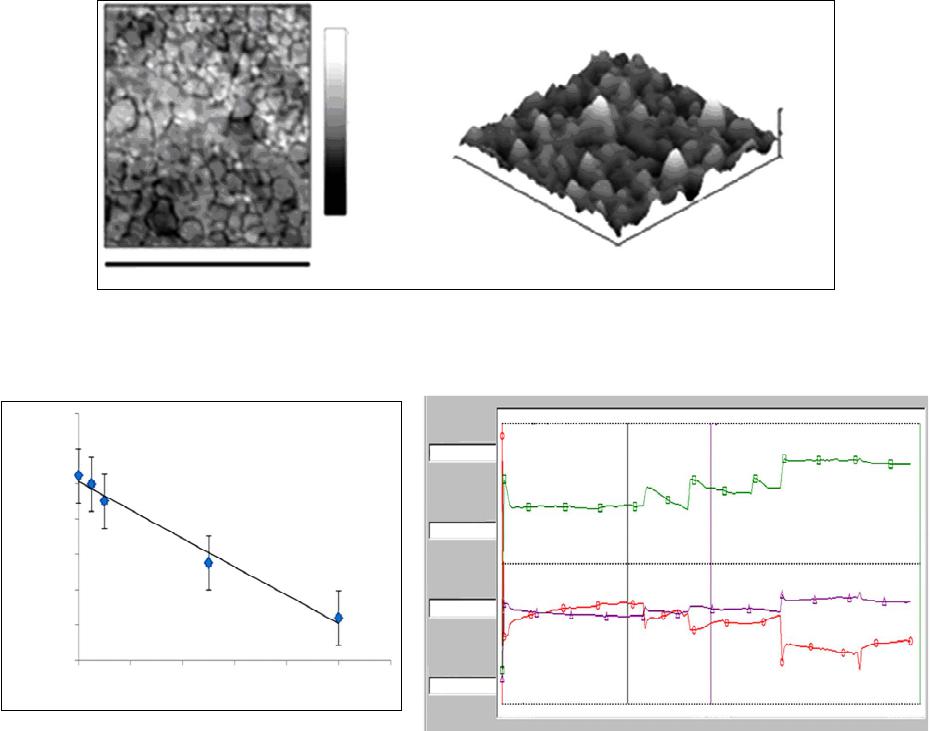 K. SPINELLA ET AL. 115 By applying 1 mL of methanol and leaving the IAC flowing by gravity. Waiting for 1 minute, and applying a second portion of 1 mL of methanol. Subsequently we collected the eluting solvent residue passing, with a 10 mL syringe, through the IAC, a volu- me of air equal to two /three times the volume of the same. It was brought to volume with water, the sample was then stored at 4˚C until analysis with RQCM. 3. Results and Discussion 3.1. Characterization of the Quartz Crystal Surface For accurate results of the QCM the characterization of the gold surface of the quartz crystals are highly recom- mended. The surface of the quartz crystal functionalized with the DSP was characterized AFM (Atomic Force Microscope) is shown in Figure 2. The phase imaging is able to bring out details hidden in the normal image re- construction, highlighting edges and grooves which can be correlated with the different physic-chemical charac- teristics of the sample. From the phase imaging shows that the treated surface is homogeneous, the gradation of gray indicates the thickness of the coating, the lightest areas are those that present a greater layer DSP, 90 nm thick coating. 3.2. Standard Curve for Aflatoxin B1 For the determination of mycotoxins through an immu- nosensor-QCM was initially developed a direct immu- noassay which used a polyclonal antibody, by which it was possible to identify the mycotoxin AflatoxinB1 in solutions at different concentrations (standard solutions) prepared in the laboratory. In these experiments, con- ducted essentially in order to define and characterize our system, we used the standard concentrations of Aflatox- inB1 of 0.5, 1, 5, 10 ppb (ng/mL). Applying the method- ology described were conducted immunoassays and di- rect from the data obtained we were able to construct the standard curve shown in Figure 3. We report the follow- 3500 nm −90 nm −40 nm −0 nm X: 3.5 umY: 3.5 um 20 nm 0 nm (a) (b) Figure 2. AFM image of surface of the quartz crystal functionalized with the DSP: (a) Phase-imaging; (b) Topography 3D image. [AflaB1] ng/mL 0 2 4 6 8 10 12 Frequenza (MHz) y = −0.0002x + 5 R 2 = 0.9846 Time 00:53:56.35 Deta Frequency#1 −1376.29 ○Deta Frequency#1 (Hertz) 100.00 −2200.00 5001 50,005 5 49,995 4999 49,985 4998 49,975 Mass#1 24.354 Resistance#1 779.2 ΔMass#1 (ugm/cm 2 ) 100.000 □Resistance#1 (Ohms) 1100.0 −10.000 0.00 00:00:00.00 Time (Minutes) 03:00:00.00 Figure 3. Standard curve by immunoassay using polyclonal antibodies directed to different concentrations of AflaB1 (on left) and relationship between Δf (red line) a function of mass (violet line) and resistance (green line). Open Access OJAB 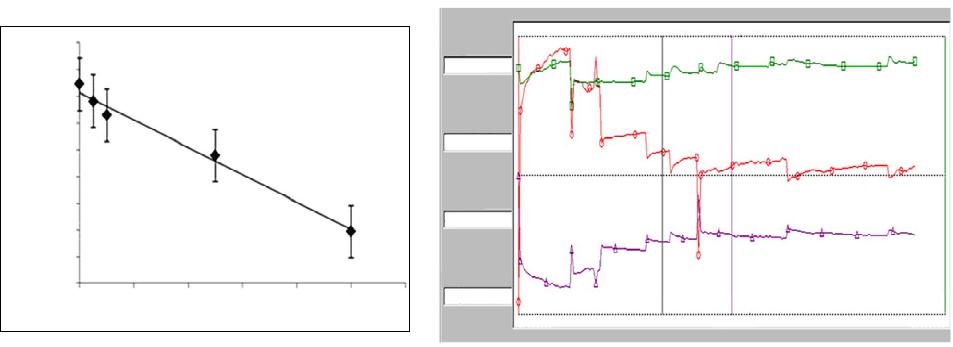 K. SPINELLA ET AL. 116 ing values: LOD = 0.3 ng/ml Working range: 0.5 - 10 ng/ml The detection limit (LOD) is estimated from the mean of the blank, the standard deviation of the blank and some confidence factor. The value of is given by the equation: 11 bb xks (1) where 1b is the mean of the blank measures, 1b is the standard deviation of the blank measures, and k is a nu- merical factor chosen according to the confidence level desired. The RQCM allows to measure simultaneously the Δf and ΔR, the frequency has a decreasing trend, as de- scribed by Sauerbrey equation [28] with increasing mass deposited on the surface of the quartz crystal is a reduc- tion of the resonance frequency of the crystal. 3.3. Standard Curve for Aflatoxin B1 (Immunoassay Performed with a Monoclonal Antibody mAb Anti-Aflatoxin B1 Immobilised on Beads) Using the protocol described before and through the use of another type of antibody specific for the Aflatoxin B1 (a monoclonal antibody), we conducted a series of ex- periments, especially in order to improve the sensitivity of our system and could construct a second standard curve. In this case, we used monoclonal antibodies to the Aflatoxin B1 immobilized on beads. The results obtained are shown in Figure 4. We have built a standard curve for the Aflatoxin B1, obtaining very encouraging results about the possibility to propose our system as a screening test for this mycotoxin. As shown by the graphs, the two different systems have similar results especially in terms of measurement sensitivity. The system using polyclonal antibody would seem to be more sensitive and certainly better meets the analytical needs required for the deter- mination of Aflatoxin B1. Monoclonal antibodies, in fact, generally show a grea- ter selectivity and affinity for the antigens against which they are produced, compared to polyclonal immunoglo- bulins. For the extraction of aflatoxin B1 from real sam- ples (peanuts) considered in this work, we used a stan- dard protocol described previously. In Figure 5 we have a graph that relates the frequency as a function of con- centration, each point on the curve corresponds to the ad- dition of Ab specific monoclonal AflaB1 and to the sam- ple of Aflatoxin B1 diluted 1:100, 1:50, 1:10 and 1:5, the curve has a decreasing trend which corresponds to the decrease of the resonance frequency of the quartz crystal. For the development immunoassay direct we used the monoclonal antibodies immobilized on beads as gener- ally show greater selectivity for the antigens against which they are produced, compared to the polyclonal immunoglobulins. 4. Conclusion These results, since they are related to a direct immuno- assay using monoclonal antibodies specific for Aflatoxin B1 (mAb anti-AflaB1) immobilized on beads, bound on the surface of quartz pre-treated, by means of which in- creases the mass on the surface of the quartz crystals is a reduction of the resonance frequency of the crystal, are of particular importance, since they show the applicabil- ity and feasibility of direct immunoassay format with im- mobilized antibodies. Unfortunately, we have found that the step of functionalization of the quartz crystals affect the success of the experiment, however, since the greater advantage of the QCM results in a label-free system that allows the identification of different analytes, in our sys- tem that characteristic not only is preserved, but, being ○Deta Frequency#1 (Hertz) 4800.00 Deta Frequency#1 2722.49 −220.00 ΔMass#1 (ugm/cm 2 ) 100.000 □Resistance#1 (Ohms) 2400.0 Time 01:58:03.80 Mass#1 −48.022 Resistance#1 2066.3 −100.000 0.00 00:00:00.00 Time (Minutes) 05:50:00. 0 0 [AflaB1] ng/mL 0 2 4 6 8 10 12 Frequenza (Mhz) y = −0.0001x + 49,948 R 2 = 0.9864 49,952 4995 49,948 49,946 49,944 49,942 4994 49,938 49,936 49,934 Figure 4. Standard curve by direct immunoassay using monoclonal antibodies immobilized on beads (on left) and relation- ship between Δf (red line) a function of mass (violet line) and resistance (green line). Open Access OJAB 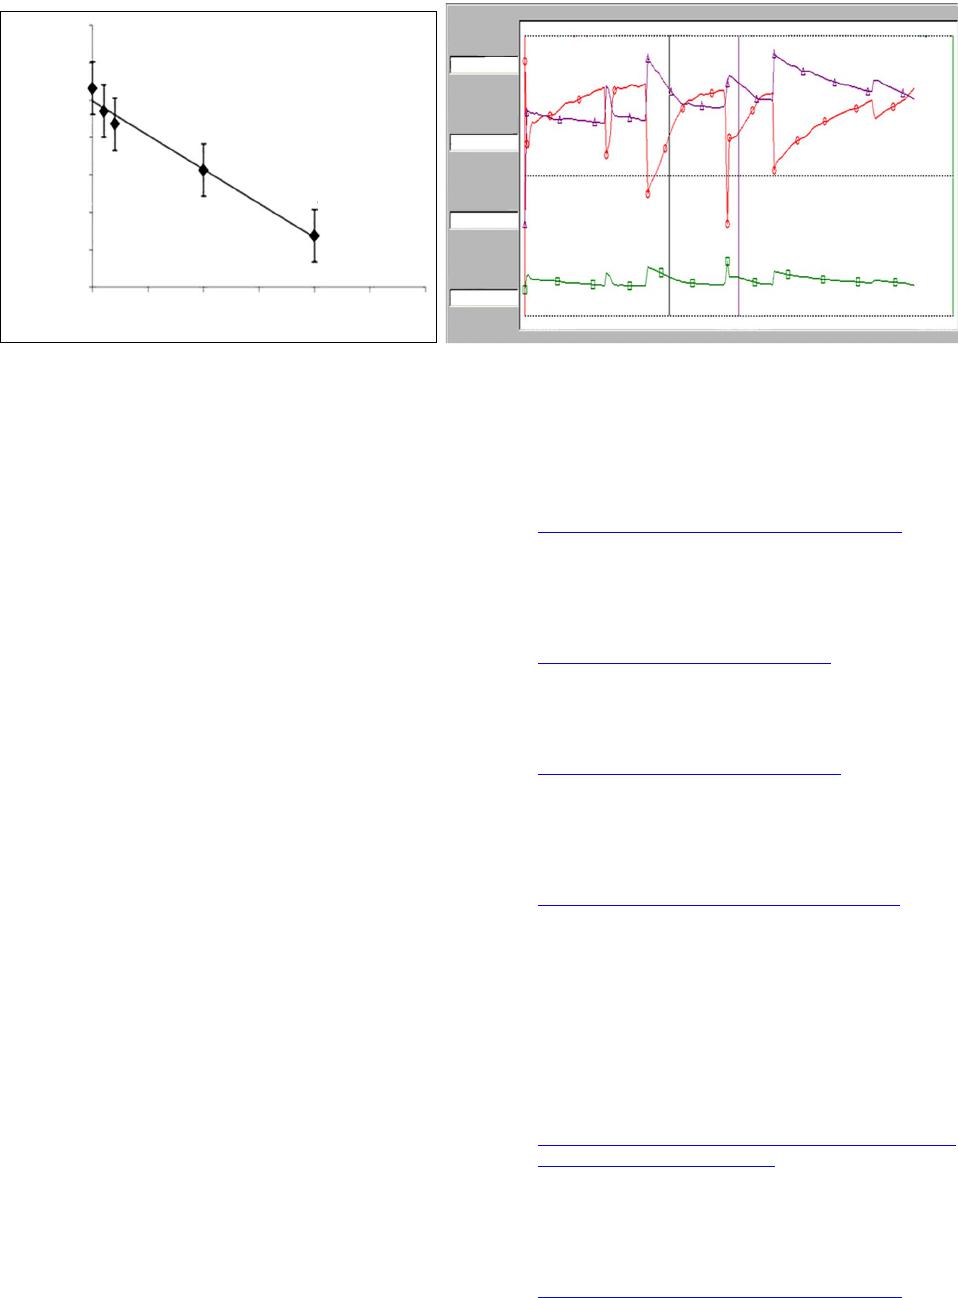 K. SPINELLA ET AL. 117 Dilutions AflaB1 (ng/mL) 0.00 0.05 0.10 0.15 0.20 0.25 0.30 Frequenza (MHz) y = −0.0091x + 5 R 2 = 0.9804 Time 01:14:12.70 Deta Frequency#1 −292.02 ○Deta Frequency#1 (Hertz) 100.00 −1000.00 5001 50,005 5 49,995 4999 49,985 4998 49,975 Resistance#1 785.6 Mass#1 5.143 ΔResistance#1 (Ohms) 970.0 □Mass#1 (ugm/cm 2 ) 100.000 0.00 −10.000 00:00:00.00 Time (Minutes) 03:40:00.00 0 1:100 1:50 1:10 1:5 Figure 5. Standard curve by direct immunoassay using monoclonal antibodies for AFLAB1 applied in the sample (on left) and relationship between Δf (red line) a function of mass (green line) and resistance (violet line). applied to the identification of mycotoxins, can assume new application scenarios of the QCM, based on the use of antibodies immobilized on a solid support in the field of food security and, therefore, human health. Frequency and resistance shifts (Δf and ΔR) were measured simul- taneously. Δf versus mycotoxins concentrations in the range of 0.5 - 10 ppb exhibited a perfect linear correla- tion with a coefficient of above 0.998. Monoclonal anti- bodies, in fact, generally show a higher and better speci- ficity for antigens against which they are produced, as compared to polyclonal immunoglobulin. The QCM bas- ed sensing label free procedure for mycotoxin detection, developed in our laboratory, can be considered a simple, cost effective, real time and no time and labor consuming technique in comparison with conventional assay proce- dures, as GC chromatography. It is important to remem- ber the QCM measures frequency changes and not mass changes, then a strictly keeping constant of the experi- mental conditions while a typical QCM immunosensor experiment is necessary. 5. Acknowledgements This work was supported by ENEA, Italian National Agency for New Technologies, Energy and Sustainable Economic Development. The contributions of Dr. Bar- bara De Santis (IstitutoSuperioredi Sanità, ISS, Rome, Italy), Ing. NicolaDonato and Dr. Giovanni Neri (Uni- versity of Messina, Italy) are also strongly acknowl- edged. REFERENCES [1] R. J. Cole and R. H. Cox, “Handbook of Toxic Fungal Metabolites,” Academic Press, New York, 1981. [2] International Agency for Research on Cancer, “IARC Monographs on the Evaluations of Carcinogenic Risks to Humans,” IARC, Lyon, Vol. 56, 1993, pp. 489-521. [3] O. M. Moss, “Risk Assessment for Aflatoxins in Food- Stuffs,” International Biodeterioration & Biodegradation, Vol. 50, No. 3-4, 2002, pp. 137-142. http://dx.doi.org/10.1016/S0964-8305(02)00078-1 [4] J. Yang, F. Bai, K. Zhang, S. Bai, X. Peng, X. Ding, Y. Li, J. Zhang and L. Zhao, “Effects of Feeding Corn Naturally Contaminated with Aflatoxin B1 and B2 on Hepatic Functions of Broilers,” Poultry Science, Vol. 91, No. 11, 2012, pp. 2792-2801. http://dx.doi.org/10.3382/ps.2012-02544 [5] M. Miraglia, C. Brera and M. Colatosti, “Application of Biomarkers to Assessment of Risk to Human Health from Exposure to Mycotoxins,” Microchemical Journal, Vol. 54, No. 4, 1996, pp. 472-477. http://dx.doi.org/10.1006/mchj.1996.0124 [6] A. De Girolamo, M. McKeague, D. J. Miller, M. C. DeRosa and A. Visconti, “Determination of Ochratoxin A in Wheat after Clean-Up through a DNA Aptamer-Based Solid Phase Extraction Column,” Food Chemistry, Vol. 127, No. 3, 2011, pp. 1378-1384. http://dx.doi.org/10.1016/j.foodchem.2011.01.107 [7] H. P. Van Egmond and A. R. O. Jonker, “Worldwide Regulations for Mycotoxins in Food and Feed in 2003,” FAO Food and Nutrition Paper 81, Report of the Food and Agriculture Organization of the United Nations, Rome, 2004. [8] A. Fernandez, R. Belio, J. J. Ramos, M. C. Sanz and T. Saez, “Aflatoxins and Their Metabolites in the Tissues, Faeces and Urine from Lambs Feeding on an Aflatoxin- Contaminated Diet,” Journal of the Science of Food and Agriculture, Vol. 74, No. 2, 1997, pp. 161-168. http://dx.doi.org/10.1002/(SICI)1097-0010(199706)74:2< 161::AID-JSFA783>3.0.CO;2-D [9] J. Jaimez, C. A. Fente, B. I. Vazquez, C. M. Franco, A. Capeda, G. Mahhuzier and P. Prognon, “Application of the Assay of Aflatoxins by Liquid Chromatography with Fluorescence Detection in Food Analysis,” Journal of Chromatography A, Vol. 882, No. 1-2, 2000, pp. 1-10. http://dx.doi.org/10.1016/S0021-9673(00)00212-0 Open Access OJAB  K. SPINELLA ET AL. 118 [10] S. Piermarini, L. Micheli, N. H. S. Ammida, G. Palleschi and D. Moscone, “Electrochemical Immunosensor Array Using a 69-Well Screen-Printed Microplate for Aflatoxin B1 Detection,” Biosensors & Bioelectronics, Vol. 22, No. 7, 2007, pp. 1434-1440. http://dx.doi.org/10.1016/j.bios.2006.06.029 [11] J. Stroka and E. Anklam, “New Strategies for the Screen- ing and Determination of Aflatoxins and the Detection of Aflatoxin-Producing Moulds in Food and Feed,” TrAC Trends in Analytical Chemistry, Vol. 21, No. 2, 2002, pp. 90-95. http://dx.doi.org/10.1016/S0165-9936(01)00133-9 [12] S. Piermarini, G. Volpe, F. Ricci, L. Micheli, D. Moscone, G. Palleschi, M. Fuhrer, R. Krska and S. Baumgartner, “Rapid Screening Electrochemical Methods for Aflatoxin B1 and Type-A Trichothecenes: A Preliminary Study,” Analytical Letters, Vol. 40, No. 7, 2007, pp. 1333-1346. http://dx.doi.org/10.1080/00032710701326692 [13] L. Micheli, R. Grecco, M. Badea, D. Moscone and G. Palleschi, “An Electrochemical Immunosensor for Afla- toxin M1 Determination in Milk Using Screen Printed Electrodes,” Biosensor and Bioelectronics, Vol. 21, 2006, pp. 1424-1433. [14] T. K. Dutta and P. Das, “Isolation of Aflatoxigenic Strains of Aspergillus and Detection of Aflatoxin B1 from Feeds in India,” Mycopathologia, Vol. 151, No. 1, 2000, pp. 29- 33. http://dx.doi.org/10.1023/A:1010960402254 [15] H. Ayciek, A. Aksoy and S. Saygi, “Determination of Aflatoxin Levels in Some Dairy and Food Products Con- sumed in Ankara, Turkey,” Food Control, Vol. 16, No. 3, 2005, pp. 263-266. http://dx.doi.org/10.1016/j.foodcont.2004.03.004 [16] H. Zheng, C. W. Humphney, R. S. King and J. L. Richard, “A Review of Rapid Methods for the Analysis of Afla- toxins,” Mycopathologia, Vol. 159, 2005, pp. 1-9. [17] T. Yaroglu, H. H. Oruc and M. Tayar, “Aflatoxin M1 Le- vels in Cheese Samples from Some Provinces of Turkey,” Food Control, Vol. 16, No. 10, 2005, pp. 883-885. http://dx.doi.org/10.1016/j.foodcont.2004.08.001 [18] A. Y. Kolosova, W. B. Shim, Z. Y. Yang, S. A. Eremin and D. H. Chung, “Direct Competitive ELISA Based on a Monoclonal Antibody for Detection of Aflatoxin B1. Sta- bilization of ELISA Kit Components and Application to Grain Samples,” Analytical and Bioanalytical Chemistry, Vol. 384, No. 1, 2006, pp. 286-294. http://dx.doi.org/10.1007/s00216-005-0103-9 [19] S. Rastogi, P. D. Divedi, S. K.. Khanna and M. Das, “De- tection of Aflatoxin M1 Contamination in Milk and Infant Milk Products from Indian Markets by ELISA,” Food Control, Vol. 15, 2004, pp. 287-290. [20] R. M. Pemberton, R. Pittson, N. Biddle, G. A. Drago and J. P. Hart, “Studies towards the Development of a Screen- Printed Carbon Electrochemical Immunosensor Array for Mycotoxins: A Sensor for Aflatoxin B1,” Analytical Let- ters, Vol. 39, No. 8, 2006, pp. 1573-1586. http://dx.doi.org/10.1080/00032710600713289 [21] J. H. O. Owino, A. Ignaszak, A. Al-Ahmed, P. G. L. Ba- ker, H. Alemu, J. C. Ngila and E. I. Iwuoha, “Modelling of the Impedimetric Responses of an Aflatoxin B1 Im- munosensor Prepared on an Electrosynthetic Polyaniline Platform,” Analytical and Bioanalytical Chemistry, Vol. 388, No. 5-6, 2007, pp. 1069-1074. http://dx.doi.org/10.1007/s00216-007-1333-9 [22] N. Adanyi, I. A. Levkovets, S. Rodriguez-Gil, A. Ronald, M. Varadi and I. Szendro, “Development of Immunosen- sor Based on OWLS Technique for determining Aflatoxin B1 and Ochratoxin A,” Biosensor and Bioelectronics, Vol. 22, No. 6, 2007, pp. 797-802. http://dx.doi.org/10.1016/j.bios.2006.02.015 [23] A. Sun, Q. Qi, Z. L. Dong and K. Z. Liang, “An Electro- chemical Enzyme Immunoassay for Aflatoxin B1 Based on Bio-Electrocatalytic Reaction with Room-Temperature Ionic Liquid and Nanoparticle Modified Electrodes,” Sensing and Instrumentation for Food Quality and Safety, Vol. 2, No. 1, 2008, pp. 43-50. http://dx.doi.org/10.1007/s11694-008-9040-6 [24] J. Ren, F. He, S. Yi and X. Cui, “A New MSPQC for Rapid Growth and Detection of Mycobacterium tubercu- losis,” Biosensors and Bioelectronics, Vol. 24, No. 3, 2008, pp. 403-409. http://dx.doi.org/10.1016/j.bios.2008.04.018 [25] X. Tu, Q. Xie, S. Jiang and S. Yao, “Electrochemical Quartz Crystal Impedance Study on the Overoxidation of Polypyrrole-Carbon Nanotubes Composite Film for Am- perometric Detection of Dopamine,” Biosensors and Bio- electronics, Vol. 22, No. 12, 2007, pp. 2819-2826. http://dx.doi.org/10.1016/j.bios.2006.11.022 [26] S. F. Chou, W. L. J. Hsu, M. Hwang and C. Y. Chen, “De- termination of Alpha-Fetoprotein in Human Serum by a Quartz Crystal Microbalance-Based Immunosensor,” Cli- nical Chemistry, Vol. 48, 2002, pp. 913-918. [27] B. Zhang, Q. Mao, X. Zhang, T. Jiang, M. Chen, F. Yu and W. Fu, “A Novel Piezoelectric Quartz Micro-Array Immunosensor Based on Self-Assembled Monolayer for Determination of Human Chorionic Gonadotropin,” Bio- sensors and Bioelectronics, Vol. 15, 2004, pp. 711-720. http://dx.doi.org/10.1016/S0956-5663(03)00260-4 [28] G. Z. Sauerbrey, “Use of Quartz Vibration for Weighing Thin Films on a Microbalance,” Journal of Physik, Vol. 155, 1959, pp. 206-212. Open Access OJAB K. SPINELLA ET AL. 119 Biographies Katia Spinella received her MSc degree in industrial biotechnology from University of Rome, TorVergata, in 2012. She is pursuing her PhD in materials for health, environment and energy in the University of RomeTor- Vergata. She is currently working onthe development aptamers based biosensors for food contaminants. Lucia Mosiello received her MSc degree in biology from University of Rome, Sapienza, in 1986. Since 1990 she is a senior researcher at ENEA, Italian National Agency for New Technologies, Energy and Sustainable Economic Development, Department of Biotecnology, Laboratory of Agroindustry Innovation. Her research in- terests include biosensors, chemosensors, nanotechno- logy and study of biomolecular interactions using quartz crystal microbalance. Giuseppe Palleschi is the head of Chemistry Depart- ment of the University of Rome “Tor Vergata”. Since 1989 member of the Scientific Committee for the “Emer- gency Plan for National Defense Pollution of hydrocar- bons or other harmful substances caused by marine acci- dents”, Department of Civil Protection of the Presidency of the Council of Ministers. The activity of prof. Pal- leschi, Professor of Analytical Chemistry, is mainly fo- cused on the development and application of chemical sensors, biosensors and immunosensors for food, envi- ronmental and clinical analysis. Fabio Vitali is a senior researcher at ENEA, Italian National Agency for New Technologies, Energy and Su- stainable Economic Development, Laboratory of Agro- industry Innovation. He is participating to most of those National and European projects on biosensors in which ENEA is involved. The activities include basic research for the advancement of the frontiers of knowledge, the development and transfer of technology “enabling” a multi-sectoral and boosting industrial research, method- ologies, services and systems approaches to support the processes of innovation and competitiveness of defined territorial contexts. Open Access OJAB
|