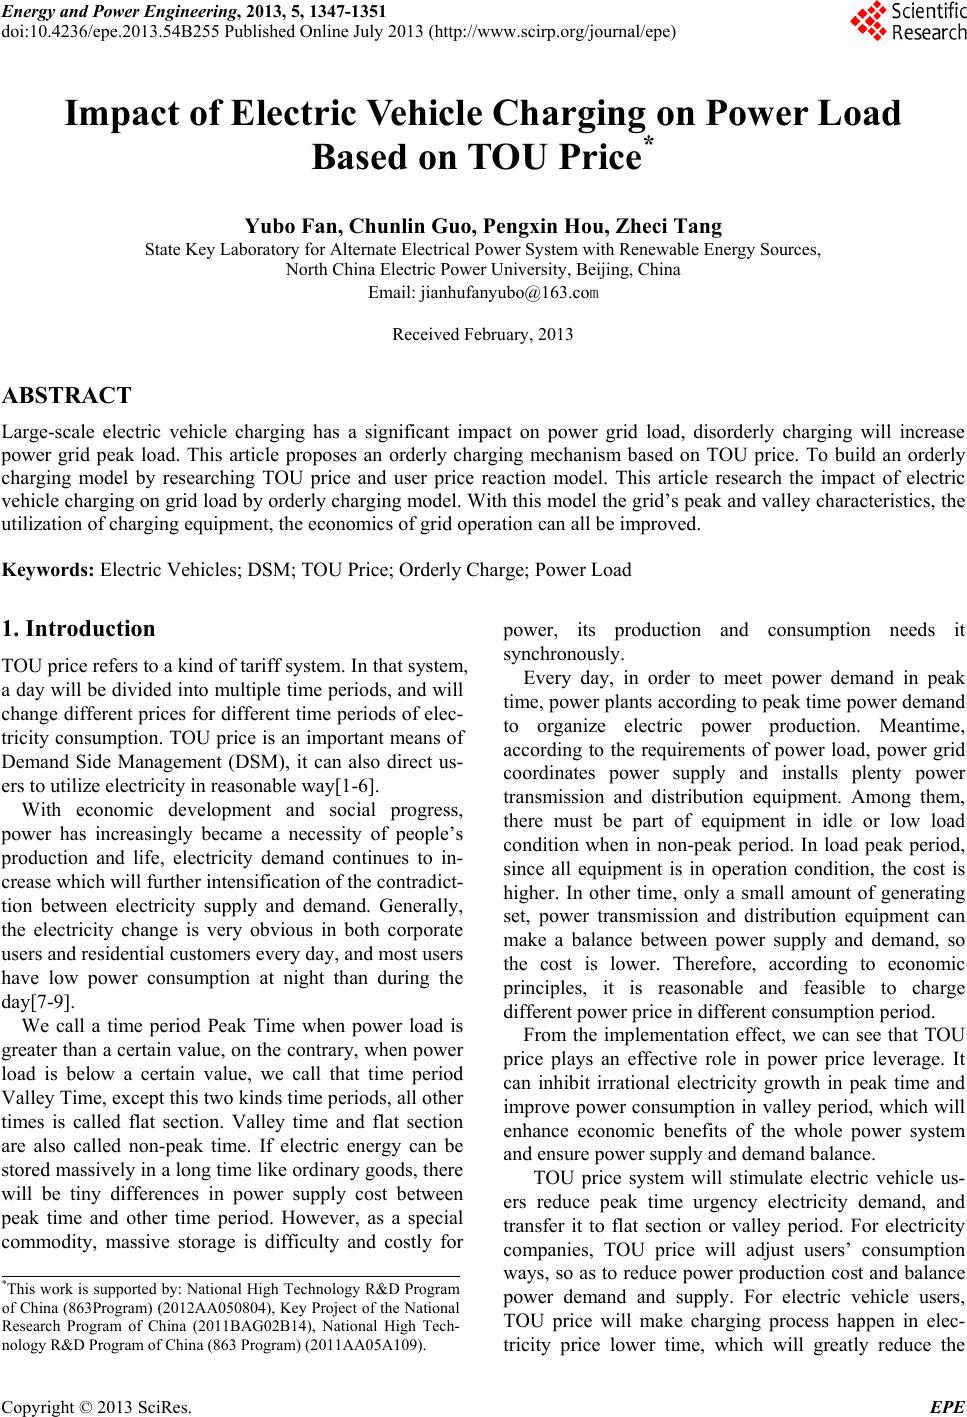
 Energy and Power Engineering, 2013, 5, 1347-1351 doi:10.4236/epe.2013.54B255 Published Online July 2013 (http://www.scirp.org/journal/epe) Impact of Electric Vehicle Charging on Power Load Based on TOU Price* Yubo Fan, Chunlin Guo, Pengxin Hou, Zheci Tang State Key Laboratory for Alternat e El ectrical Power Sy stem with Renewable E n ergy Sources, North China Electric Power University, Beijing, China Email: jianhufanyubo@163.com Received February, 2013 ABSTRACT Large-scale electric vehicle charging has a significant impact on power grid load, disorderly charging will increase power grid peak load. This article proposes an orderly charging mechanism based on TOU price. To build an orderly charging model by researching TOU price and user price reaction model. This article research the impact of electric vehicle charging on grid load by orderly charging model. With this model the grid’s peak and valley characteristics, the utilization of charg ing equipment, the economics of grid operation can all be improved. Keywords: Electric Vehicles; DSM; TOU Price; Orderly Charge; Power Load 1. Introduction TOU price refers to a kind of tariff system. In that system, a day will be divided into multiple time periods, and will change different prices for different time periods of elec- tricity consumption. TOU price is an important means of Demand Side Management (DSM), it can also direct us- ers to utilize electricity in reasonable way[1-6]. With economic development and social progress, power has increasingly became a necessity of people’s production and life, electricity demand continues to in- crease which will further intensification of the contradict- tion between electricity supply and demand. Generally, the electricity change is very obvious in both corporate users and residential customers every day, and most users have low power consumption at night than during the day[7-9]. We call a time period Peak Time when power load is greater than a certain value, on the contrary, when power load is below a certain value, we call that time period Valley Time, except this two kinds time periods, all other times is called flat section. Valley time and flat section are also called non-peak time. If electric energy can be stored massively in a long time like ord inary good s, there will be tiny differences in power supply cost between peak time and other time period. However, as a special commodity, massive storage is difficulty and costly for power, its production and consumption needs it synchronously. Every day, in order to meet power demand in peak time, power plants according to peak time power demand to organize electric power production. Meantime, according to the requirements of power load, power grid coordinates power supply and installs plenty power transmission and distribution equipment. Among them, there must be part of equipment in idle or low load condition when in non-peak period. In load peak period, since all equipment is in operation condition, the cost is higher. In other time, only a small amount of generating set, power transmission and distribution equipment can make a balance between power supply and demand, so the cost is lower. Therefore, according to economic principles, it is reasonable and feasible to charge different power price in different consumption period. From the implementation effect, we can see that TOU price plays an effective role in power price leverage. It can inhibit irrational electricity growth in peak time and improve power con sumption in valley period, which will enhance economic benefits of the whole power system and ensure power supply and demand balance. TOU price system will stimulate electric vehicle us- ers reduce peak time urgency electricity demand, and transfer it to flat section or valley period. For electricity companies, TOU price will adjust users’ consumption ways, so as to reduce power production cost and balance power demand and supply. For electric vehicle users, TOU price will make charging process happen in elec- tricity price lower time, which will greatly reduce the *This work is supported by: National High Technology R&D Program of China (863Program) (2012AA050804), Key Project of the National Research Program of China (2011BAG02B14), National High Tech- nology R&D Program of China (863 Program) (2011AA05A109). Copyright © 2013 SciRes. EPE 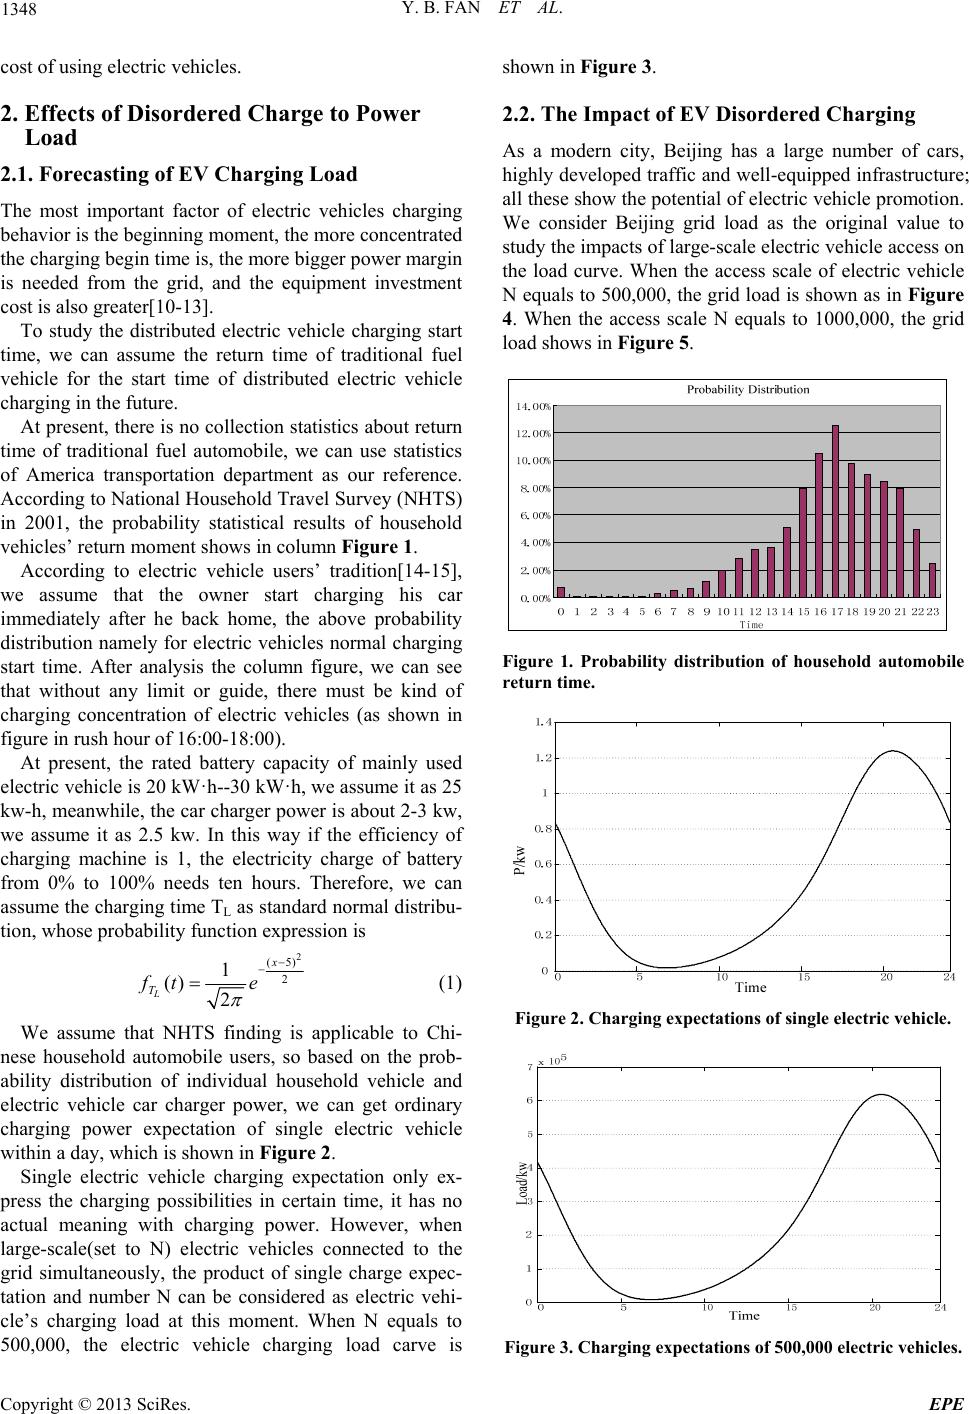 Y. B. FAN ET AL. 1348 cost of using electric vehicles. 2. Effects of Disordered Charge to Power Load 2.1. Forecasting of EV Charging Load The most important factor of electric vehicles charging behavior is the beginning moment, the more concentrated the charging begin time is, the more bigger power margin is needed from the grid, and the equipment investment cost is also greater[10- 13]. To study the distributed electric vehicle charging start time, we can assume the return time of traditional fuel vehicle for the start time of distributed electric vehicle charging in the future. At present, there is no coll ection statistics about return time of traditional fuel automobile, we can use statistics of America transportation department as our reference. According to National Household Travel Survey (NHTS) in 2001, the probability statistical results of household vehicles’ return moment shows in column Figure 1. According to electric vehicle users’ tradition[14-15], we assume that the owner start charging his car immediately after he back home, the above probability distribution namely for electric vehicles normal charging start time. After analysis the column figure, we can see that without any limit or guide, there must be kind of charging concentration of electric vehicles (as shown in figure in rush hour of 16:00-18:00). At present, the rated battery capacity of mainly used electric vehicle is 20 kW·h--30 kW·h, we assume it as 25 kw-h, meanwhile, the car charger power is about 2-3 kw, we assume it as 2.5 kw. In this way if the efficiency of charging machine is 1, the electricity charge of battery from 0% to 100% needs ten hours. Therefore, we can assume the charging time TL as standard normal distribu- tion, whose probability func tion expression is 2 (5) 2 1 () 2 L x T ft e (1) We assume that NHTS finding is applicable to Chi- nese household automobile users, so based on the prob- ability distribution of individual household vehicle and electric vehicle car charger power, we can get ordinary charging power expectation of single electric vehicle within a day, which is sho wn in Figure 2. Single electric vehicle charging expectation only ex- press the charging possibilities in certain time, it has no actual meaning with charging power. However, when large-scale(set to N) electric vehicles connected to the grid simultaneously, the product of single charge expec- tation and number N can be considered as electric vehi- cle’s charging load at this moment. When N equals to 500,000, the electric vehicle charging load carve is shown in Figure 3. 2.2. The Impact of EV Disordered Charging As a modern city, Beijing has a large number of cars, highly developed traffic and well-equipped infrastructure; all these show the potential of electric vehicle promotion. We consider Beijing grid load as the original value to study the impacts of large-scale electric vehicle access on the load curve. When the access scale of electric vehicle N equals to 500,000, the grid load is shown as in Figure 4. When the access scale N equals to 1000,000, the grid load shows in Figure 5. Figure 1. Probability distribution of household automobile return time. Figure 2. Charging expectations of single electric vehicle. Figure 3. Charging expectations of 500,000 electric vehicles. Copyright © 2013 SciRes. EPE 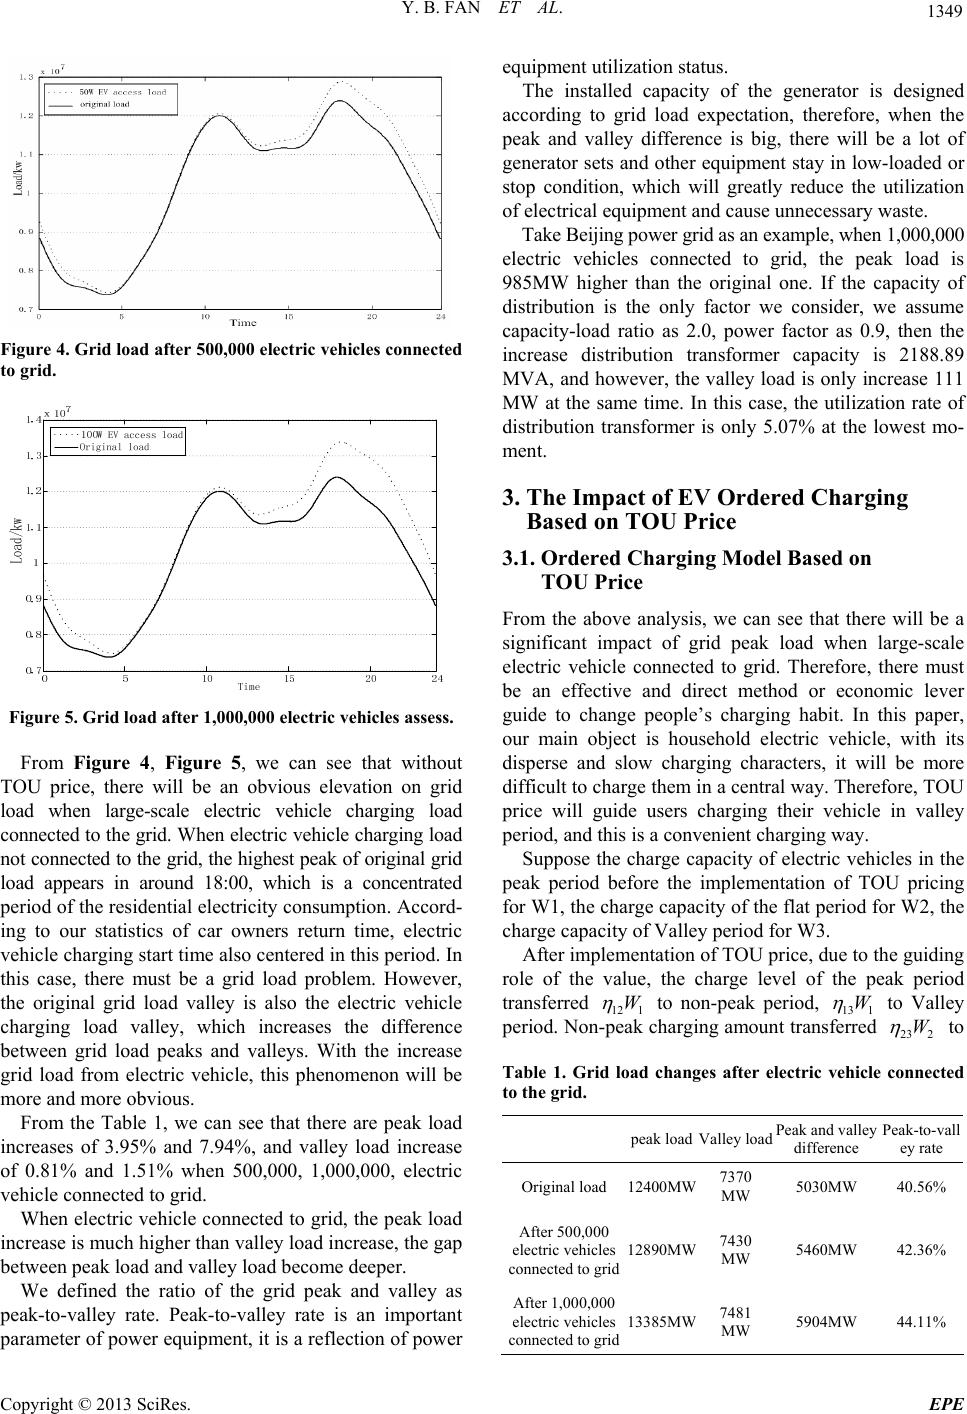 Y. B. FAN ET AL. 1349 Figure 4. Grid load after 500,000 electric vehicles connected to grid. Figure 5. Grid load after 1,000,000 electric vehicles assess. From Figure 4, Figure 5, we can see that without TOU price, there will be an obvious elevation on grid load when large-scale electric vehicle charging load connected to the grid. When electric vehic le charging load not connected to the grid, the highest peak of original grid load appears in around 18:00, which is a concentrated period of the residential electricity consumption. Accord- ing to our statistics of car owners return time, electric vehicle charging start time also centered in this period. In this case, there must be a grid load problem. However, the original grid load valley is also the electric vehicle charging load valley, which increases the difference between grid load peaks and valleys. With the increase grid load from electric vehicle, this phenomenon will be more and more obvious. From the Table 1, we can see that there are peak load increases of 3.95% and 7.94%, and valley load increase of 0.81% and 1.51% when 500,000, 1,000,000, electric vehicle connected to grid. When electric vehicle connected to grid, the peak load increase is much higher than valley load increase, the gap between p eak load and v alley load become deeper. We defined the ratio of the grid peak and valley as peak-to-valley rate. Peak-to-valley rate is an important parameter of power equipment, it is a reflection of power equipment utilization status. The installed capacity of the generator is designed according to grid load expectation, therefore, when the peak and valley difference is big, there will be a lot of generator sets and other equipment stay in low-loaded or stop condition, which will greatly reduce the utilization of electrical equipment and cause unnecessary waste. Take Beijing power grid as an example, when 1,000,000 electric vehicles connected to grid, the peak load is 985MW higher than the original one. If the capacity of distribution is the only factor we consider, we assume capacity-load ratio as 2.0, power factor as 0.9, then the increase distribution transformer capacity is 2188.89 MVA, and however, the valley load is only increase 111 MW at the same time. In this case, the utilization rate of distribution transformer is only 5.07% at the lowest mo- ment. 3. The Impact of EV Ordered Charging Based on TOU Price 3.1. Ordered Charging Model Based on TOU Price From the above analysis, we can see that there will be a significant impact of grid peak load when large-scale electric vehicle connected to grid. Therefore, there must be an effective and direct method or economic lever guide to change people’s charging habit. In this paper, our main object is household electric vehicle, with its disperse and slow charging characters, it will be more difficult to charge them in a central way. Therefore, TOU price will guide users charging their vehicle in valley period, and this is a convenient charging way. Suppose the charge capacity of electric vehicles in the peak period before the implementation of TOU pricing for W1, the charge capacity of the flat period for W2, the charge capacity of Valley period for W3. After implementation of TOU price, due to the guiding role of the value, the charge level of the peak period transferred 12 1 W to non-peak period, 13 1 W to Valley period. Non-peak charging amount transferred 23 2 W to Table 1. Grid load changes after electric vehicle connected to the grid. peak loadValley load Peak and valley difference Peak-to-vall ey rate Original load 12400MW7370 MW 5030MW 40.56% After 500,000 electric vehicles connected to grid12890MW 7430 MW 5460MW 42.36% After 1,000,000 electric vehicles connected to grid13385MW 7481 MW 5904MW 44.11% Copyright © 2013 SciRes. EPE 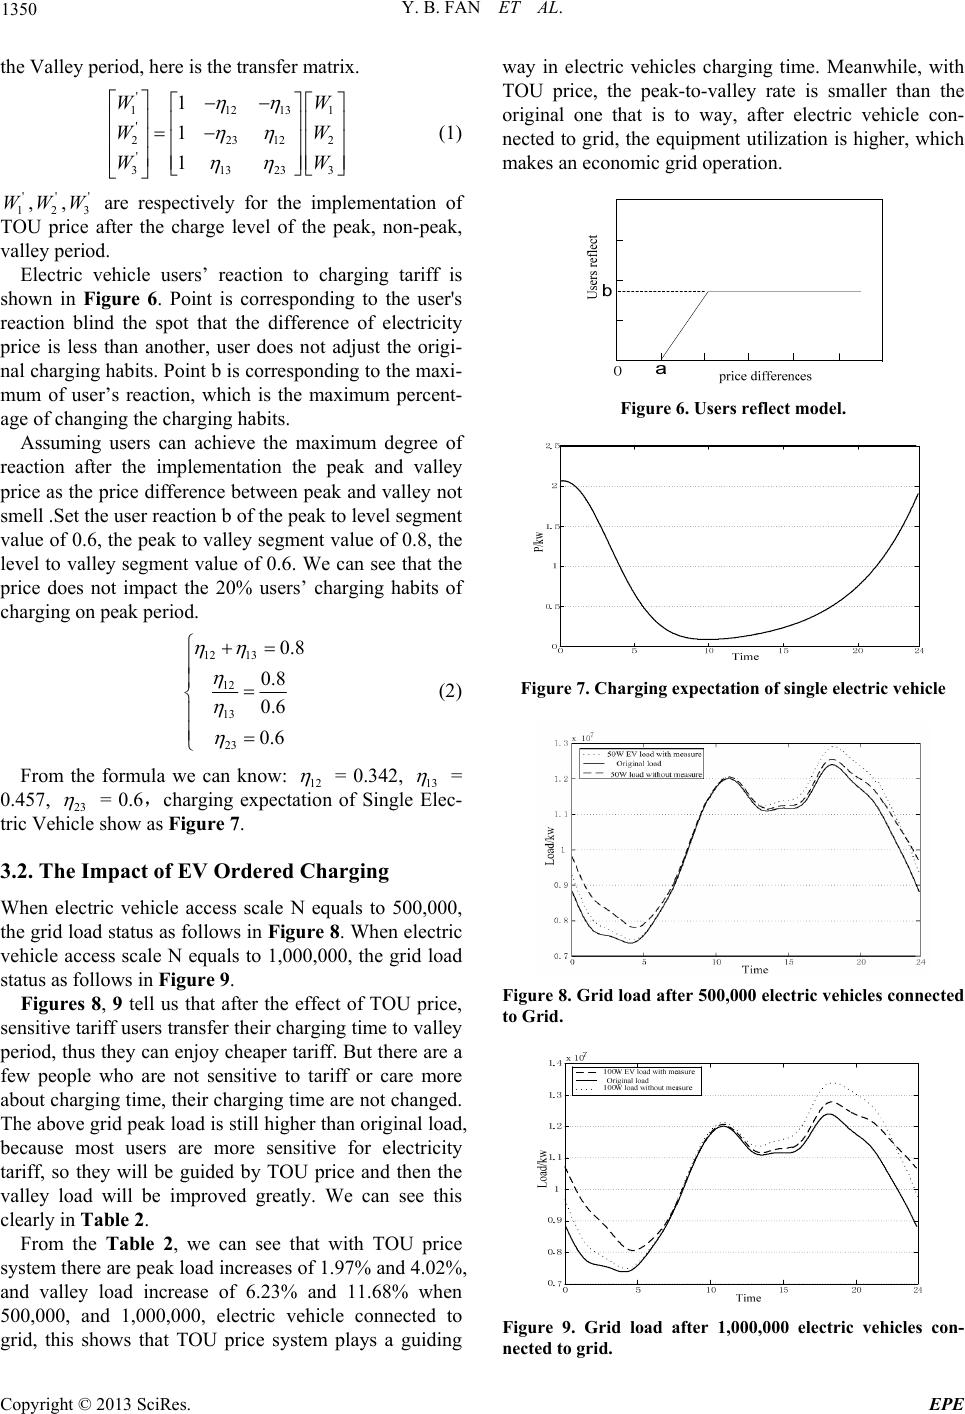 Y. B. FAN ET AL. 1350 the Valley period, here is the transfer matrix. ' 11213 ' 22312 ' 31323 1 1 1 W W W 1 2 3 W W W (1) ' 1 W, , are respectively for the implementation of TOU price after the charge level of the peak, non-peak, valley period. ' 2 W' 3 W Electric vehicle users’ reaction to charging tariff is shown in Figure 6. Point is corresponding to the user's reaction blind the spot that the difference of electricity price is less than another, user does not adjust the origi- nal charging habits. Po int b is corresponding to the maxi- mum of user’s reaction, which is the maximum percent- age of changing the charging habits. Assuming users can achieve the maximum degree of reaction after the implementation the peak and valley price as the price difference between peak and valley not smell .Set the user reaction b of the peak to level segment value of 0.6, the peak to valley segment value of 0.8, the level to valley segment value of 0.6. We can see that the price does not impact the 20% users’ charging habits of charging o n peak period. 12 13 12 13 23 0.8 0.8 0.6 0.6 (2) From the formula we can know: 12 = 0.342, 13 = 0.457, 23 = 0.6,charging expectation of Single Elec- tric Vehicle show as Fi gure 7. 3.2. The Impact of EV Ordered Charging When electric vehicle access scale N equals to 500,000, the grid load status as follows in Figure 8. When electric vehicle access scale N equals to 1,000,000, the grid load status as follows in Figure 9. Figures 8, 9 tell us that after the effect of TOU price, sensitive tariff users transfer their charg ing time to valley period, thus they can enjoy cheaper tariff. But there are a few people who are not sensitive to tariff or care more about charging time, their charging time are not changed. The above grid peak load is still higher th an original load, because most users are more sensitive for electricity tariff, so they will be guided by TOU price and then the valley load will be improved greatly. We can see this clearly in Table 2. From the Table 2, we can see that with TOU price system there are peak load increases of 1.97% and 4.02%, and valley load increase of 6.23% and 11.68% when 500,000, and 1,000,000, electric vehicle connected to grid, this shows that TOU price system plays a guiding way in electric vehicles charging time. Meanwhile, with TOU price, the peak-to-valley rate is smaller than the original one that is to way, after electric vehicle con- nected to grid, the equipment utilization is higher, which makes an economic grid operation. Figure 6. Users reflect model. Figure 7. Charging expectation of single electric vehicle Figure 8. Grid load after 500,000 electric vehicles connected to Grid. Figure 9. Grid load after 1,000,000 electric vehicles con- nected to grid. Copyright © 2013 SciRes. EPE 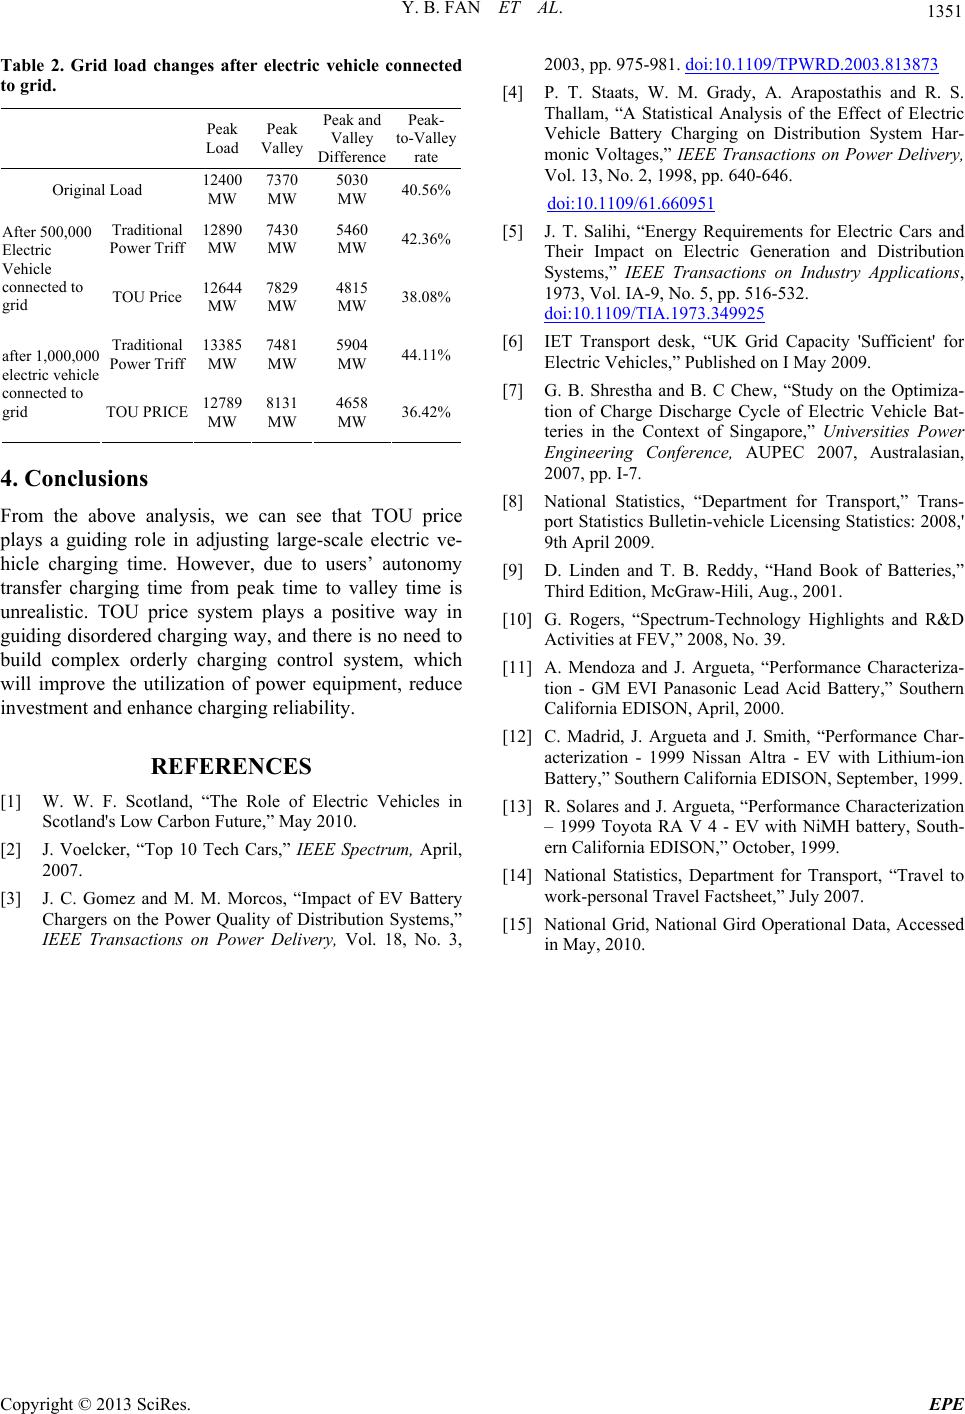 Y. B. FAN ET AL. Copyright © 2013 SciRes. EPE 1351 changes after electric vehicle conn Peak Peak Peak and D Peak- to-Valley Table 2. Grid loadected to grid. Load Valley Valley ifference rate Original Load 1240 40. 0 MW 7370 MW 5030 MW 56% Traditional 42.36% After 500,000 o TOU Price 126447829 4815 38. Traditional 133857481 5904 44. after 1,000,000 TOU PRICE 127898131 4658 36.42% Power Triff 12890 MW 7430 MW 5460 MW Electric Vehicle connected t grid MW MW MW 08% Power Triff MWMW MW 11% electric vehicle connected to grid MW MW MW 4. Conclusions alysis, we can see that TOU price REFERENCES [1] W. W. F. Sclectric Vehicles in ctrum, April, omez and M. M. Morcos, “Impact of EV Ba From the above an plays a guiding role in adjusting large-scale electric ve- hicle charging time. However, due to users’ autonomy transfer charging time from peak time to valley time is unrealistic. TOU price system plays a positive way in guiding disordered charging way, and there is no need to build complex orderly charging control system, which will improve the utilization of power equipment, reduce investment and enhance charging reliability. otland, “The Role of E Scotland's Low Carbon Future,” May 2010. [2] J. Voelcker, “Top 10 Tech Cars,” IEEE Spe 2007. [3] J. C. Gttery Chargers on the Power Quality of Distribution Systems,” IEEE Transactions on Power Delivery, Vol. 18, No. 3, 2003, pp. 975-981. doi:10.1109/TPWRD.2003.813873 [4] P. T. Staats, W. M. Grady, A. Arapostathis and R. S. Thallam, “A Statistical Analysis of the Effect of Electric Vehicle Battery Charging on Distribution System Har- monic Voltages,” IEEE Transactions on Power Delivery, 6. Vol. 13, No. 2, 1998, pp. 640-64 doi:10.1109/61.660951 [5] J. T. Salihi, “Energy Requirements for Electric Cars and Their Impact on Electric Generation and Distribution Systems,” IEEE Transactions on Indu 1973, Vol. IA-9, No. 5, pp. 516-stry Applications, 532. doi:10.1109/TIA.1973.349925 [6] IET Transport desk, “UK Grid Capacity 'Sufficient' for onference, AUPEC 2007, Australasian, lletin-vehicle Licensing Statistics: 2008,' of Batteries,” Highlights and R&D cid Battery,” Southern battery, South- , “Travel to National Gird Operational Data, Accessed in May, 2010. Electric Vehicles,” Published on I May 2009. [7] G. B. Shrestha and B. C Chew, “Study on the Optimiza- tion of Charge Discharge Cycle of Electric Vehicle Bat- teries in the Context of Singapore,” Universities Power Engineering C 2007, pp. I-7. [8] National Statistics, “Department for Transport,” Trans- port Statistics Bu 9th April 2009. [9] D. Linden and T. B. Reddy, “Hand Book Third Edition, McGraw-Hili, Aug., 2001. [10] G. Rogers, “Spectrum-Technology Activities at FEV,” 2008, No. 39. [11] A. Mendoza and J. Argueta, “Performance Characteriza- tion - GM EVI Panasonic Lead A California EDISON, April, 2000. [12] C. Madrid, J. Argueta and J. Smith, “Performance Char- acterization - 1999 Nissan Altra - EV with Lithium-ion Battery,” Southern California EDISON, September, 1999. [13] R. Solares and J. Argueta, “Performance Characterization – 1999 Toyota RA V 4 - EV with NiMH ern California EDISON,” October, 1999. [14] National Statistics, Department for Transport work-personal Travel Factsheet,” July 2007. [15] National Grid,
|