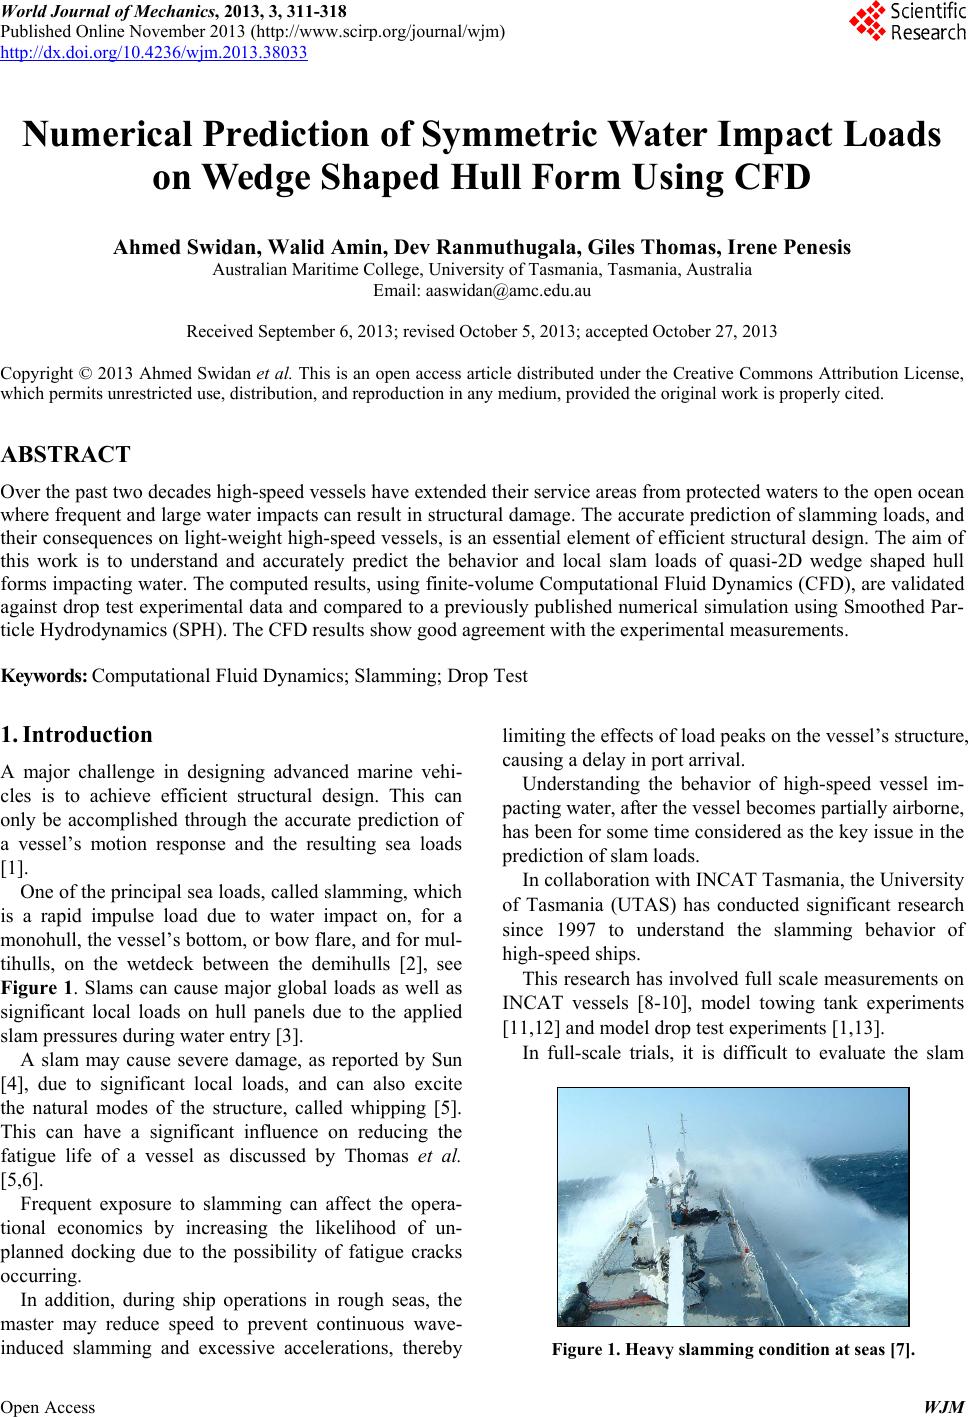
 World Journal of Mechanics, 2013, 3, 311-318 Published Online November 2013 (http://www.scirp.org/journal/wjm) http://dx.doi.org/10.4236/wjm.2013.38033 Open Access WJM Numerical Prediction of Symmetric Water Impact Loads on Wedge Shaped Hull Form Using CFD Ahmed Swidan, Walid Amin, Dev Ranmuthugala, Giles Thomas, Irene Penesis Australian Maritime College, University of Tasmania, Tasmania, Australia Email: aaswidan@amc.edu.au Received September 6, 2013; revised October 5, 2013; accepted October 27, 2013 Copyright © 2013 Ahmed Swidan et al. This is an open access article distributed under the Creative Commons Attribution License, which permits unrestricted use, distribution, and reproduction in any medium, provided the original work is properly cited. ABSTRACT Over the past two decades high-speed vessels have extended their service areas from protected waters to the open ocean where frequent and large water impacts can result in structural damage. The accurate prediction of slamming loads, and their consequences on light-weight high-speed vessels, is an essential element of efficient structural design. The aim of this work is to understand and accurately predict the behavior and local slam loads of quasi-2D wedge shaped hull forms impacting water. The computed results, using finite-volume Computational Fluid Dynamics (CFD), are validated against drop test experimental data and compared to a previously published numerical simulation using Smoothed Par- ticle Hydrodynamics (SPH). The CFD results show good agreement with the experimental measurements. Keywords: Computational Fluid Dynamics; Slamming; Drop Test 1. Introduction A major challenge in designing advanced marine vehi- cles is to achieve efficient structural design. This can only be accomplished through the accurate prediction of a vessel’s motion response and the resulting sea loads [1]. One of the principal sea loads, called slamming, which is a rapid impulse load due to water impact on, for a monohull, the vessel’s bottom, or bow flare, and for mul- tihulls, on the wetdeck between the demihulls [2], see Figure 1. Slams can cause major global loads as well as significant local loads on hull panels due to the applied slam pressures during water entry [3]. A slam may cause severe damage, as reported by Sun [4], due to significant local loads, and can also excite the natural modes of the structure, called whipping [5]. This can have a significant influence on reducing the fatigue life of a vessel as discussed by Thomas et al. [5,6]. Frequent exposure to slamming can affect the opera- tional economics by increasing the likelihood of un- planned docking due to the possibility of fatigue cracks occurring. In addition, during ship operations in rough seas, the master may reduce speed to prevent continuous wave- induced slamming and excessive accelerations, thereby limiting the effects of load peaks on the vessel’s structure, causing a delay in port arrival. Understanding the behavior of high-speed vessel im- pacting water, after the vessel becomes partially airborne, has been for some time considered as the key issue in the prediction of slam loads. In collaboration with INCAT Tasmania, the University of Tasmania (UTAS) has conducted significant research since 1997 to understand the slamming behavior of high-speed ships. This research has involved full scale measurements on INCAT vessels [8-10], model towing tank experiments [11,12] and model drop test experiments [1,13]. In full-scale trials, it is difficult to evaluate the slam Figure 1. Heavy slamming condition at seas [7]. 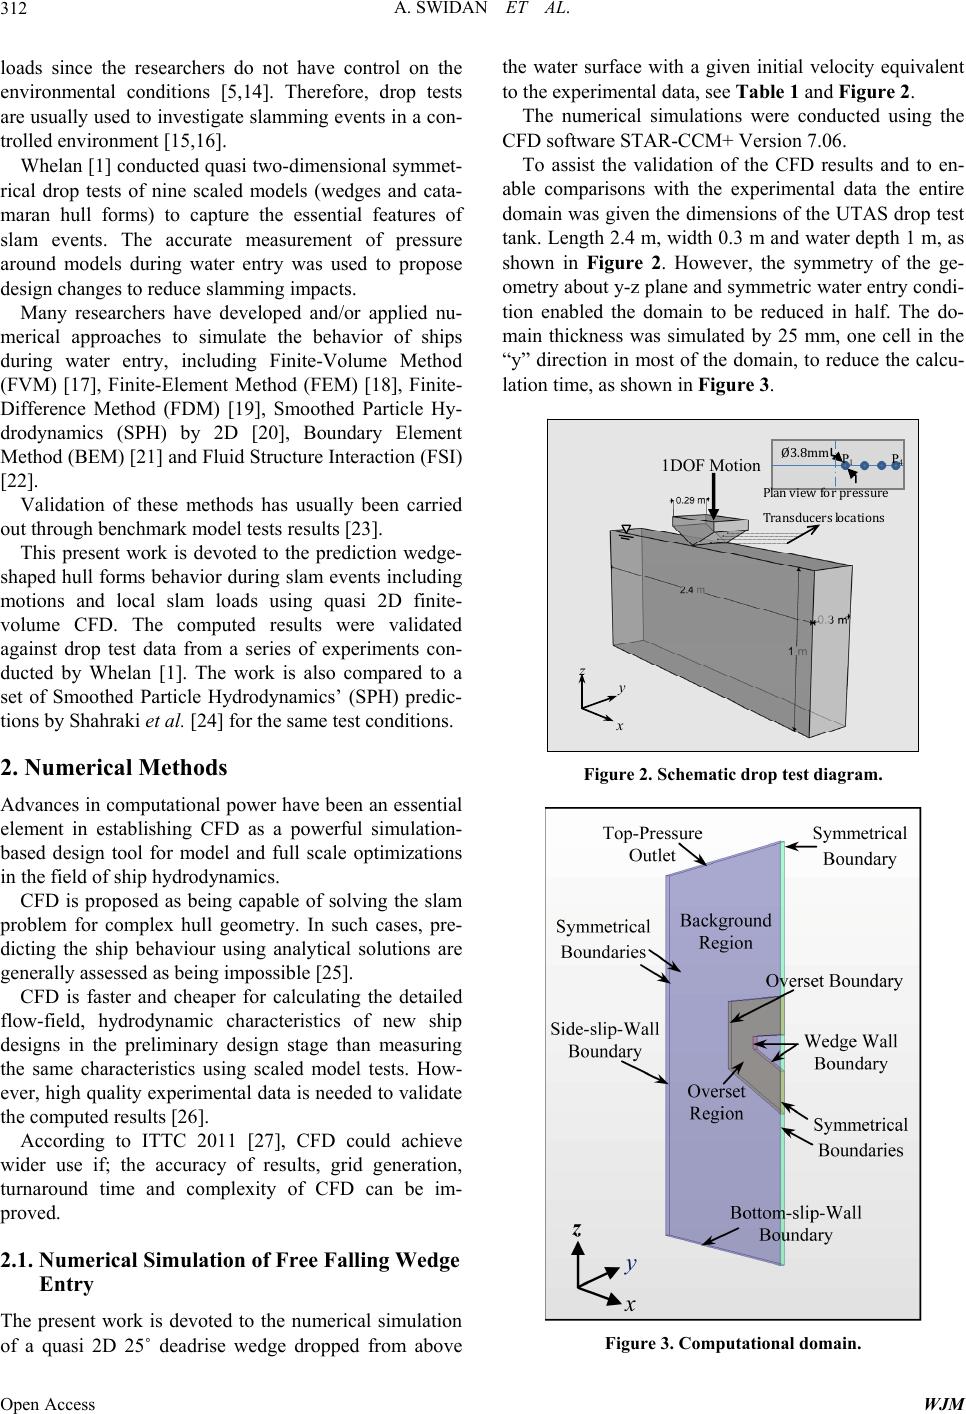 A. SWIDAN ET AL. 312 loads since the researchers do not have control on the environmental conditions [5,14]. Therefore, drop tests are usually used to investigate slamming events in a con- trolled environment [15,16]. Whelan [1] conducted quasi two-dimensional symmet- rical drop tests of nine scaled models (wedges and cata- maran hull forms) to capture the essential features of slam events. The accurate measurement of pressure around models during water entry was used to propose design changes to reduce slamming impacts. Many researchers have developed and/or applied nu- merical approaches to simulate the behavior of ships during water entry, including Finite-Volume Method (FVM) [17], Finite-Element Method (FEM) [18], Finite- Difference Method (FDM) [19], Smoothed Particle Hy- drodynamics (SPH) by 2D [20], Boundary Element Method (BEM) [21] and Fluid Structure Interaction (FSI) [22]. Validation of these methods has usually been carried out through benchmark model tests results [23]. This present work is devoted to the prediction wedge- shaped hull forms behavior during slam events including motions and local slam loads using quasi 2D finite- volume CFD. The computed results were validated against drop test data from a series of experiments con- ducted by Whelan [1]. The work is also compared to a set of Smoothed Particle Hydrodynamics’ (SPH) predic- tions by Shahraki et al. [24] for the same test conditions. 2. Numerical Methods Advances in computational power have been an essential element in establishing CFD as a powerful simulation- based design tool for model and full scale optimizations in the field of ship hydrodynamics. CFD is proposed as being capable of solving the slam problem for complex hull geometry. In such cases, pre- dicting the ship behaviour using analytical solutions are generally assessed as being impossible [25]. CFD is faster and cheaper for calculating the detailed flow-field, hydrodynamic characteristics of new ship designs in the preliminary design stage than measuring the same characteristics using scaled model tests. How- ever, high quality experimental data is needed to validate the computed results [26]. According to ITTC 2011 [27], CFD could achieve wider use if; the accuracy of results, grid generation, turnaround time and complexity of CFD can be im- proved. 2.1. Numerical Simulation of Free Falling Wedge Entry The present work is devoted to the numerical simulation of a quasi 2D 25˚ deadrise wedge dropped from above the water surface with a given initial velocity equivalent to the experimental data, see Table 1 and Figure 2. The numerical simulations were conducted using the CFD software STAR-CCM+ Version 7.06. To assist the validation of the CFD results and to en- able comparisons with the experimental data the entire domain was given the dimensions of the UTAS drop test tank. Length 2.4 m, width 0.3 m and water depth 1 m, as shown in Figure 2. However, the symmetry of the ge- ometry about y-z plane and symmetric water entry condi- tion enabled the domain to be reduced in half. The do- main thickness was simulated by 25 mm, one cell in the “y” direction in most of the domain, to reduce the calcu- lation time, as shown in Figure 3. Plan view for pressure Transducers locations Ø3.8mm z y P 1 P 4 1DOF Motion Figure 2. Schematic drop test diagram. Figure 3. Computational domain. Open Access WJM 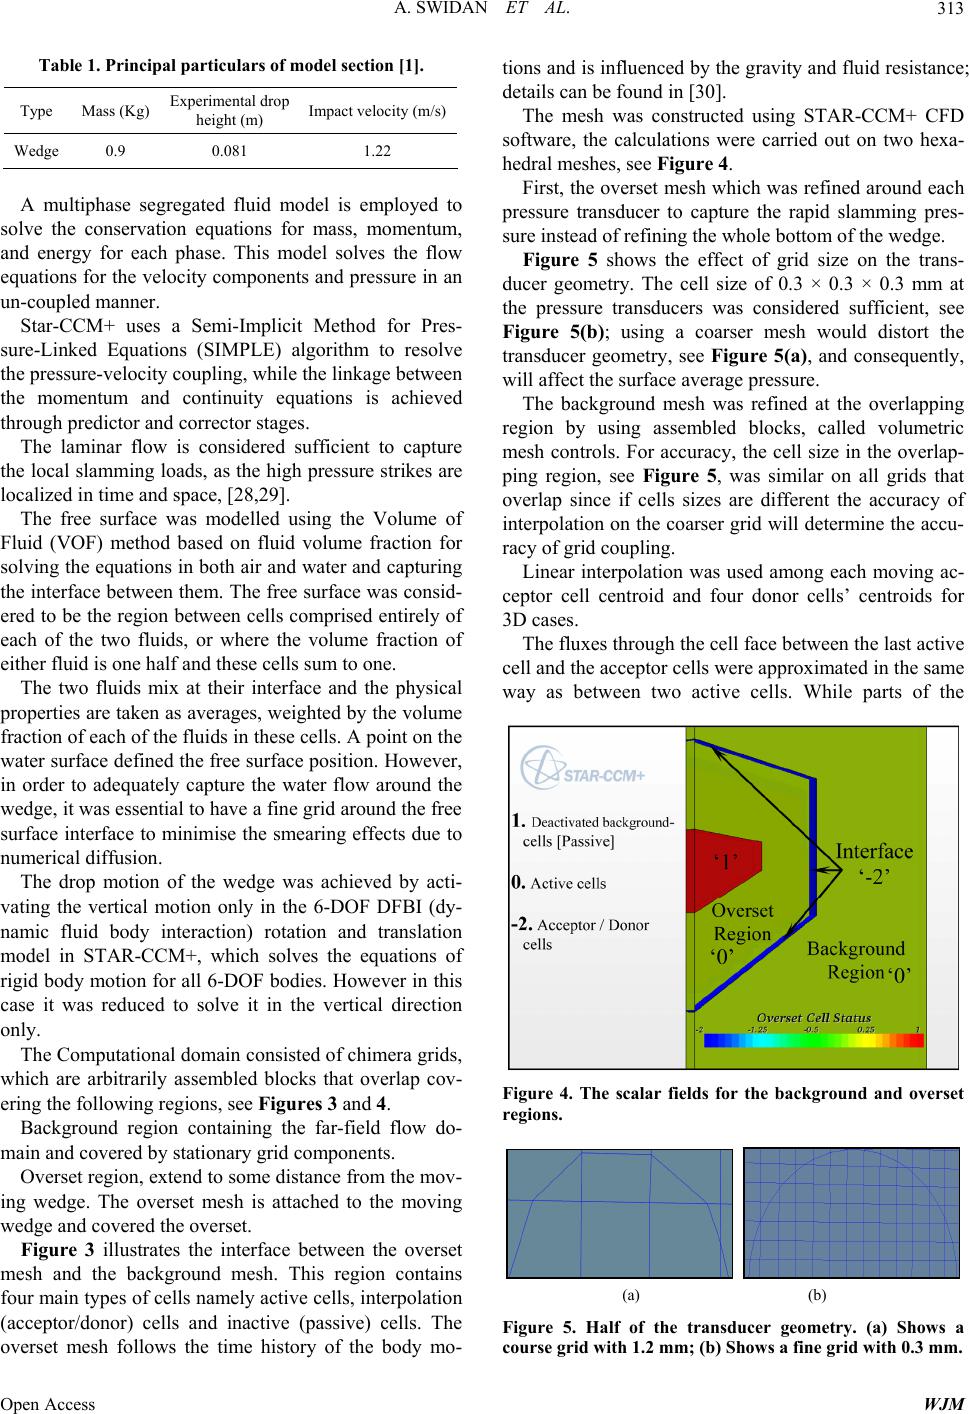 A. SWIDAN ET AL. 313 Table 1. Principal particulars of model section [1]. Type Mass (Kg) Experimental drop height (m) Impact velocity (m/s) Wedge 0.9 0.081 1.22 A multiphase segregated fluid model is employed to solve the conservation equations for mass, momentum, and energy for each phase. This model solves the flow equations for the velocity components and pressure in an un-coupled manner. Star-CCM+ uses a Semi-Implicit Method for Pres- sure-Linked Equations (SIMPLE) algorithm to resolve the pressure-velocity coupling, while the linkage between the momentum and continuity equations is achieved through predictor and corrector stages. The laminar flow is considered sufficient to capture the local slamming loads, as the high pressure strikes are localized in time and space, [28,29]. The free surface was modelled using the Volume of Fluid (VOF) method based on fluid volume fraction for solving the equations in both air and water and capturing the interface between them. The free surface was consid- ered to be the region between cells comprised entirely of each of the two fluids, or where the volume fraction of either fluid is one half and these cells sum to one. The two fluids mix at their interface and the physical properties are taken as averages, weighted by the volume fraction of each of the fluids in these cells. A point on the water surface defined the free surface position. However, in order to adequately capture the water flow around the wedge, it was essential to have a fine grid around the free surface interface to minimise the smearing effects due to numerical diffusion. The drop motion of the wedge was achieved by acti- vating the vertical motion only in the 6-DOF DFBI (dy- namic fluid body interaction) rotation and translation model in STAR-CCM+, which solves the equations of rigid body motion for all 6-DOF bodies. However in this case it was reduced to solve it in the vertical direction only. The Computational domain consisted of chimera grids, which are arbitrarily assembled blocks that overlap cov- ering the following regions, see Figures 3 and 4. Background region containing the far-field flow do- main and covered by stationary grid components. Overset region, extend to some distance from the mov- ing wedge. The overset mesh is attached to the moving wedge and covered the overset. Figure 3 illustrates the interface between the overset mesh and the background mesh. This region contains four main types of cells namely active cells, interpolation (acceptor/donor) cells and inactive (passive) cells. The overset mesh follows the time history of the body mo- tions and is influenced by the gravity and fluid resistance; details can be found in [30]. The mesh was constructed using STAR-CCM+ CFD software, the calculations were carried out on two hexa- hedral meshes, see Figure 4. First, the overset mesh which was refined around each pressure transducer to capture the rapid slamming pres- sure instead of refining the whole bottom of the wedge. Figure 5 shows the effect of grid size on the trans- ducer geometry. The cell size of 0.3 × 0.3 × 0.3 mm at the pressure transducers was considered sufficient, see Figure 5(b); using a coarser mesh would distort the transducer geometry, see Figure 5(a), and consequently, will affect the surface average pressure. The background mesh was refined at the overlapping region by using assembled blocks, called volumetric mesh controls. For accuracy, the cell size in the overlap- ping region, see Figure 5, was similar on all grids that overlap since if cells sizes are different the accuracy of interpolation on the coarser grid will determine the accu- racy of grid coupling. Linear interpolation was used among each moving ac- ceptor cell centroid and four donor cells’ centroids for 3D cases. The fluxes through the cell face between the last active cell and the acceptor cells were approximated in the same way as between two active cells. While parts of the Figure 4. The scalar fields for the background and overset regions. (a) (b) Figure 5. Half of the transducer geometry. (a) Shows a course grid with 1.2 mm; (b) Shows a fine grid with 0.3 mm. Open Access WJM  A. SWIDAN ET AL. 314 background grid lying on the moving wedge were deac- tivated, see Figures 4 and 6. The simulations were run in series mode on a PC with Intel CoreTM i7-2600 CPU@3.4 GHz and 16.0 GB RAM. A sensitivity study was carried out to analyse the ef- fect of varying the mesh density with suitable time steps (Courant number varying from 0.05 - 0.5). To ensure stability, the maximum time step was chosen to satisfy the Nyquist sampling criterion that requires at least two time-steps per cell. The minimum time step was chosen for courant number of 0.1 to capture the pressure peaks. The CFD uncertainty was approximated by increasing the mesh density systematically from around 58-388 k cells. The total number of cells and cell dimensions are shown in Table 2, while Figure 7 shows the variations in Overset Grid Free Surface Overlapping Region Background Grid Figure 6. Symmetry view of the free falling wedge’s grids. -2 0 2 4 6 8 re (k.Pa) 10 12 14 0 4 Pressu P me 26 hysical Ti 8 (ms) 1012 Experiment Grid.No.1 Grid.No.2 Grid.No.3 Grid.No.4 Figure 7. The of the grp calct prra Tablent grids used iid size analy- s effect ulated pressure a id siz essure t e and time nsducer ste number s on the 1. 2. The four differe is. n the gr Grid1Grid 2 Grid 3 Grid 4 Cells 58836 129347 388041388041 Δx 0.01250.00625 0.0031 0.0031 Δy 0.025 0.0125 0.0125 0.0125 Δz 0.01250.00625 0.0031 0.0125 0.00050.0001 0.000050.000025 Time steps (Δsec) Wall clock time (≈hours) 0.2 0.7 2.3 3.8 Random access memory 4 Gb the calculated pressures at pressure transducer number 1. Fr 2.2. SPH Method using CFD were compared against a ng among particles were 15 m/s, 5 m havior of nine two-dimensional 1/40-scale odels entering still water under drop tests, see Figure 8, at different conditions for varied wedge and catamaran geometries. Peak acceleration, velocity time record, av- erage surface pressure and flow visualization were re- corded and analysed. Various models were dropped vertically into still water using a drop test facility. The facility consisted of a 2.4 m × 0.3 m × 1.2 m tank with a tower, main post, padded shock-absorbers and two sets of adjustable bearings, (see, Figure 8). om the grid independence study, it was found that us- ing smaller grid sizes results in predicting higher pres- sures. Grid 3 was chosen to save the computational time, as there was only a very slight difference in resulting pressures between this grid and grid 4. The obtained results simulation carried out by [24], using the Smoothed Parti- cle Hydrodynamics [SPH] technique. Shahraki et al., studied a range of coefficients of vis- cosity and speed of sound due to their significant effect on both computational time and accuracy of results. The study found that the optimal values for speed of sound, particle size and spaci m and 10 mm respectively [24]. 3. Model Tests Whelan [1] investigated the influences of geometry on lamming bes m Figure 8. Drop test tank at University of Tasmania. Open Access WJM 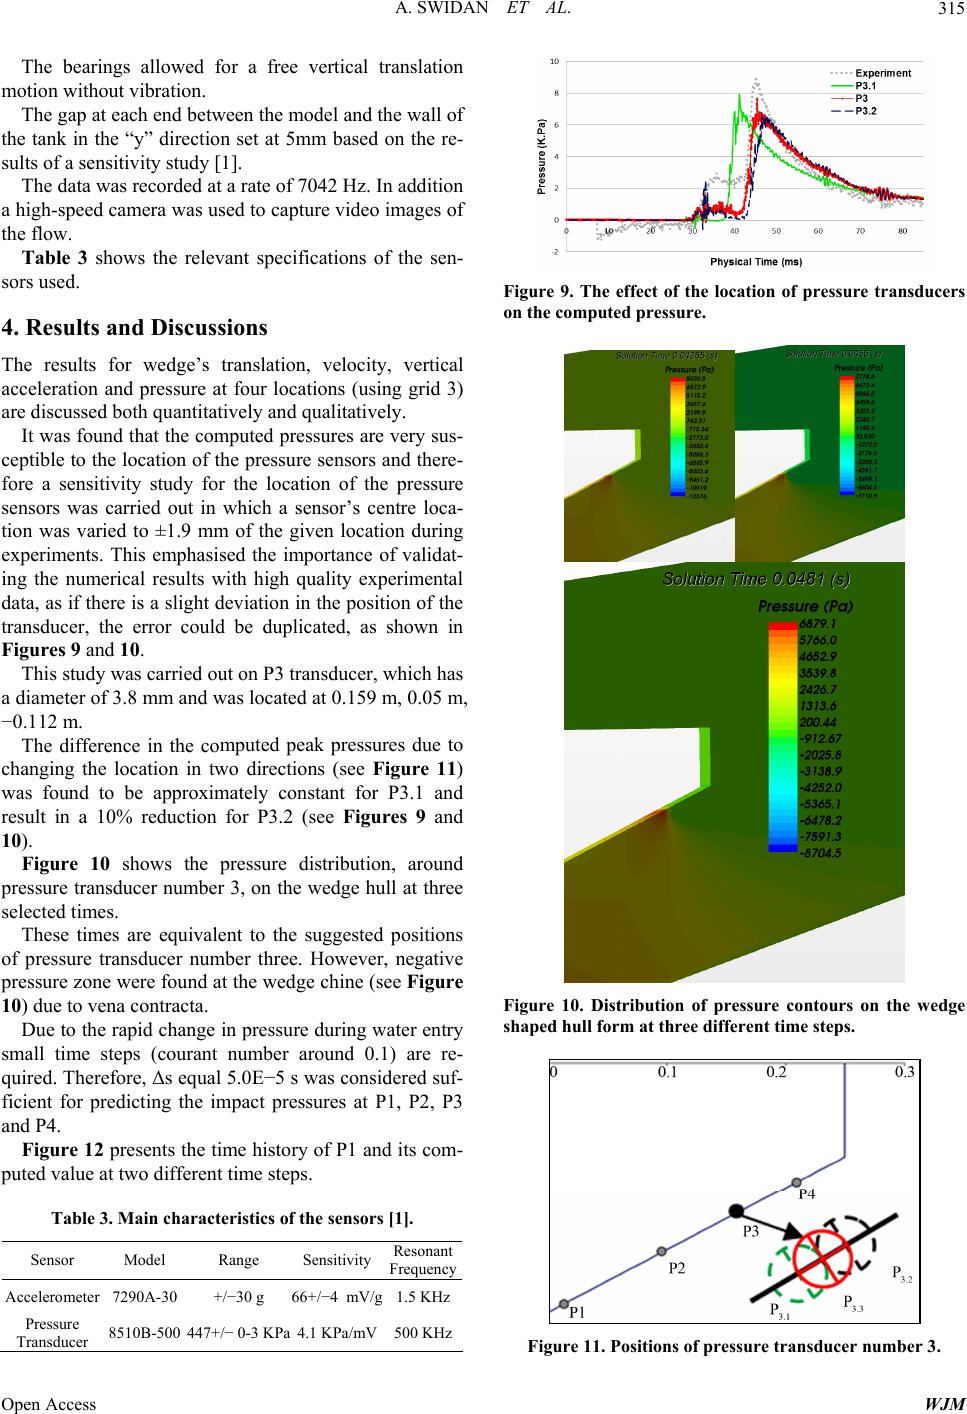 A. SWIDAN ET AL. 315 The bearings allowed for a free vertical translation sure at four locations (using grid 3) ar he location of the pressure sensors and there- fo numerical results with high quality experimental da . mputed peak pressures due to ch shows the pressure distribution, around pr These times are equivalent to the suggested positions of preative pressure zone were found at the wedge chine (se 10) vena contracta. ng sua smsteps (courant number around 0.1) are re- q e ficient for predicting the impact pressures at P1, P2, P3 and P4. Figure 12 presents the time history of P1 and its com- puted value at two different time steps. Table 3. Main characteristics of the sensors [1]. Sensor Model Range Sensitivity Resonant Frequency motion without vibration. The gap at each end between the model and the wall of the tank in the “y” direction set at 5mm based on the re- sults of a sensitivity study [1]. The data was recorded at a rate of 7042 Hz. In addition a high-speed camera was used to capture video images of the flow. Table 3 shows the relevant specifications of the sen- sors used. 4. Results and Discussions The results for wedge’s translation, velocity, vertical acceleration and pres e discussed both quantitatively and qualitatively. It was found that the computed pressures are very sus- ceptible to t re a sensitivity study for the location of the pressure sensors was carried out in which a sensor’s centre loca- tion was varied to ±1.9 mm of the given location during experiments. This emphasised the importance of validat- ing the ta, as if there is a slight deviation in the position of the transducer, the error could be duplicated, as shown in Figures 9 and 10 This study was carried out on P3 transducer, which has a diameter of 3.8 mm and was located at 0.159 m, 0.05 m, −0.112 m. The difference in the co anging the location in two directions (see Figure 11) was found to be approximately constant for P3.1 and result in a 10% reduction for P3.2 (see Figures 9 and 10). Figure 10 essure transducer number 3, on the wedge hull at three selected times. ssure transducer number three. However, neg e Figure due to Due to the rapid chae in presre during wter entry all time uired. Therfore, Δs equal 5.0E−5 s was considered suf- Accelerometer 7290A-30 +/−30 g 66+/−4 mV/g1.5 KHz Pressure Transducer 8510B-500 447+/− 0-3 KPa 4.1 KPa/mV 500 KHz Figure 9. The effect of the location of pressure tranducers on the computed pressure. s Figure 10. Distribution of pressure contours on the wedge shaped hull form at three different time steps. Figure 11. Positions of pressure transducer number 3. Open Access WJM 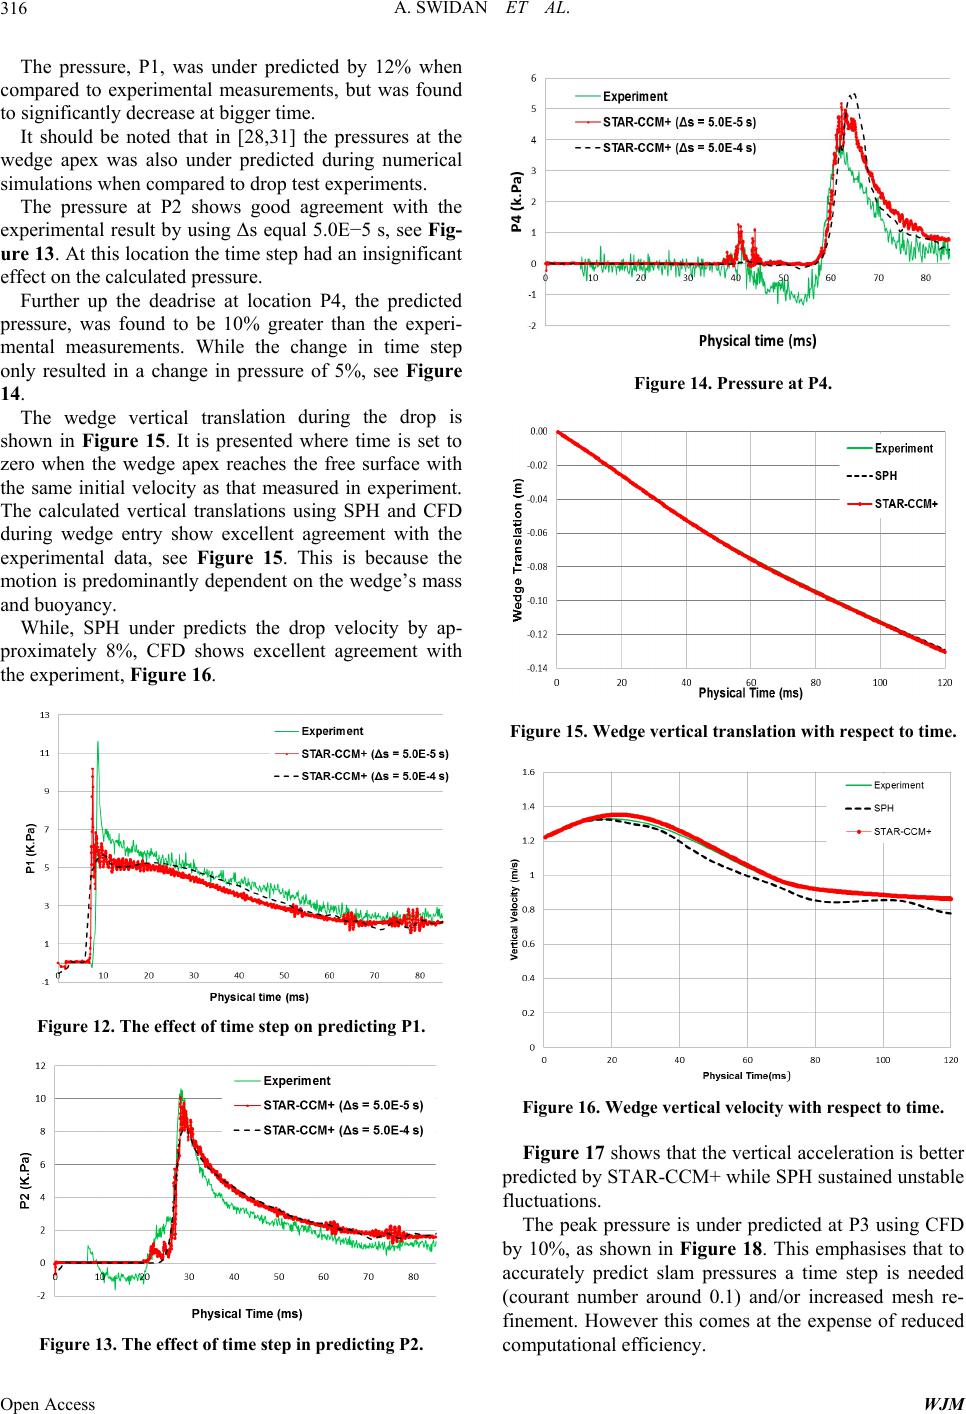 A. SWIDAN ET AL. 316 The pressure, P1, was under predicted by 12% when compared to experimental measurements, but was found to significantly decrease at bigger time. It should be noted that in [28,31] the pressures at the w ments. While the change in time step on slation during the drop is own in Figure 15. It is presented where time is set to zero when the wedge apex reaches the free surface with the same initial velocity as that measured in experiment. The calculated vertical translations using SPH and CFD during wedge entry show excellent agreement with the experimental data, see Figure 15. This is because the motion is predominantly dependent on the wedge’s mass and buoyancy. While, SPH under predicts the drop velocity by ap- proximately 8%, CFD shows excellent agreement with the experiment, Figure 16. edge apex was also under predicted during numerical simulations when compared to drop test experiments. The pressure at P2 shows good agreement with the experimental result by using Δs equal 5.0E−5 s, see Fig- ure 13. At this location the time step had an insignificant effect on the calculated pressure. Further up the deadrise at location P4, the predicted pressure, was found to be 10% greater than the experi- mental measure ly resulted in a change in pressure of 5%, see Figure 14. The wedge vertical tran sh Figure 12. The effect of time step on predicting P1. Figure 14. Pressure at P4. Figure 15. Wedge vertical translation with respect to time. Figure 16. Wedge vertical velocity with respect to time. Figure 17 shows that the vertical acceleration is better predicted by STAR-CCM+ while SPH sustained unstable fluctuations. The peak pressure is under predicted at P3 using CFD by 10%, as shown in Figure 18. This emphasises that to accurately predict slam pressures a time step is needed (courant number around 0.1) and/or increased mesh re- finement. However this comes at the expense of reduced computational efficiency. Figure 13. The effect of time step in predicting P2. Open Access WJM  A. SWIDAN ET AL. 317 Figure 17. Wedge vertical acceleration with respect to time. Figure 18. Average surface pressure on transducer no. 3. 5. Conclusions This paper presented results of a comparative study for drop tests on symmetrical wedges. Numerical solutions using STAR-CCM+CFD-software were compared with results from experimental drop test measurements. The simulations have illustrated the possibility of using CFD to predict motion responses and local slamming pressures since excellent agreement was found with experimental data. The location of the pressure transducers was found to have a significant effect on the numerical simulation re- sults. Therefore much care and focus are needed when measuring the position of pressure transducers during experiments. Relatively larger time steps can be used to accurately predict the wedge’s motion responses, as well as the pressures distant from the wedge’s apex. Computing pressures near the wedge apex need par- ticular focus due to the rapid increase of pressure in this zone. A Courant number of around 0.1 can be considered sufficient in predicting slamming pressures, particularly at the zone of large pressure change, as near the wedge apex. The laminar flow was considered sufficient to predict localized loads such as slam loads. The CFD results showed better agreement to the ex- perimental results than available computed results using the 2D SPH technique, thus it is proposed that the work can be extended in the future to predict slamming on twin-hull models. Future work will centre on a comparison of the lami- nar flow model against turbulence models, the extension of predicting the whole motions in 6 DOF and pressures of more realistic monohull forms and unconventional hull models, e.g. catamaran hull forms, during impact phase. REFERENCES [1] J. R. Whelan, “Wetdeck Slamming of High Speed Cata- marans with a Centrebow,” PhD, National Centre of Maritime Engineering and Hydrodynamics, University of Tasmanai, 2004. [2] D. J. Veen and T. P. Gourlay, “An Investigation of Slam Events in Two Dimensions Using Smoothed Particle Hy- drodynamics,” Presented at the 10th International Con- ference on Fast Sea Transportation, Athens, October 2009. [3] M. D. W. Amin, G. Thomas and D. Holloway, “Transient Wave Loads on Large High Speed Catermarans,” In 8th International Conference on High Performance Marine Vehicles, 2012, p. 246. [4] O. M. Faltinsen and H. Sun, “Dynamic Behaviour of Semi-Displacement and Planning Vessels in Calm Water and Waves,” Presented at the IX High Speed Marine Ve- hicles, Naples, 2011. [5] S. M. G. Thomas, M. Davis, B. French, J. Lavroff and W. Amin, “Lessons Learnt through the Design, Construction and Testing of a Hydroeslatic Model for Determining Motions, Loads and Slamming Behavior in Severe Sea States,” In 6th International Conference on Hydroelastic- ity in Marine Technology, Tokyo, 2012, pp. 163-172. [6] M. D. G. Thomas, D. Holloway and T. Roberts, “Extreme Asymmetric Slam Loads on Large High Speed Catama- rans,” Analysis, Vol. 8, 2002, p. 9. [7] M. Adamovic, 2006 http://www.online-utility.org/image/gallery.jsp?title=Ship [8] M. D. W. Amin and G. Thomas, “Evaluation of Finite Element Analysis as a Tool to Predict Sea Loads with the Aid of Trials Data,” Presented at the High Speed Marine Vehicles, Naples, 2008. [9] R. W. M. Davis, L. Nigel and D. Holloway, “Measure- ment and Prediction of Wave Loads on a High-Speed Catamaran Fitted with Active Stern Tabs,” Marine Struc- tures, Vol. 17, No. 7, 2004, pp. 503-535. http://dx.doi.org/10.1016/j.marstruc.2005.01.003 [10] M. D. G. Thomas, D. Holloway and T. Roberts, “Tran- sient Dynamic Slam Response of Large High Speed Cata- marans,” Presented at the 7th International Conference on Fast Sea Transportation, Ischia, 2003. [11] L. K. G. Thomas, A. Ford, J. Binns, I. Finnie and N. Ka- vanagh, “Experimental Investigation into Wave-Induced Open Access WJM  A. SWIDAN ET AL. Open Access WJM 318 Design Loads on a Large Moored Catamaran,” Ships and Offshore Structures, Vol. 6, No. 4, 2011, pp. 273-295. http://dx.doi.org/10.1080/17445301003780581 [12] M. D. J. Lavroff, D. Holloway and G. Thomas, “Wave Slamming Loads on Wave-Piercer Catamarans Operating at High-Speed Determined by Hydro-Elastic Segmented Model Experiments,” Marine Structures, Vol. 33, 2013, pp. 120-142. http://dx.doi.org/10.1016/j.marstruc.2013.05.001 [13] M. R. Davis, J. R. Whelan and G. A. Thomas, “Computa- tional Modeling of Wet Deck Slam Loads with Reference to Sea Trials,” Presented at the 9th International Confer- ence on Fast Sea Transportation, Shanghai, 2007. [14] M. D. G. Thomas, D. Holloway, N. Watson and T. Rob- erts, “Slamming Response of a Large High-Speed Wave- Piercer Catamaran,” Marine Technology, Vol. 40, 2003, pp. 126-140. [15] A. B. R. Algarín and O. Tascón, “CFD Modeling of 2D Asymmetric Entry Impact Along with Horizontal Veloc- ity,” Ship Science & Technology, Vol. 5, 2011, pp. 99-106. [16] D. W. R. Peterson and C. Frank, “Drop Tests to Support Water-Impact and Planning Boat Dynamics Theory,” Dahlgren Division, Naval Surface Warfare Center, Pa- nama City, Technical Report, 1997. [17] S. E. H. Mørch, M. Perić and E. Schreck, “Simulation of Lifeboat Launching under Storm Conditions,” Presented at the 6th International Conference on CFD in Oil and Gas, Metallurgical and Process Industries, Trondheim, 2008. [18] H. W. H. Luo and C. Soares, “Numerical and Experi- mental Study of Hydrodynamic Impact and Elastic Re- sponse of One Free-Drop Wedge with Stiffened Panels,” Ocean Engineering, Vol. 40, 2012, pp. 1-14. http://dx.doi.org/10.1016/j.oceaneng.2011.11.004 [19] Q. Yang and W. Qiu, “Numerical Simulation of Water Impact for 2D and 3D Bodies,” Ocean Engineering, Vol. 43, 2012, pp. 82-89. http://dx.doi.org/10.1016/j.oceaneng.2012.01.008 [20] D. J. Veen and T. P. Gourlay, “A Combined Strip Theory and Smoothed Particle Hydrodynamics Approach for Es- timating Slamming Loads on a Ship in Headseas,” Ocean Engineering, 2012, p. 8. [21] H. Sun and O. M. Faltinsen, “Numerical Study of Plan- ning Vessels in Waves,” Journal of Hydrodynamics, Vol. 22, No. 5, 2010, pp. 468-475. http://dx.doi.org/10.1016/S1001-6058(09)60238-9 [22] M. C. K. Paik, D. Lee and K. Maki, “Strongly Coupled Fluid-Structure Interaction Method for Structural Loads on Surface Ships,” Ocean Engineering, Vol. 36, No. 17- 18, 2009, pp. 1346-1357. http://dx.doi.org/10.1016/j.oceaneng.2009.08.018 [23] DNV, “Environmental Conditions and Environmental Loads,” Høvik, Norway, Technical Report, 2007. [24] I. P. J. Shahraki, G. Thomas, M. R. Davis and J. Whelan, “Prediction of Slamming Behaviour of Monohull and Multihull Forms Using Smoothed Particle Hydrodynam- ics,” Presented at the IX HSMV, High Speed Marine Ve- hicles, Naples, 2011. [25] V. Bertram, “Practical Ship Hydrodynamics,” UK, 2000. [26] J. Gorski, “Present State of Numerical Ship Hydrody- namics and Validation Experiments,” Transactions— American Society of Mechanical Engineers Journal of Offshore Mechanics and Arctic Engineering, Vol. 124, 2002, pp. 74-80. [27] Specialist Committee on CFD in Marine Hydrodynamics, “Practical Guidelines for Ship CFD Application,” Pre- sented at the 26th International Towing Tank Conference, 2011. [28] S. Johannessen, “Use of CFD to Study Hydrodynamic Loads on Free-Fall Lifeboats in the Impact Phase: A Ve- rification and Validation Study,” M.Sc. Thesis, Norwe- gian University of Science and Technology, 2012. [29] O. M. Faltinsen, “Hydrodynamics of High-Speed Marine Vehicles,” Cambridge University, USA, 2005. [30] H. Hidajet, “Development and Application of a Finite Volume Method for the Computation of Flows around Moving Bodies on Unstructured, Overlapping Grids,” PhD, Technische Universitat Hamburg, Harburg, 2005. [31] A. P. B. Godderidge, S. Lewis, S. Turnock, D. Hudson and M. Tan, “The Simulation of Free Surface Flows with Computational Fluid Dynamics,” Presented at the Inspir- ing Engineering, UK, 2008.
|