Paper Menu >>
Journal Menu >>
 Chinese Studies 2013. Vol.2, No.4, 149-151 Published Online November 2013 in SciRes (http://www.scirp.org/journal/chnstd) http://dx.doi.org/10.4236/chnstd.2013.24024 Open Access 149 Is Urban China’s CPI Underreported? Sun Wenkai School of Economics, Renmin University of China, Beijing, Chin a Email: sunwk@r uc.edu.cn Received July 8th, 2013; revised August 20th, 2013; accepted September 2nd, 2013 Copyright © 2013 Sun Wenkai. This is an open access article distributed under the Creative Commons Attribu- tion License, which permits unrestricted use, distribution, and reproduction in any medium, provided the original work is properly cited. Many have doubts about statistics, including the consumer price index (CPI) released by Chinese Gov- ernment. We re-estimate the CPI in urban China from 1997 to 2009, with two widely accepted approaches to treating owner-occupied housing (i.e., user cost approach and consumption cost approach). The results are not considerably different from the NBS statistics, especially for recent years. Keywords: Consumer Price Index; Owner-Occupied Housing; User Cost Approach; Consumption Cost Approach Introduction Accuracy of economic indicators is of paramount importance to macroeconomic empirical research. However, many macro indicators in Mainland China (China, hereafter) are controversial because the National Bureau of Statistics (NBS, hereafter) usu- ally releases them without provi ding the methods and procedure s for obtaining them. The consumer price index (CPI, hereafter) i s such an example. In recent years, it has just moderately increased despite dramatically increasing house prices. This has led to a lot of concerns and controversies. After He (2010) successfully replicated the NBS calculation of CPI and thus provided sup- port to the NBS statistics, most concerns now focus on the weights of the CPI categories, in particular the weight of hous- ing expenditure. In fact, the NBS has been aware of the under- estimation of the weight of housing expenditure and announced a decision to adjust the weights of the CPI categories after 2011, with a focus on enhancing the weight of housing expenditure. Research has shown that the weight of housing expenditure in the NBS-released CPI is lower than it should be. Specifically, Wang (2008), He (2010) and Xu (2010) estimated it to be 13.6%, 10% - 16% and 16%, respectively, all much lower than 42% in the United States (Wang, 2008) and the mean weight, 20.26%, in OECD countries. Xu (2010) further pinpointed the cause of the underestimation to be the NBS method for calcu- lating the owner-occupied housing expenditure. With most Chinese households having their own housing, the weight of owner-occupied housing in CPI should be larger in China than in the US. This, however, is not the case. There are several widely-accepted approaches to treating owner-occupied housing; however, the NBS adopts none of them (Wang, 2006). In this paper, we use two of these ap- proaches to re-estimate the weights of the CPI categories and recalculate the CPI in urban China. Approaches to Treating Owner-Occupied Housing The International Labor Office endorsed four major ap- proaches to handling owner-occupied housing. They are: the acquisitions approach, the rental equivalent approach, the user cost approach, and the payments approach. In addition, Beatty, Larsen, and Sommervoll (2010) proposed an improved rental equivalent approach, termed “consumption cost approach”. Among the five approaches, we adopt the user cost approach and the consumption cost approach, because of certain short- comings of the other approaches. As Beatty et al. (2010) cri- tiqued, the acquisitions approach ignores the role played by interest rates and the payments approach (based on observed interest payments by households with a mortgage) ignores the role played by households with equity. Meanwhile, the rental equivalent approach would not apply well in China, because the rental market in China (as in many other countries) is not de- veloped during the research period and the rental imputation would have to be based on an unreliable out-of-sample ex- trapolation. Therefore, we adopt only the user cost approach and the consumption cost approach. User Cost Approach The user cost approach is based on the pricing theory (Katz, 2009). The house purchase price equals the discounted present value of its expected future services less the discounted present value of its expected future operating costs. 11 11 11 1 1 1 11 11 1 1 tt tmvt tvvm v vt t tttmvi it tmv m tmv i it uuu O Vrr rr r O r (1) where m denotes the remaining service life of a house, the purchase price of a v periods old house at the beginning of pe- riod t, the expected value of the period t services of this house, the expected period t operating expenses (including maintenance cost and depreciation, to be paid at the end of period t) for this v periods old house in period t, and the t v V t v r t v ut v O 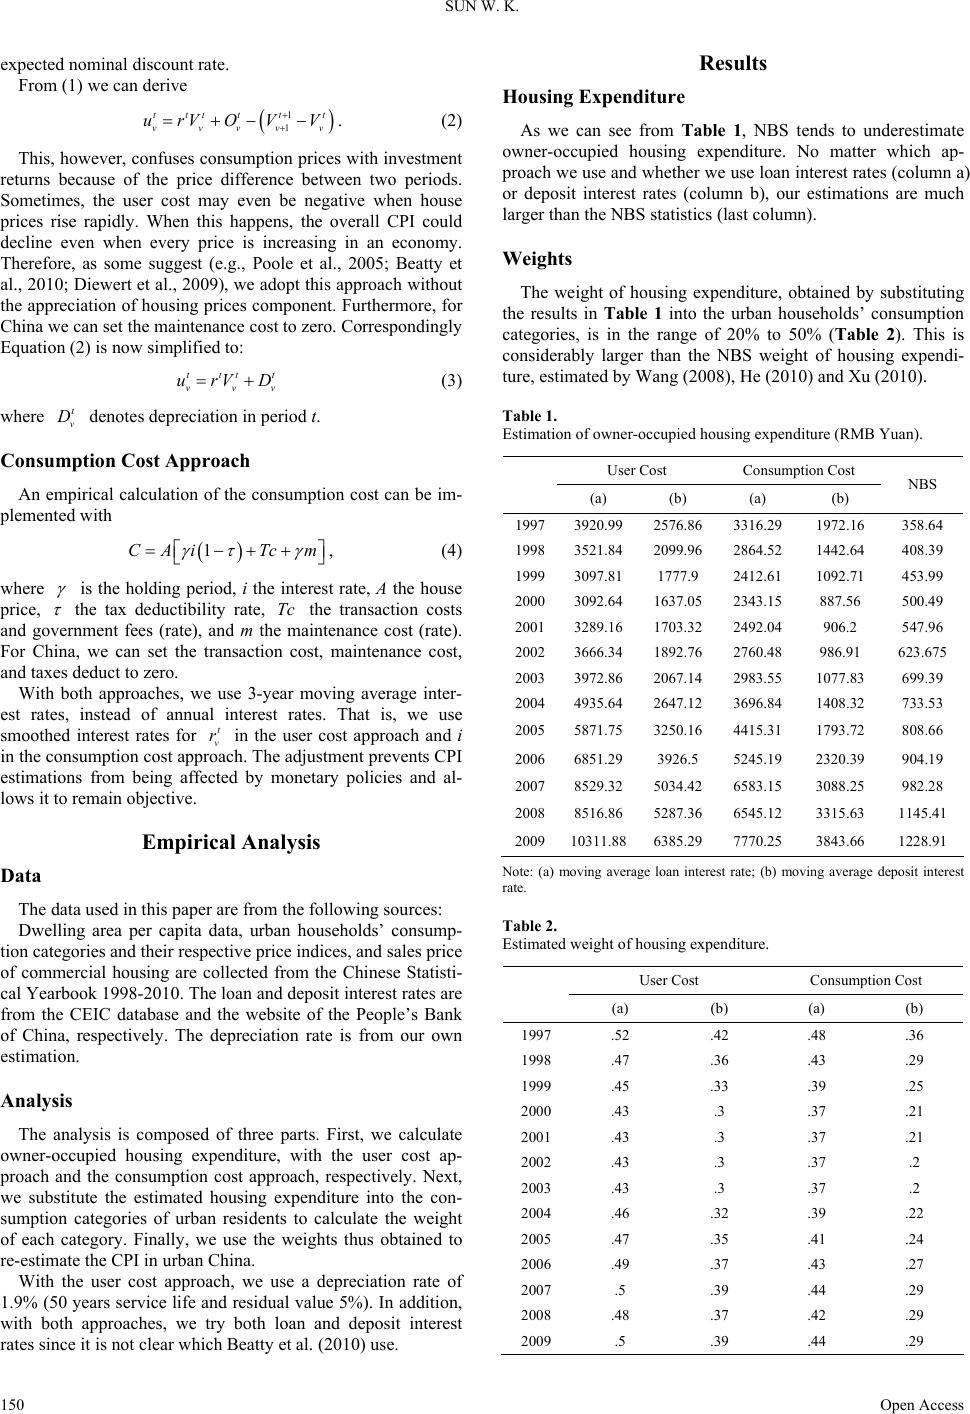 SUN W. K. expected nominal discount rate. From (1) we can derive 1 1 ttt ttt vvvvv urVO VV . (2) This, however, confuses consumption prices with investment returns because of the price difference between two periods. Sometimes, the user cost may even be negative when house prices rise rapidly. When this happens, the overall CPI could decline even when every price is increasing in an economy. Therefore, as some suggest (e.g., Poole et al., 2005; Beatty et al., 2010; Diewert et al., 2009), we adopt this approach without the appreciation of housing prices component. Furthermore, for China we can set the maintenance cost to zero. Correspondingly Equation (2) is now simplified to: ttt vv urVD t v (3) where denotes depreciation in period t. t v D Consumption Cost Ap p roach An empirical calculation of the consumption cost can be im- plemented with 1CAiTcm , (4) where is the holding period, i the interest rate, A the house price, the tax deductibility rate, Tc the transaction costs and government fees (rate), and m the maintenance cost (rate). For China, we can set the transaction cost, maintenance cost, and taxes deduct to zero. With both approaches, we use 3-year moving average inter- est rates, instead of annual interest rates. That is, we use smoothed interest rates for in the user cost approach and i in the consumption cost approach. The adjustment prevents CPI estimations from being affected by monetary policies and al- lows it to remain objective. t v r Empirical Analysis Data The data used in this paper are from the following sources: Dwelling area per capita data, urban households’ consump- tion categories and their respective price indices, and sales price of commercial housing are collected from the Chinese Statisti- cal Yearbook 1998-2010. The loan and deposit interest rates are from the CEIC database and the website of the People’s Bank of China, respectively. The depreciation rate is from our own estimation. Analysis The analysis is composed of three parts. First, we calculate owner-occupied housing expenditure, with the user cost ap- proach and the consumption cost approach, respectively. Next, we substitute the estimated housing expenditure into the con- sumption categories of urban residents to calculate the weight of each category. Finally, we use the weights thus obtained to re-estimate the CPI in urban China. With the user cost approach, we use a depreciation rate of 1.9% (50 years service life and residual value 5%). In addition, with both approaches, we try both loan and deposit interest rates since it is not clear which Beatty et al. (2010) use. Results Housing Expenditure As we can see from Table 1, NBS tends to underestimate owner-occupied housing expenditure. No matter which ap- proach we use and whether we use loan interest rates (column a) or deposit interest rates (column b), our estimations are much larger than the NBS statistics (last column). Weights The weight of housing expenditure, obtained by substituting the results in Table 1 into the urban households’ consumption categories, is in the range of 20% to 50% (Table 2). This is considerably larger than the NBS weight of housing expendi- ture, estimated by Wang (2008), He (2010) and Xu (2010). Table 1. Estimation of o wn er-occupied housing expenditure (RMB Yuan). User Cost Consumpti on Cost (a) (b) (a) (b) NBS 19973920.99 2576.863316.29 1972.16 358.64 19983521.84 2099.962864.52 1442.64 408.39 19993097.81 1777.9 2412.61 1092.71 453.99 20003092.64 1637.052343.15 887.56 500.49 20013289.16 1703.322492.04 906.2 547.96 20023666.34 1892.762760.48 986.91 623.675 20033972.86 2067.142983.55 1077.83 699.39 20044935.64 2647.123696.84 1408.32 733.53 20055871.75 3250.164415.31 1793.72 808.66 20066851.29 3926.5 5245.19 2320.39 904.19 20078529.32 5034.426583.15 3088.25 982.28 20088516.86 5287.366545.12 3315.63 1145.41 200910311.886385.297770.25 3843.66 1228.91 Note: (a) moving average loan interest rate; (b) moving average deposit interest rate. Table 2. Estimated weight of housing expenditure. User Cost Consumpti on Cost (a) (b) (a) (b) 1997 .52 .42 .48 .36 1998 .47 .36 .43 .29 1999 .45 .33 .39 .25 2000 .43 .3 .37 .21 2001 .43 .3 .37 .21 2002 .43 .3 .37 .2 2003 .43 .3 .37 .2 2004 .46 .32 .39 .22 2005 .47 .35 .41 .24 2006 .49 .37 .43 .27 2007 .5 .39 .44 .29 2008 .48 .37 .42 .29 2009 .5 .39 .44 .29 Open Access 150 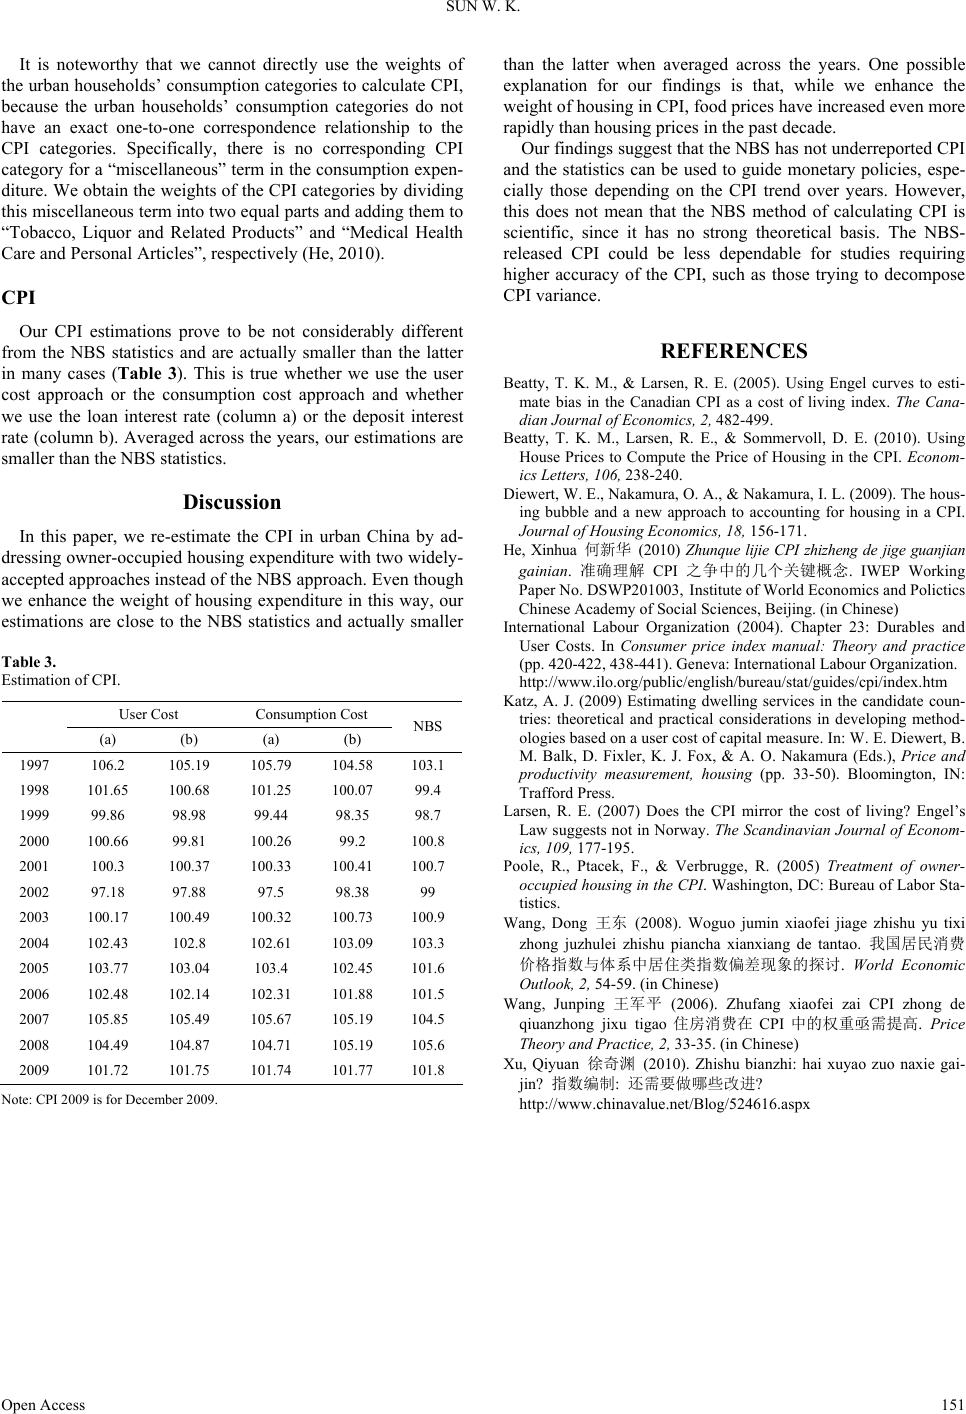 SUN W. K. Open Access 151 It is noteworthy that we cannot directly use the weights of the urban households’ consumption categories to calculate CPI, because the urban households’ consumption categories do not have an exact one-to-one correspondence relationship to the CPI categories. Specifically, there is no corresponding CPI category for a “miscellaneous” term in the consumption expen- diture. We obtain the weights of the CPI categories by dividing this miscellaneous term into two equal parts and adding them to “Tobacco, Liquor and Related Products” and “Medical Health Care and Personal Articles”, respectively (He, 2010). CPI Our CPI estimations prove to be not considerably different from the NBS statistics and are actually smaller than the latter in many cases (Table 3). This is true whether we use the user cost approach or the consumption cost approach and whether we use the loan interest rate (column a) or the deposit interest rate (column b). Averaged across the years, our estimations are smaller than the NBS statistics . Discussion In this paper, we re-estimate the CPI in urban China by ad- dressing owner-occupied housing expenditure with two widely- accepted approaches instead of the NBS approach. Even though we enhance the weight of housing expenditure in this way, our estimations are close to the NBS statistics and actually smaller Table 3. Estimation of CPI . User Cost Consumpti on Cost (a) (b) (a) (b) NBS 1997 106.2 105.19 105.79 104.58 103.1 1998 101.65 100.68 101.25 100.07 99.4 1999 99.86 98.98 99.44 98.35 98.7 2000 100.66 99.81 100.26 99.2 100.8 2001 100.3 100.37 100.33 100.41 100.7 2002 97.18 97.88 97.5 98.38 99 2003 100.17 100.49 100.32 100.73 100.9 2004 102.43 102.8 102.61 103.09 103.3 2005 103.77 103.04 103.4 102.45 101.6 2006 102.48 102.14 102.31 101.88 101.5 2007 105.85 105.49 105.67 105.19 104.5 2008 104.49 104.87 104.71 105.19 105.6 2009 101.72 101.75 101.74 101.77 101.8 Note: CPI 2009 is for December 2009. than the latter when averaged across the years. One possible explanation for our findings is that, while we enhance the weight of housing in CPI, food prices have increased even more rapidly than housing prices in the past decade. Our findings suggest that the NBS has not underreported CPI and the statistics can be used to guide monetary policies, espe- cially those depending on the CPI trend over years. However, this does not mean that the NBS method of calculating CPI is scientific, since it has no strong theoretical basis. The NBS- released CPI could be less dependable for studies requiring higher accuracy of the CPI, such as those trying to decompose CPI variance. REFERENCES Beatty, T. K. M., & Larsen, R. E. (2005). Using Engel curves to esti- mate bias in the Canadian CPI as a cost of living index. The Cana- dian Journal of Economics, 2, 482-499. Beatty, T. K. M., Larsen, R. E., & Sommervoll, D. E. (2010). Using House Prices to Compute the Price of Housing in the CPI. Econom- ics Letters, 106, 238-240. Diewert, W. E., Nakamura, O. A., & Nakamura, I. L. (2009). The hous- ing bubble and a new approach to accounting for housing in a CPI. Journal of Housing E conomics, 18, 156-171. He, Xinhua 何新华 (2010) Zhunque lijie CPI zhizheng de jige guanjian gainian. 准确理解 CPI 之争中的几个关键概念. IWEP Working Paper No. DSWP201003, Institute of World Economics and Polictics Chinese Academy of Social Sciences, Beijing. (in Chinese) International Labour Organization (2004). Chapter 23: Durables and User Costs. In Consumer price index manual: Theory and practice (pp. 420-422, 43 8-441). Geneva: International Labour Organization. http://www.ilo.org/public/english/bureau/stat/guides/cpi/index.htm Katz, A. J. (2009) Estimating dwelling services in the candidate coun- tries: theoretical and practical considerations in developing method- ologies based on a user cost of capital measure. In: W. E. Diewert, B. M. Balk, D. Fixler, K. J. Fox, & A. O. Nakamura (Eds.), Price and productivity measurement, housing (pp. 33-50). Bloomington, IN: Trafford Press. Larsen, R. E. (2007) Does the CPI mirror the cost of living? Engel’s Law suggests not in Norway. The Scandinavian Journal of Econom- ics, 109, 177-195. Poole, R., Ptacek, F., & Verbrugge, R. (2005) Treatment of owner- occupied housing in the CPI. Washington, DC: Bureau of Labor Sta- tistics. Wang, Dong 王东 (2008). Woguo jumin xiaofei jiage zhishu yu tixi zhong juzhulei zhishu piancha xianxiang de tantao. 我国居民消费 价格指数与体系中居住类指数偏差现象的探讨. World Economic Outlook, 2, 54-59. (in Chinese) Wang, Junping 王军平 (2006). Zhufang xiaofei zai CPI zhong de qiuanzhong jixu tigao住房消费在 CPI 中的权重亟需提高. Price Theory and Practice, 2, 33-35. (in Chinese) Xu, Qiyuan 徐奇渊 (2010). Zhishu bianzhi: hai xuyao zuo naxie gai- jin? 指数编制: 还需要做哪些改进? http://www.chinavalue.net/Blog/524616.aspx |