F. de A. CARVALHO, F. WALTER
378
transmitted the following preamble 10101010101010101
for every five samples of the audio signal.
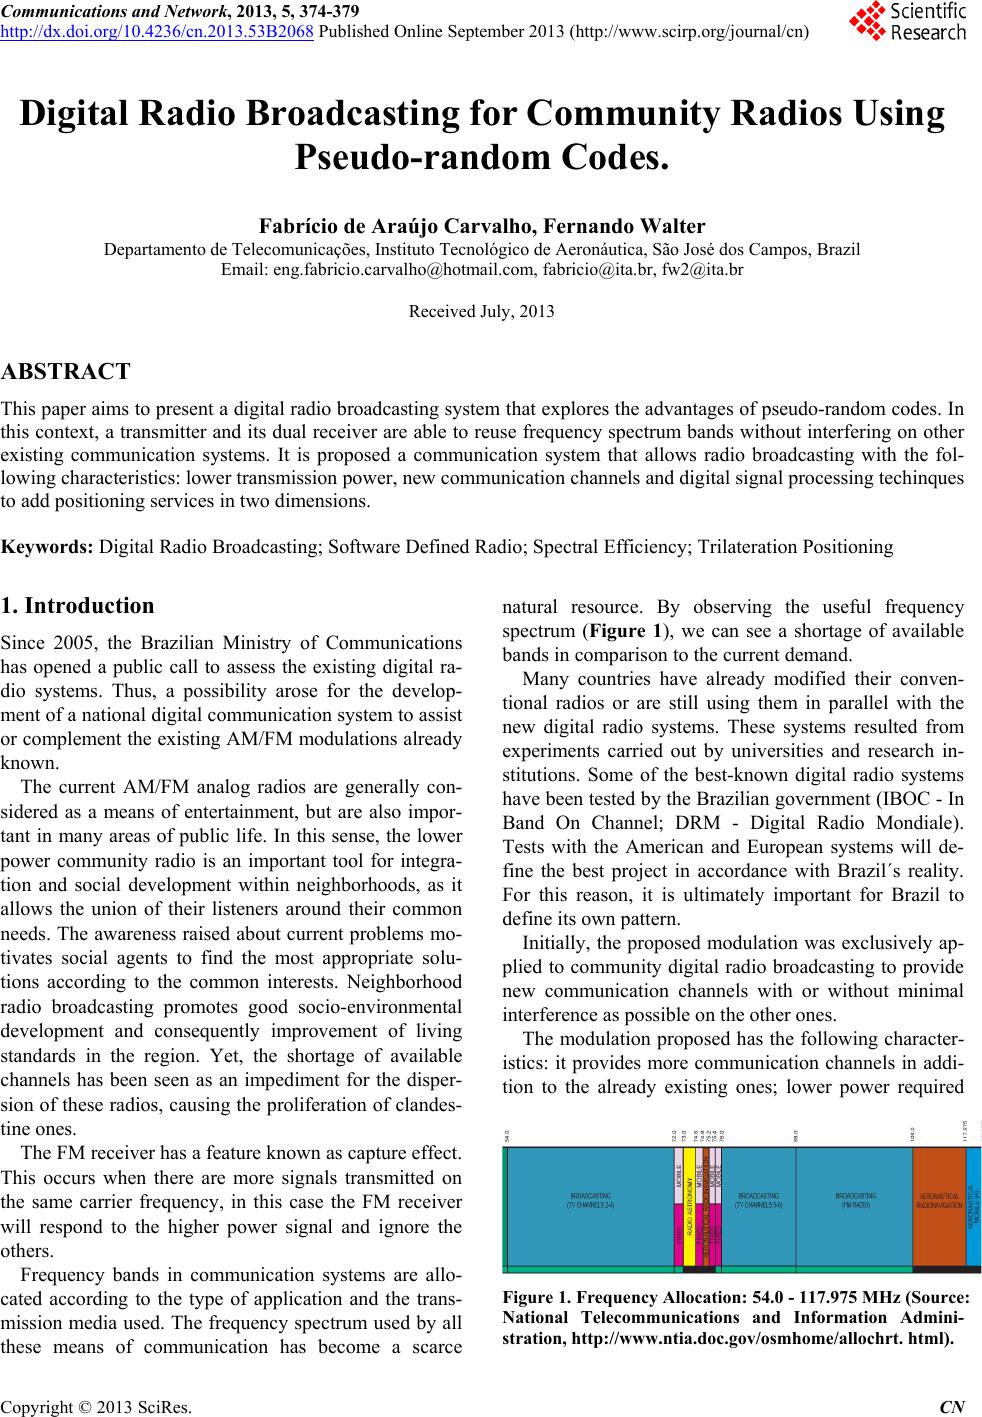
For the transmitter screen, we have the following
windows: 1: audio signal (counting from 1 to 5); 2: audio
signal spectrum; 3: signal spectrum in the digital IF; 4:
truncated PRN code ; 5: Doppler on the carrier; 6: digi-
tised IF; 7: error in carrier phase; 8: 16-bit word (quanti-
fied and encoded audio), 9: error in frequency code; 10:
BPSK signal transmitted and 11: error in code phase.
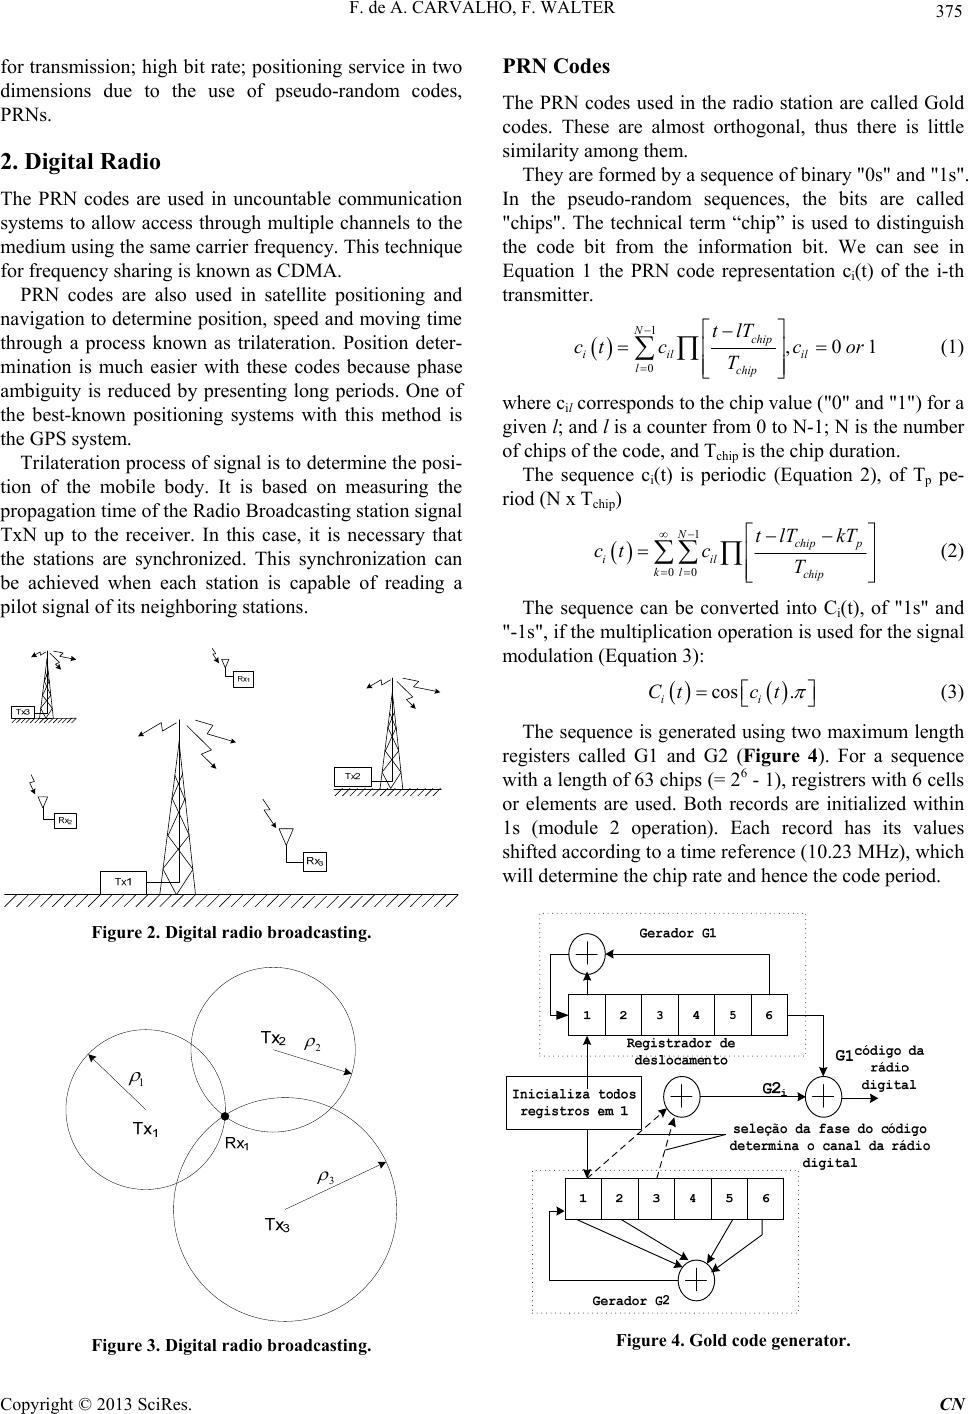
Figure 14 shows the signal stored in binary file and
processed by the receiver.
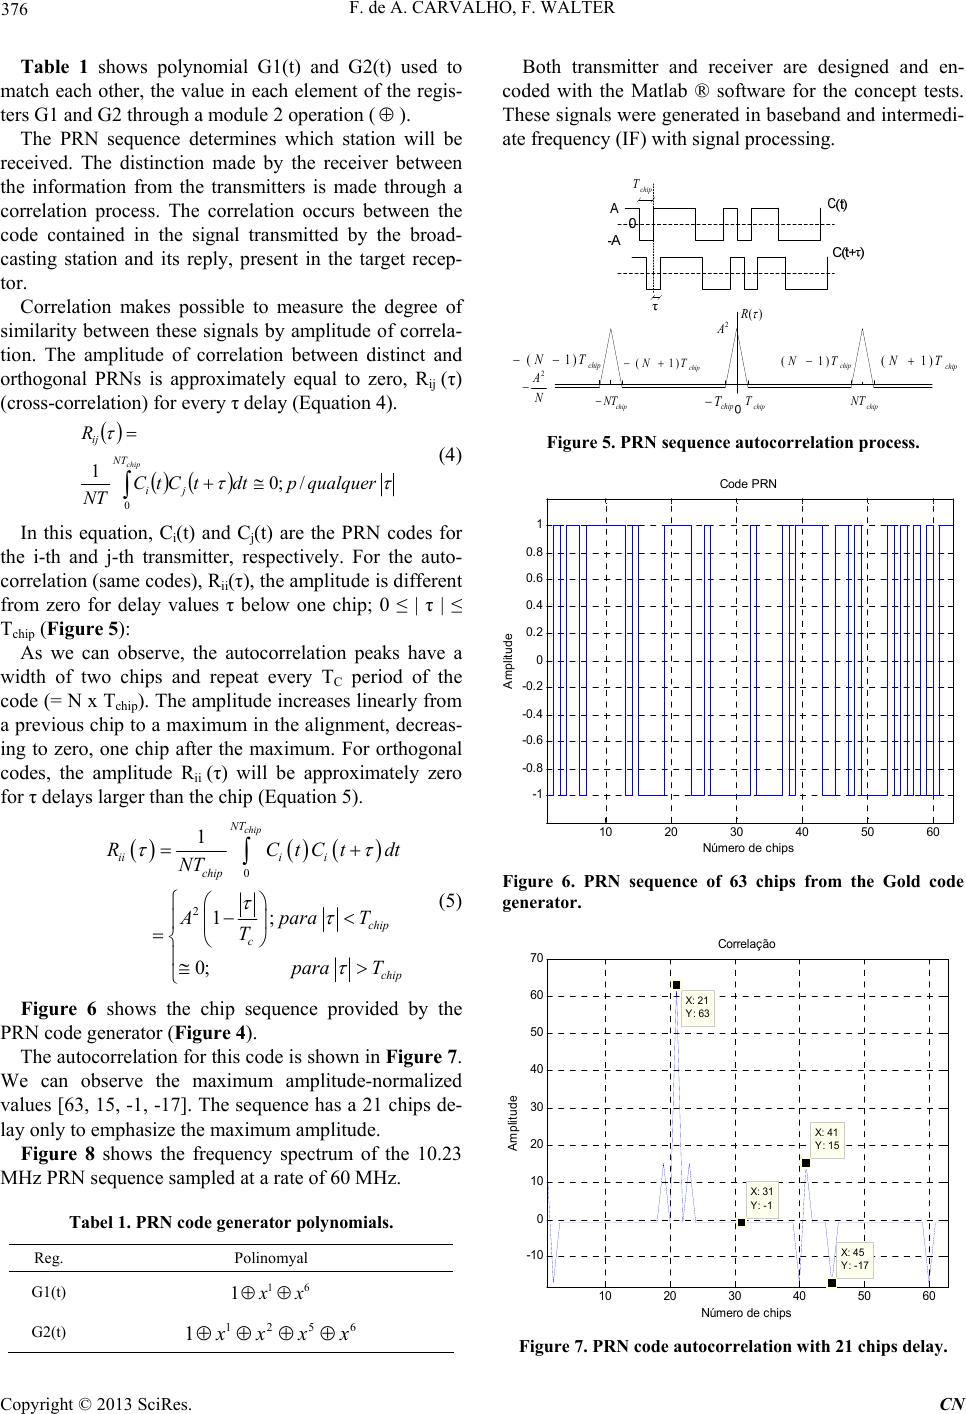
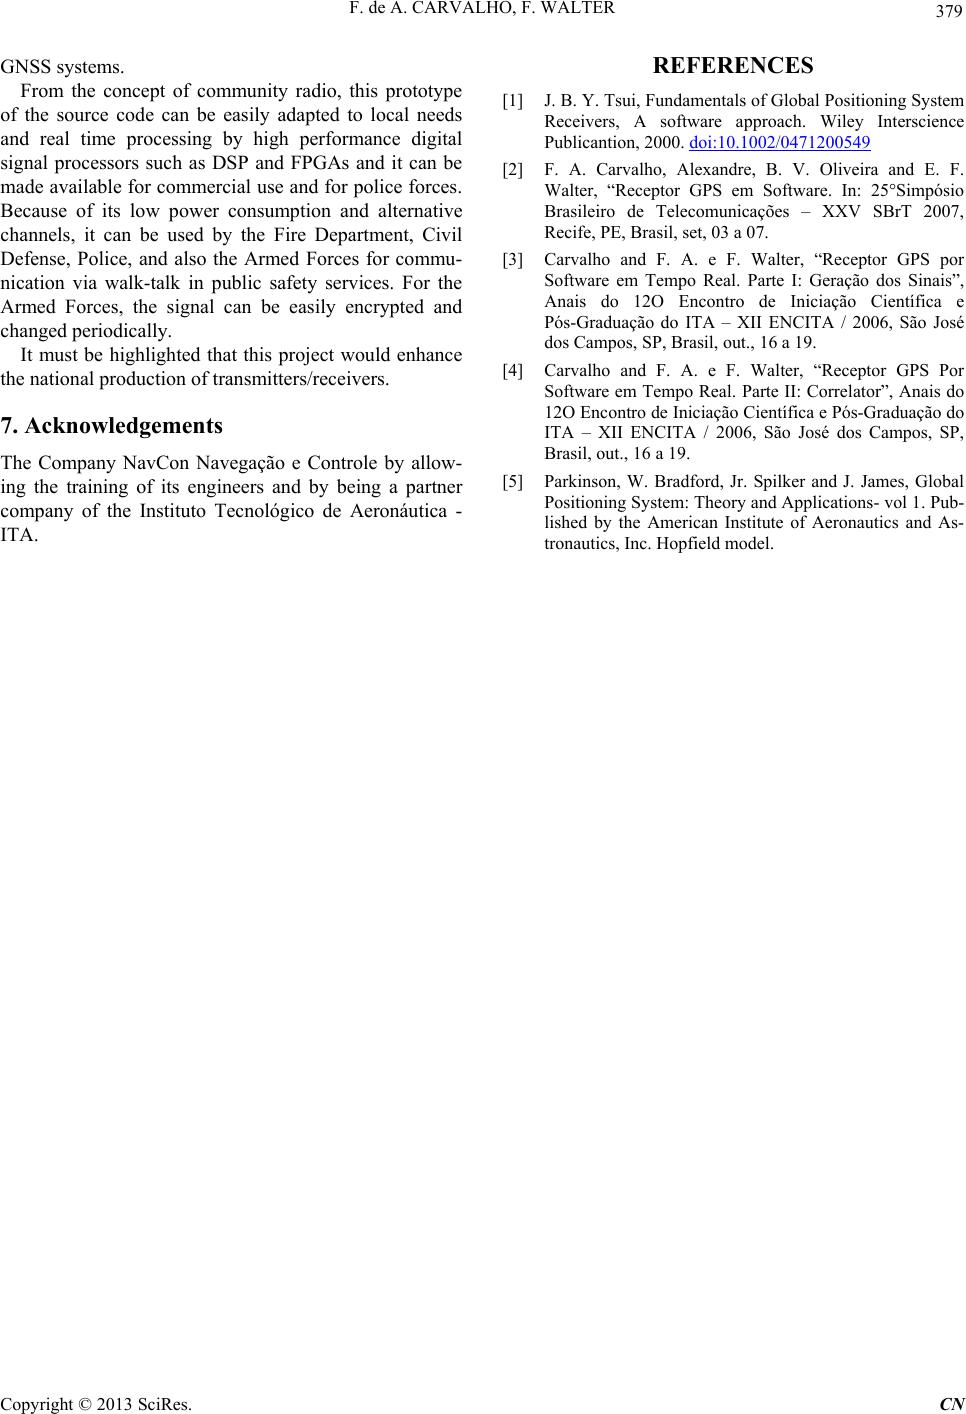
The station's signal must be weak enough to not affect
other communication systems. In this project, it is trans-
mitted with power next to the thermal noise.
Therefore, the broadcasting station reduces its inter-
ference on other communication systems.
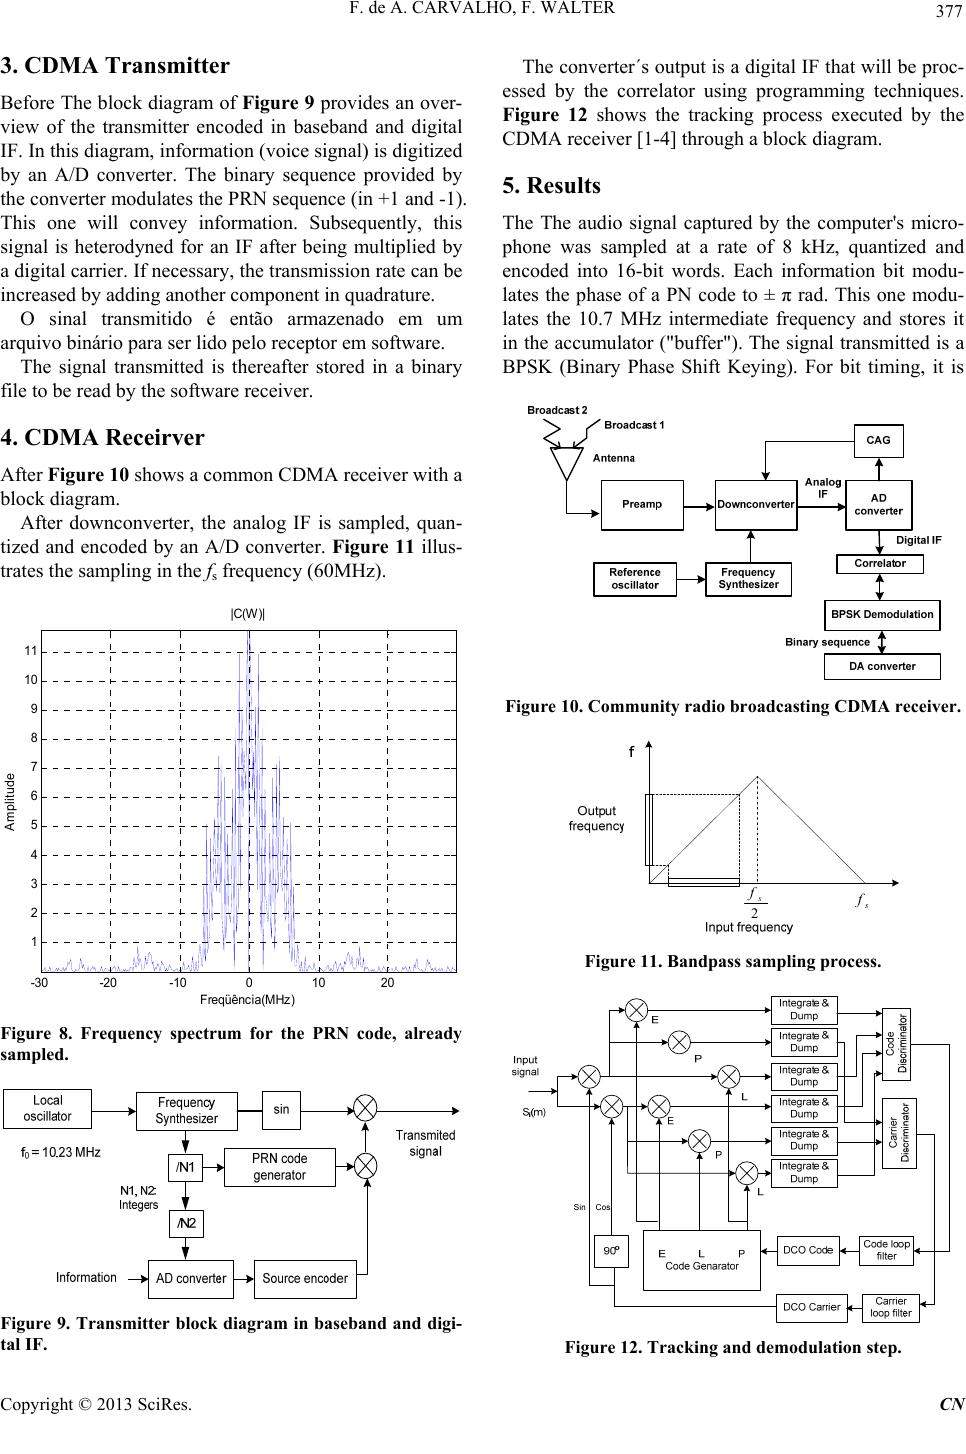
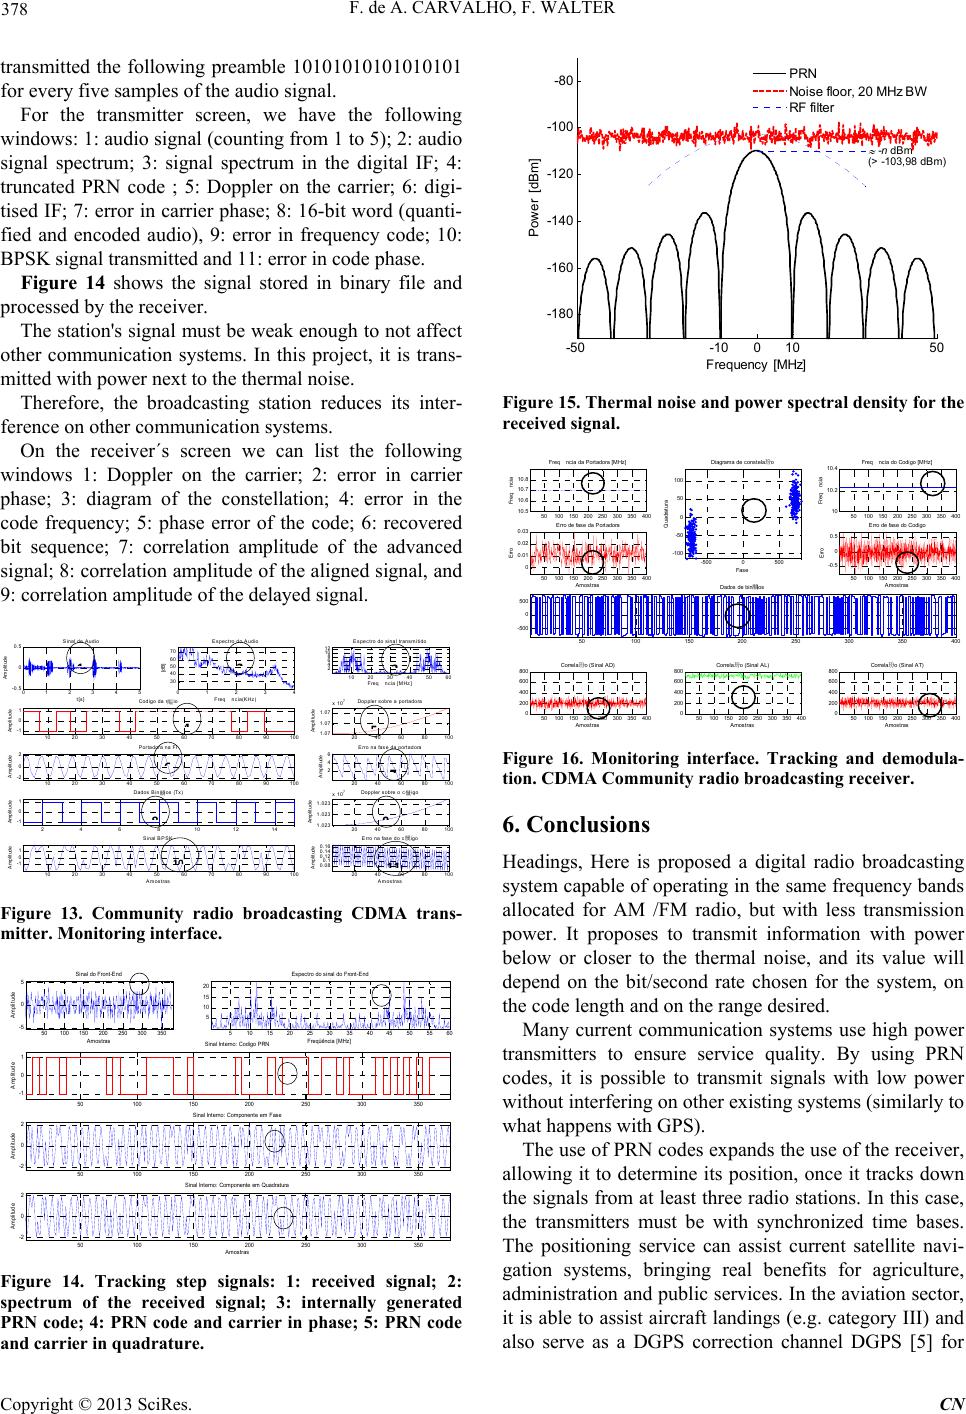
On the receiver´s screen we can list the following
windows 1: Doppler on the carrier; 2: error in carrier
phase; 3: diagram of the constellation; 4: error in the
code frequency; 5: phase error of the code; 6: recovered
bit sequence; 7: correlation amplitude of the advanced
signal; 8: correlation amplitude of the aligned signal, and
9: correlation amplitude of the delayed signal.
0 1 2 34 5
-0.5
0
0.5 Sinal de A udio
t[s]
mp
u
e
01234
30
40
50
60
70
Freq ncia(KHz)
[dB]
Espectro do Audio
10 20 30 4050 60
2
4
6
8
10
12
Es pec t ro do sinal trans m itido
Freqncia [MHz]
10 20 30 40 5060 7080 90 100
-1
0
1
Amplitude
Codigo da r醖io
20 40 60 80 100
1.07
1.07
1.07
x 107
Amplitude
Doppler so bre a portado ra
10 20 30 40 5060 7080 90 100
-2
0
2
Porta dora na F I
Amplitude
20 40 60 80 100
2
4
6Erro na fase d a portad ora
Amplitude
2468 10 12 14
-1
0
1
Dados B in醨
ios (Tx)
Amplitude
20 40 60 80 100
1.023
1.023
1.023
x 107Doppler sobre o c骴igo
Amplitude
10 20 30 40 5060 7080 90 100
-1
0
1
Sinal BPSK
Amplitude
Amostras 20 40 6080 100
0.08
0.1
0.12
0.14
0.16
Erro na fase do c骴igo
Amplitude
Amostras
Figure 13. Community radio broadcasting CDMA trans-
mitter. Monitoring interface.
50100 150 200250 300 350
-5
0
5Sinal do F ront-End
Amostras
Amplitude
510 15 20 25 30 354045 50 55 60
5
10
15
20
Es pectro do sinal do F ront - E nd
Freqüência [MHz]
50100 150 200 250300 350
-1
0
1
Amplitude
Sinal Int erno: Codi go P RN
50100 150 200 250300 350
-2
0
2
Sinal Int erno: Com ponent e em F as e
Amplitude
50100 150 200 250300 350
-2
0
2
Sinal Int erno: Componente em Q uadrat ura
Amplitude
Amostras
Figure 14. Tracking step signals: 1: received signal; 2:
spectrum of the received signal; 3: internally generated
PRN code; 4: PRN code and carrier in phase; 5: PRN code
and carrier in quadrature.
-50 -10 010 50
-1 8 0
-1 6 0
-1 4 0
-1 2 0
-1 0 0
-80
Frequency [MHz]
Power [d Bm]
-n dB m
(> -103,98 dB m )
PRN
N oise floor , 20 M Hz BW
RF filter
Figure 15. Thermal noise and power spectral density for the
received signal.
50100 150 200250300350 400
10.5
10.6
10.7
10.8
Freqnc i a da Portadora [MHz ]
Freq ncia
-500 0500
-100
-50
0
50
100
Diagrama de cons t el a玢o
Fase
Quadratura
50100 150 200250300 350 400
10
10.2
10.4 Freqncia do Codi go [MHz ]
Freq ncia
50100 150 200250300 350 400
0
0.01
0.02
0.03 Erro de fas e da Portadora
Amostras
Erro
50100 150 200250300 350 400
-0.5
0
0.5
Erro de fase do C odigo
Amostras
Erro
50100 150 200250 300 350400
-500
0
500
Dados de bin醨ios
50100 150 200250300 350 400
0
200
400
600
800 Correl a玢o (Sinal A D)
Amostras 50100 150 200 250 300 350400
0
200
400
600
800 Correla 玢o (Sinal AL)
Amostras 50100 150 200250300 350 400
0
200
400
600
800 Correla 玢o (Sinal AT)
Amostras
Figure 16. Monitoring interface. Tracking and demodula-
tion. CDMA Community radio broadcasting receiver.
6. Conclusions
Headings, Here is proposed a digital radio broadcasting
system capable of operating in the same frequency bands
allocated for AM /FM radio, but with less transmission
power. It proposes to transmit information with power
below or closer to the thermal noise, and its value will
depend on the bit/second rate chosen for the system, on
the code length and on the range desired.
Many current communication systems use high power
transmitters to ensure service quality. By using PRN
codes, it is possible to transmit signals with low power
without interfering on other existing systems (similarly to
what happens with GPS).
The use of PRN codes expands the use of the receiver,
allowing it to determine its position, once it tracks down
the signals from at least three radio stations. In this case,
the transmitters must be with synchronized time bases.
The positioning service can assist current satellite navi-
gation systems, bringing real benefits for agriculture,
administration and public services. In the aviation sector,
it is able to assist aircraft landings (e.g. category III) and
also serve as a DGPS correction channel DGPS [5] for
Copyright © 2013 SciRes. CN