Paper Menu >>
Journal Menu >>
 Energy and Power Engineering, 2013, 5, 889-896 doi:10.4236/epe.2013.54B171 Published Online July 2013 (http://www.scirp.org/journal/epe) Optimal Scheme with Load Forecasting for Demand Side Management (DSM) in Residential Areas Mohamed AboGaleela, Magdy El-Marsafawy, Mohamed El-Sobki Electrical power and Machines department, Faculty of engineering Cairo University, Giza Egypt Email: Eng.Abogaleela@gmail.com Received February, 2013 ABSTRACT Utilities around the world have been considering Demand Side Management (DSM) in their strategic planning. The costs of constructing and operating a new capacity generation unit are increasing everyday as well as Transmission and distribution and land issues for new generation plants, which force the utilities to search for another alternatives without any additional constraints on customers comfort level or quality of delivered product. De can be defined as the selection, planning, and implementation of measures intended to have an influence on the demand or customer-side of the electric meter, either caused directly or stimulated indirectly by the utility. DSM programs are peak clipping, Valley filling, Load shifting, Load building, energy conservation and flexible load shape. The main Target of this paper is to show the relation between DSM and Load Forecasting. Moreover, it highlights on the effect of applying DSM on Forecasted de- mands and how this affects the planning strategies for utility companies. This target will be clearly illustrated through applying the developed algorithm in this paper on an existing residential compound in Cairo-Egypt. Keywords: Component; Demand Side Management(DSM); Load factor(L.F.); Short Term Load Forecatsing(STLF); Long Term Load Forecasting(LTLF); Artificial Neural Network(ANN) 1. Introduction The most common rationale for Demand Side Manage- ment in the Power Sector is that it is often more cost ef- fective and socially beneficial to manage electricity de- mand through investment in efficiency and other demand side measures than to increase power supply or transmis- sion capacity. DSM programs are used to eliminate or reduce the need for additional peak or base load generat- ing capacity and/or distribution facilities. DSM also per- mits existing generation to meet the needs of a larger number of consumers or defers or reduces the need for new capacity. Utilities, however, can benefit from these reductions or shifts in customer energy use. For some utilities, DSM programs can help them reduce their peak power pur- chases on the wholesale market, thereby lowering their overall cost of operations. In the short term, DSM pro- grams can reduce energy costs for utilities, and in the long term, DSM programs can help limit the need for utilities to build new power plants, distribution, and trans- mission lines. In short, a DSM program can be much cheaper to implement than building a new generating plant. 2. DSM Programs DSM Program is a strategy used to control the load pro- file indirectly in order to achieve the utility objectives. These objectives are [1]: To have the load factor as close as possible to 1.0. To have the peak load within the system capacity. By achieving the previous objectives, the utility would get the maximum possible energy from the installed units, thus maximizing the total profit and minimizing the av- erage cost per kWh. Common techniques used for load shaping are peak clipping, valley filling, load shifting, strategic conserva- tion, strategic load growth, and flexible load shape as shown in Figure 1 [2]. DSM program can also be classified into [3]: EE (Energy efficiency) programs which are de- signed to reduce electricity consumption throughout the year by focusing on reducing energy consumption and overall energy demand. DR (Demand Response) programs which are auto- matic with a processing unit having the right to moderate or turn-off certain appliances (e.g. air-conditioners, pool pumps, washing machines, etc.) for a short period of time at customer sites. 3. Load Forecasting Electric load forecasting is an important aspect in elec- Copyright © 2013 SciRes. EPE 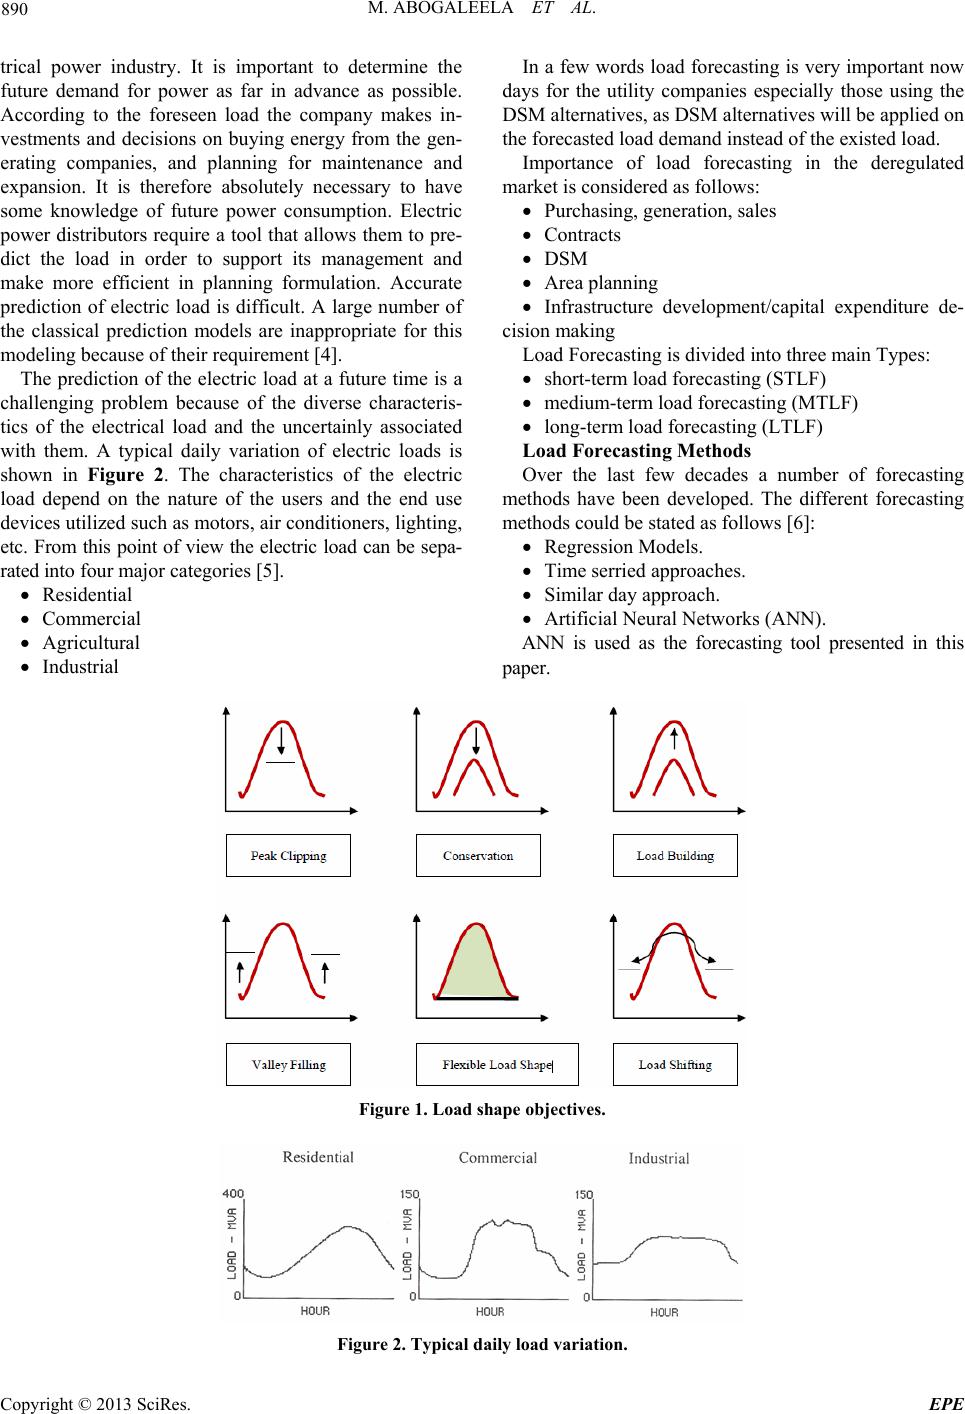 M. ABOGALEELA ET AL. 890 trical power industry. It is important to determine the future demand for power as far in advance as possible. According to the foreseen load the company makes in- vestments and decisions on buying energy from the gen- erating companies, and planning for maintenance and expansion. It is therefore absolutely necessary to have some knowledge of future power consumption. Electric power distributors require a tool that allows them to pre- dict the load in order to support its management and make more efficient in planning formulation. Accurate prediction of electric load is difficult. A large number of the classical prediction models are inappropriate for this modeling because of their requirement [4]. The prediction of the electric load at a future time is a challenging problem because of the diverse characteris- tics of the electrical load and the uncertainly associated with them. A typical daily variation of electric loads is shown in Figure 2. The characteristics of the electric load depend on the nature of the users and the end use devices utilized such as motors, air conditioners, lighting, etc. From this point of view the electric load can be sepa- rated into four major categories [5]. Residential Commercial Agricultural Industrial In a few words load forecasting is very important now days for the utility companies especially those using the DSM alternatives, as DSM alternatives will be applied on the forecasted load demand instead of the existed load. Importance of load forecasting in the deregulated market is considered as follows: Purchasing, generation, sales Contracts DSM Area planning Infrastructure development/capital expenditure de- cision making Load Forecasting is divided into three main Types: short-term load forecasting (STLF) medium-term load forecasting (MTLF) long-term load forecasting (LTLF) Load Forecasting Methods Over the last few decades a number of forecasting methods have been developed. The different forecasting methods could be stated as follows [6]: Regression Models. Time serried approaches. Similar day approach. Artificial Neural Networks (ANN). ANN is used as the forecasting tool presented in this paper. Figure 1. Load shape objectives. Figure 2. Typical daily load variation. Copyright © 2013 SciRes. EPE  M. ABOGALEELA ET AL. 891 4. Simulation Tools In this paper three tools are introduced: 4.1. Load Forecasting Tool (ANN) The use of artificial neural networks (ANN or simply NN) has been a widely studied electric load forecasting tech- nique since1990 [7] Neural networks are essentially non-linear circuits that have the demonstrated capability to do non-linear curve fitting. The outputs of an artificial neural network are some linear or nonlinear mathemati- cal function of its inputs. The inputs may be the outputs of other network elements as well as actual network in- puts. In practice network elements are arranged in a rela- tively small number of connected layers of elements be- tween network inputs and outputs. Feedback paths are sometimes used. ANN used is MATLAB based. 4.2. Smart Meter Tool A smart tool named-SEP2 Manager/ISKRA- is used through this work having the following features: Hour by Hour power consumption is recorded through the meter. Generates the data to Excel sheets. Plotting the overall daily load curve for the whole compound. Figure 3. MATLAB ANN tool main page. Figure 4. Main page of Smart meter tool[9]. Copyright © 2013 SciRes. EPE 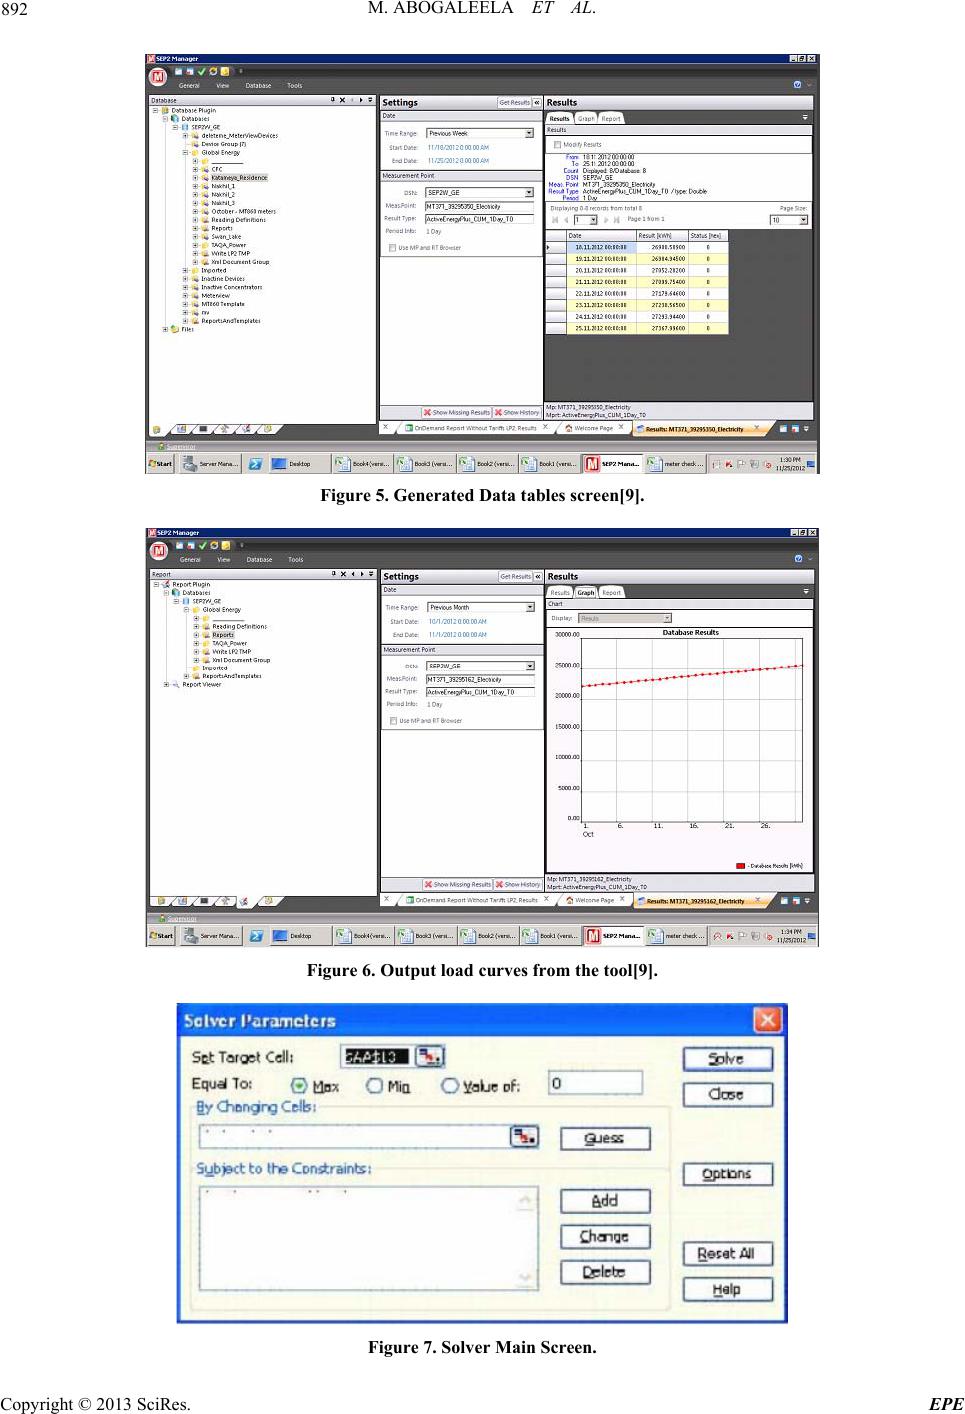 M. ABOGALEELA ET AL. 892 Figure 5. Generated Data tables screen[9]. Figure 6. Output load curves from the tool[9]. Figure 7. Solver Main Screen. Copyright © 2013 SciRes. EPE  M. ABOGALEELA ET AL. Copyright © 2013 SciRes. EPE 893 4.3. DSM Optimization Tool (Solver-Excel) based ith Algorithm Outate development located in New Cai- introduced in order to The DSM solution tool used is SOLVER EXCEL used for optimization. The main screen of solver is shown in figure 6. The objective function is written in the target cells and the constraints are written in the changing cells. 5. Practical Case Study w Description r case is Real es ro, Egypt which is fed by electric power on the22 kV with contracted capacity till 2012 is 20 MW. This com- pound is fed through a private sector company. In this section load forecasting is applied using ANN on the previous case study. Where the day of the maxi- mum demand for the previous compound was in the first week of August, so forecasting is applied to estimate the demand of this day in the next previous three years (2013, 2014&2014).Then DSM load shifting is applied on the forecasted demand. The Algorithm steps could be summarized as follows: The Historical data of the load is obtained from the tool. The historical data for the weather is obtained from the weather forecasting Agencies. These data are inserted to the ANN toolbox based under MATLAB. A forecasting model is developed based on the data entry to the ANN toolbox. A validation step should be made to the developed forecasting model. The model generates the new load demand at cer- tain required days through entering the weather condi- tions at these years.. Finally the new loads curves are plotted through excel. DSM is Load shifting is applied on the new fore- casted load curves. Problem Formulation for DS M A DSM optimization algorithm is shift loads for achieving the following objective func- tion which is maximizing load factor of the system with reducing residual Area between load and supply (i.e. increasing shared area between supply and load) and this DSM will be applied in the forecasted load curves that its load curve exceeds the supply curve in some regions [8]. Objective function: 1 ii 1 1 ,* ../() N jjJ jjJ pij tj MaxLFPTOk tj where: L.F.: is the system load factor. ,j)) : is the demand of load type i at time interval es P(i number j. N: is the total number of load demand types. J: is the total number of time intervals. PTO (j): is the total demand for all the loads typ j. from j=1 to j=J over the time interval number K: is the number of time interval at which the maximum demand for all the load types numbers from i=1, N over all the time duration from j = 1, J occurs. PTO (K): is the maximum of total demand for all the loads types. The previous objective function is subjected to the following constraints: Equality constraint: Energy consumption is the same before and after shifting. 11 ,* ,*() jJ jJ iN iN ij i pnewi jtjpoldijt j 11 j Inequality constraint: Difference between supply and load should be positive. ()sj PTOkzero Inequality constraint: Peak demand after applying shifting algorithm should be less than at before shift- e: Pnew (i,j) is the new power of each load type(i) at rval(j) after applying shifting algorithm. sults tion stage for the forecasting tput demand profiles th ing. __pmax oldpmax new wher time inte Pold (i,j) is the old power of each load type(i) at time interval(j) before applying shifting algorithm. PTO (j): is the total load power at time interval (j). S (j): is the supply value at time interval j. 6. Simulation Results 6.1. Load Forecasting Re Figure 9 explains the valida model through comparing the ou from the model at certain days where the actual demand profiles are known at those days. Figure 10 indicates the mean square error that meas- ures the deviation between the actual and forecasted de- mands. Figure 11 shows the curve fitting procedure that is made through the ANN tool box during the forecasting stage. From the previous tables and curves the following comments were noticed: The load curve at peak day of year 2013 is main- tained within the supply. The load curves at peak days of years 2014 and 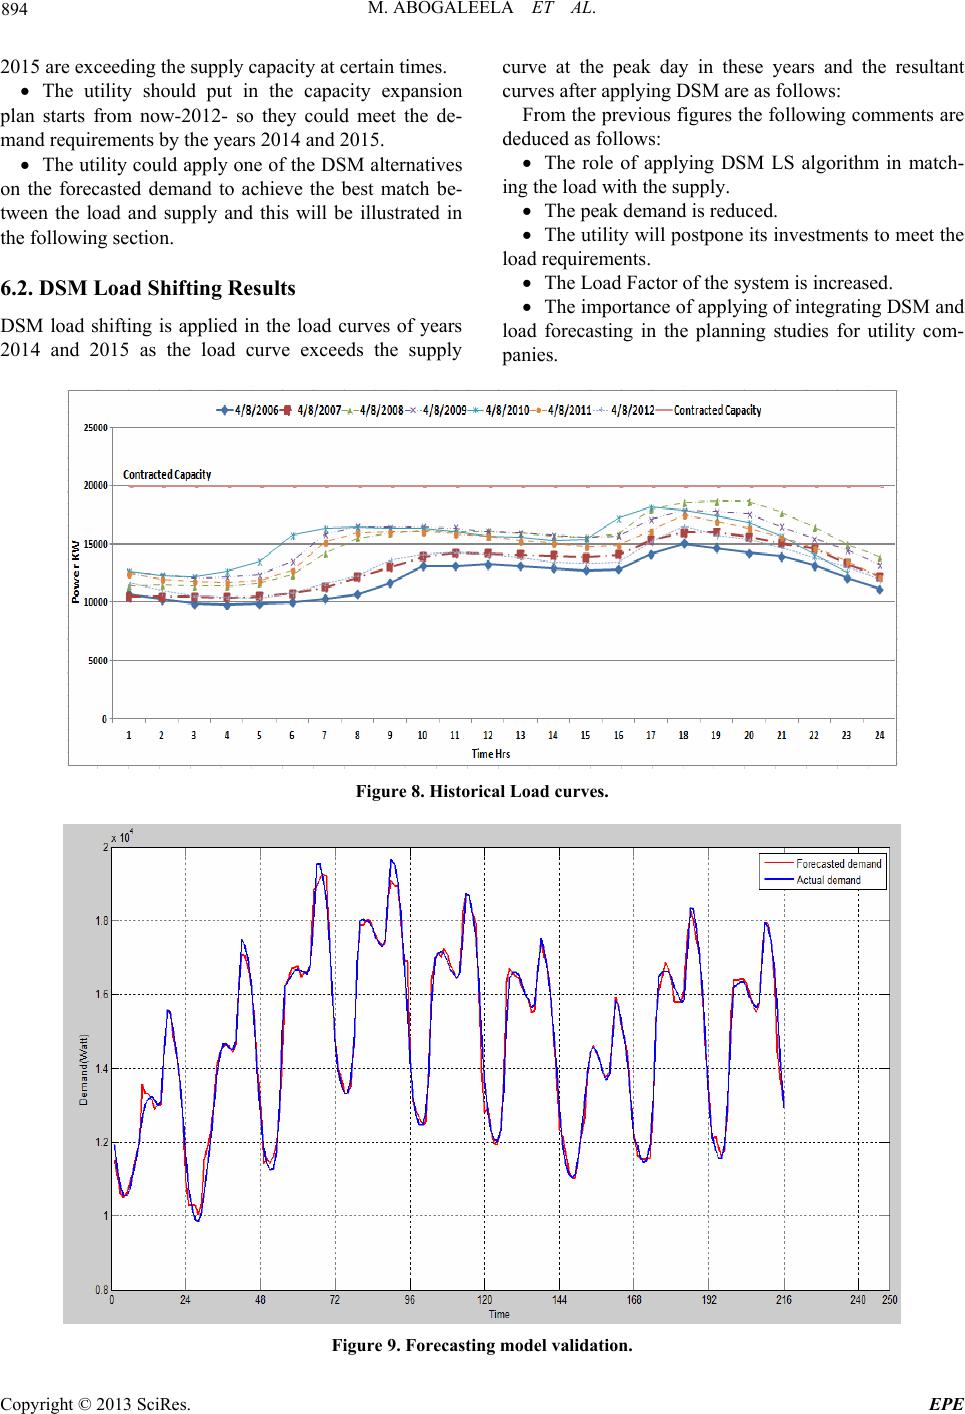 M. ABOGALEELA ET AL. 894 2015 are exceeding the supply capacity at certain times. - atc ting Results ad curves of years xceeds the s The utility should put in the capacity expansion plan starts from now-2012- so they could meet the de mand requirements by the years 2014 and 2015. The utility could apply one of the DSM alternatives on the forecasted demand to achieve the best mh be- The role of applying DSM LS algorithm in match- ing the load with the supply. tween the load and supply and this will be illustrated in the following section. 6.2. DSM Load Shif DSM load shifting is applied in the lo 2014 and 2015 as the load curve eupply The importance of applying of integrating DSM and load forecasting in the planning studies for utility com- panies. curve at the peak day in these years and the resultant curves after applying DSM are as follows: From the previous figures the following comments are deduced as follows: The peak demand is reduced. The utility will postpone its investments to meet the load requirements. The Load Factor of the system is increased. Figure 8. Historical Load curves. Figure 9. Forecasting model validation. Copyright © 2013 SciRes. EPE 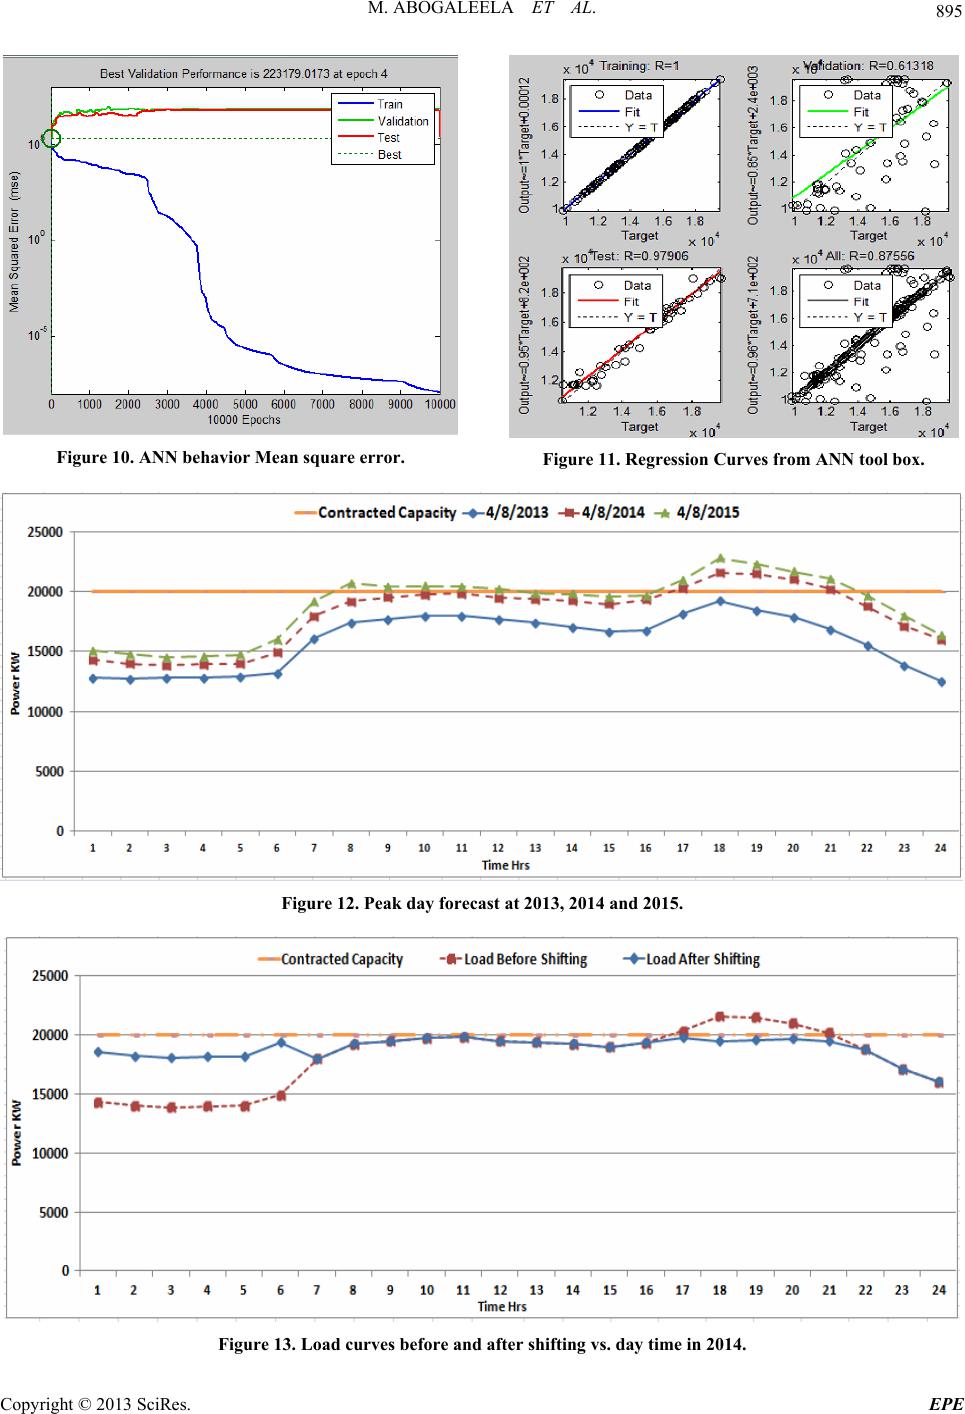 M. ABOGALEELA ET AL. 895 Figure 10. ANN behavior Mean square error. Figure 11. Regression Curves from ANN tool box. Figure 12. Peak day forecast at 2013, 2014 and 2015. Figure 13. Load curves before and after shifting vs. day time in 2014. Copyright © 2013 SciRes. EPE  M. ABOGALEELA ET AL. 896 Figure 14. Load curves before and after shifting vs. day time in 2015. . Conclusions In this paper a integrated scheme of DSM with load fo- recasting is introduced over a practical case where the following comments were noticed: Impact of applying load forecasting and knowing the peak demand. The impact of DSM in matching load curve with the supply curve. The impact of DSM in reducing the peak demand of the system. The importance of applying of integrating DSM and load forecasting in the planning studies for utility com- panies. The utility will postpone its investments in expand- ing the generation capacities to meet the load. REFE [1] H. Attia, “Mathematical Formulation of the Demand Side Management (DSM) Problem and its Optimal Solution,” Proceedings of the 14th International Middle East Power Systems Conference (MEPCON’10), Cairo University, Egypt, December 19-21, 2010. [2] Electric Power Research Institute, ―Demand-side Man- agement: Utility Options for the Future,‖ EPRI Reports, CU. 3028.10.89, 2006. [3] N. Kanoksing and W. Tayati, “Economics of Demand Side Management and Hybrid Renewable Energy System for a Remote Village Electrification in Northern Thailand, AUPEC'07, Curtin University of Technology, Perth, Aus- tralia, Dec 2007. [4] R. Achnata, “Long Term Electric Load Forecasting using Neural Networks and Support Vector Machines,” IJCST, Vol. 3, No. 1, 2012. [5] R. Holmukhe, “Artificial Neural Network based short term load forecasting technique for Indian power system energy management,” College of Engineering Bhanti dya- peetb Diversity, Pune43, 2007. [6] E. Feinberg, Applied Math & Statistics Stony Brook Uni- versity NSF workshop, November 3-4, 2003. [7] M. Peng, N. F. Hubele and G. G. Karady, “Advancement in the Application of Neural Networks for Short-Term Load Forecasting,” IEEE Transactions on Power System i:10.1109/59.141711 7 RENCES Vol. 7, 1992, pp. 250-257. s, do [8] M. Abogaleela, M. Elsobki and M. ElMarsafawy, “A Two Level Optimal DSM Load Shifting Formulation Us- ing Genetics Algorithm, Case study: Residential load, Power Africa 2012.IEEE PES, South Africa. [9] Smart Meter “Iskra” Tool Owned by “TAQA Power” Company. Copyright © 2013 SciRes. EPE |