 American Journal of Analytical Chemistry, 2013, 4, 623-632 Published Online November 2013 (http://www.scirp.org/journal/ajac) http://dx.doi.org/10.4236/ajac.2013.411074 Open Access AJAC The Challenge and Its Solution When Determining Biogeochemically Reactive Inorganic Mercury (RHg): Getting the Analytical Method Right Lian Liang1*, Milena Horvat2, John Alvarez3, Lyman Young3, Jože Kotnik2, Lisa Zhang1 1Cebam Analytical, Inc., Bothell, USA 2Department of Environmental Sciences, J. Stefan Institute, Ljubljana, Slovenia 3Chevron Energy Technology Company, Richmond, USA Email: *liang@cebam.net Received September 8, 2013; revised October 15, 2013; accepted October 28, 2013 Copyright © 2013 Lian Liang et al. This is an open access article distributed under the Creative Commons Attribution License, which permits unrestricted use, distribution, and reproduction in any medium, provided the original work is properly cited. ABSTRACT Biogeochemially reactive inorganic mercury (RHg) is an important fraction of Hg. Researchers have attempted to measure RHg when characterizing Hg-impacted sites, conducting research and development of remediation practices, or evaluating remediation efficiency. In these uses, RHg will be the best choice for analysis in ways that total methyl, and other species of Hg cannot duplicate. The fraction has been inadequately measured using the Sn2+ reduction method and operationally defined as “Sn2+ reducible Hg2+”, but the resulting data did not reflect well the nature of the fraction and caused researchers to lose interest, thus limiting the use of RHg in past years. In this work, the problems of using the Sn2+ reduction method were discovered to be generating irreproducible and negatively biased results. Negative bias from 20% to 99% was found in different types of waters. To obtain reliable results, an ethylation-based GC-CVAFS method was used to determine RHg. The performance of the method was evaluated by comparing it to the Sn2+ reduc- tion method. Biogeochemically meaningful results have been obtained in the application of the method to determine RHg in mercury mine-impacted waters from the Idrijca River in Slovenia. Keywords: Mercury Speciation; Reactive Hg2+; Method Comparison; Ethylation-GC-CVAFS; Sn2+ Reduction 1. Introduction Methyl mercury (MeHg) is an important species due to its persistence, bioaccumulation and biomagnification, and because of its toxicity to man and ecosystems [1-5]. In past decades, MeHg and the methylation/demethyla- tion process have drawn significant attention from scien- tists worldwide. Because of its high solubility, mobility, bioavailability, and especially methylation potential, bio- geochemically reactive inorganic mercury (RHg) has been recognized to be an important fraction of Hg for the transformation, reaction, and methylation of Hg in bio- geochemical cycling [6-9]. For characterization and as- sessment of Hg impacted sites, research and development of remediation practices, and evaluation of remediation efficiency, RHg may be the best choice for analysis in ways that total methyl, and other species of Hg cannot duplicate. However, unlike MeHg, RHg measurement has not gained widespread acceptance to match its im- portance, even after over two decades of practice [10]. What is the challenge, and what is the solution? In the past, in addition to “reactive Hg”, RHg was also defined or described as “easily reducible Hg”, “Sn2+ re- ducible Hg”, “acid-labile Hg”, “ionic Hg”, “labile inor- ganic Hg”, and “bio-available-inorganic Hg” [10,11]. The names related to “Sn2+ reducible” are misleading because RHg can be analyzed by other methods such as the ethylation-based GC-CVAFS method that was the technique used in this work [12-14]. The mechanism of the method is to identify and quantify the fraction of Hg2+ using the ethylation reaction, resulting in ethylat- able Hg2+, a proxy for the fraction that is available for abiotic and biotic methylation in an aqueous ecosystem. Those terms related to acid leaching [10] are also mis- leading because with acid leaching the measured fraction is no longer the naturally-occurring RHg. In this work, RHg is defined as “Hg2+ that readily enters into chemical *Corresponding author. L. LIANG ET AL. 624 reactions” [15], and measured analytically in natural wa- ters untreated with any chemicals including acidification for preservation. Careful selection of an appropriate analytical method is the key to ensuring meaningful results. In the past, the classic Sn2+ reduction method [16] has been virtually the only method used for determination of RHg [10,11], so RHg was called “Sn2+ reducible Hg”。 There is no doubt that the classic Sn2+ reduction method is a reliable method for determination of Hg2+ in chemically pre- treated media such as acid/alkaline digestates or BrCl/ KMnO4 oxidates. However, problems were encountered trying to measure RHg in waters that were not chemi- cally treated prior to Sn2+ reduction. To gain insight into these problems, this work focused on investigating the effects of analytical conditions on results from the Sn2+ reduction method in comparison with those obtained us- ing an ethylation-based GC-CVAFS method. Since the methodology of the ethylation-based GC-CVAFS me- thod has been detailed in previous publications [13,14], and successfully used to determine Hg2+ in alkaline di- gestates of biota and blood samples [17,18], the advan- tage of using this new approach for RHg was demon- strated by the discovery of bias in the Sn2+ reduction method for the determination of RHg in environmental waters, and examining whether the data generated was more indicative of the RHg, compared to using the Sn2+ reduction method. RHg-related studies conducted in past years focused on fresh waters with low levels of Hg [10], or waters already treated for removal of Hg [11]. Since RHg is an important and useful fraction to characterize Hg-im- pacted sites and evaluate the results of remediation, the present work includes analyses of both fresh waters with Hg concentration < 12 ng/L (the lowest Nationwide Cri- terion, 40 CFR 131.36) and Hg-impacted waters includ- ing industrial waste waters. Moreover, as RHg is the fraction directly linked to methylation and bioavailability, RHg was previously measured mostly in filtered samples, and defined as dissolved RHg when estimating bioavail- able Hg [11,15]. However, methylation can take place with RHg in both filtered waters and particles, so in this work both filtered and unfiltered waters were studied. To further examine whether the ethylation method can generate meaningful RHg results to characterize Hg- impacted waters, the method was applied to measure- ment of RHg in Hg mine-impacted waters from the Idri- jca River in Slovenia, and results were compared with those for total mercury (THg) and methyl mercury (MeHg) to assess their biogeochemical significance. 2. Experimental 2.1. Sample Collection and Process Water samples were collected in glass bottles with Tef- lon-lined caps. Special attention was paid to avoiding contamination according to the procedures described in EPA Method 1669 [19]. For dissolved fractions, the samples were filtered in the field immediately after sam- ple collection using 0.45 um disposable cellulose nitrate vacuum filter units. Unpreserved samples were packed in coolers at 0˚C - 4˚C and shipped overnight to the labora- tory in Bothell, WA, USA. In most cases, the lab ana- lyzed the samples within 48 hours after receipt. Sample bottles were shaken vigorously prior to sub-sampling. 2.2. Instrumentation, Standards, and Reagents For standards and reagents, only those specifically pre- pared for this work are addressed here, while others not mentioned are detailed in EPA method 1631 [20] or 1630 [21]. 2.2.1. Instrumentation A cold vapor atomic fluorescence spectrometry (CVAFS) analytical system utilizing a BR III Hg analyzer (Brooks Rand, Seattle, USA) was employed for determination of Sn2+ reduced Hg0 [20,22]. A lab-built GC/CVAFS system with a BR III Hg analyzer was used for separation and detection of ethylation derivatives of MeHg or RHg [14,21]. An AB15 pH meter (Accumet) was used for pH measurement. 2.2.2. Standards A 1000 ug/mL Hg2+ stock standard was prepared by dis- solving 0.1353 g HgCl2 (Sigma-Aldrich) into 100 mL of 5% HNO3. A working standard of 10 ng/mL Hg2+ in 0.2% HNO3 was prepared from the stock solution by di- lution. 2.2.3. Buffer A 0.5 M citrate buffer was prepared by dissolving 270 g of reagent grade citric acid (C6H8O7·H2O) and 370 g of reagent grade sodium citrate (C6H5Na3O7·2H2O) into DDW to make a 2.5-L solution. 2.3. Analytical Procedures In what follows, RHg determined by the ethylation me- thod is designated “EtRHg”, while that determined by Sn2+ reduction is designated “SnRHg”. 2.3.1. Determination of EtRHg Appropriate aliquots up to 40 mL of unpreserved sample were placed into bubblers, depending on the RHg con- centration, and distilled, deionized water (DDW) was added to bring the total volume to 50 mL. 1 mL of 0.5 M citrate buffer was added, followed by 0.05 mL of freshly thawed 1% NaBEt4 solution [21]. The bubblers were immediately capped and shaken. The bubblers sat at Open Access AJAC L. LIANG ET AL. 625 room temperature for 20 min as the ethylation reaction proceeded. Then the samples were purged with N2 at 200 mL/min for 20 min. The ethylation derivatives purged from the bubblers were collected onto Tenax traps, and finally analyzed by GC/CVAFS [14,21]. The 10 ng/mL Hg2+ working standard was used for calibration. The method detection limit (MDL) is 0.05 ng/L. 2.3.2. Determination of SnRHg Appropriate aliquots up to 100 mL of unpreserved sam- ple were placed into bubblers, depending on the RHg concentration. DDW was added to bring the total volume to 100 mL. 0.2 mL of 25% SnCl2 (w/v) in 20% HCl was added. The samples were purged with N2 at 300 mL/min for 20 min to remove Sn2+ reduced Hg0. The purged Hg0 was collected on gold traps and then analyzed by CVAFS [20,22]. The MDL is 0.2 ng/L. 2.3.3. Determination of THg Samples were oxidized with BrCl overnight, and excess BrCl was reduced with NH2OH solution prior to analysis [20,22]. Appropriate sample aliquots depending on THg concentration were placed into bubblers, and DDW was added to adjust the volume to 100 mL. Samples were then purged and Hg0 was quantified as described above for the SnRHg procedure. The MDL is 0.2 ng/L. 2.3.4. Determination of MeHg Samples were acidified to 4% HNO3, then allowed to sit overnight or longer at room temperature prior to sample preparation and analysis using EPA 1630 [21]. The MDL is 0.02 ng/L. 2.4. Experiments Examining the Effects of Analytical Conditions on the Sn2+ Reduction Method 2.4.1. The Effect of pH Fourteen 500-mL bottles were prepared, each containing 400 mL DDW and 0.8 mL 25% SnCl2 (w/v, in 20% HCl). Diluted NaOH and HCl solutions were used to adjust the pH of these samples within a range of 2 to 13. From each bottle, 3 aliquots of 100 mL each were transferred into 3 pre-cleaned bubblers. Two of the bubblers were spiked with 280 pg of Hg2+ standard in 0.04 mL 0.2% HNO3 solution, while the third bubbler served as a blank. Sam- ples in the bubblers were analyzed for Sn2+ reducible Hg by purge/trap/CVAFS. The pH of each sample was measured after purging. 2.4.2. The Effect of SnCl2 Concentration A 2.0 L glass volumetric flask was half-filled with DDW, and 2 mL of concentrated HNO3 and 5.6 ng of Hg2+ stan- dard were added. The flask was then filled to the neck with DDW and shaken. The Hg2+ concentration in this sample was 2.8 ng/L. Aliquots of 100 mL were placed into bubblers, and then various volumes (0.05, 0.10, 0.20, 0.40, 0.60, 0.80, and 1.00 mL) of 25% SnCl2 (w/v, in 20% HCl) were added, corresponding to SnCl2 concen- trations of 0.013, 0.025, 0.050, 0.100, 0.150, 0.200, and 0.250% (w/v). These samples were then analyzed for Hg2+ by purge/trap/CVAFS. Analyses were performed in duplicate for each SnCl2 concentration. 2.4.3. The Effect of Purge Gas Rate and Purge Time Municipal waste water was collected in a 4-L glass bottle. Observable particles in the water were removed by filtra- tion using thin paper napkins. Filtration blanks showed no significant Hg concentration. Concentrations of EtRHg and THg in the sample were determined at the optimal conditions of the methods, and found to be 13.54 ± 0.62 ng/L (n = 6) and 34.7 ± 1.4 ng/L (n = 6), respec- tively. The sample was then analyzed for THg and SnRHg at various purge gas flow rates and purge times. The analysis was performed in duplicate under each ana- lytical condition, and the mean value of duplicate results was calculated. Recoveries of THg at various conditions were calculated relative to the result (34.7 ng/L) deter- mined at optimal conditions, while SnRHg recoveries were calculated relative to the optimal EtRHg result (13.54 ng/L). 2.4.4. The Effect of Purge Time on Recovery of SnRHg in River Waters with Low Level Hg Twelve river water samples were collected, and each was analyzed for SnRHg using two different purge times (20 min and 40 min). These samples were visually clear (to- tal suspended solids (TSS) < 4 mg/L), and THg concen- trations ranged from 1 to 8 ng/L. Unfiltered and unpre- served waters were analyzed. EtRHg concentrations in these waters were also determined, and the results were used as benchmarks for calculating the recoveries of SnRHg for different purge times. All samples were ana- lyzed in duplicate for both EtRHg and SnRHg, while matrix spike (MS) measurements were performed on each sample only for EtRHg analysis, to examine matrix interferences. 2.4.5. The Effect of Purge Time on Recoveries of SnRHg in Hg Impacted Waters Twelve industrial waste water samples collected from a waste treatment site were used for the experiment. These samples looked clear (TSS < 5 mg/L), and THg concen- trations ranged from 5 to 100 ug/L. Unpreserved and unfiltered samples were analyzed for SnRHg using two different purge times (20 min and 48 hours). These sam- ples were also analyzed for EtRHg, and the EtRHg con- centrations were used for calculating SnRHg recoveries. All samples were analyzed in duplicate for both EtRHg Open Access AJAC 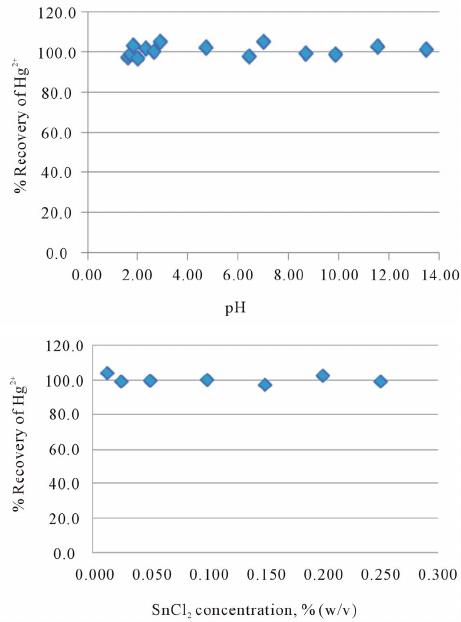 L. LIANG ET AL. 626 and SnRHg, while MS measurements were again per- formed only for EtRHg analyses. 2.4.6. The Behavior of Purging SnRHg from a Typical Complex Matrix A Hg-impacted industrial waste water sample was used for the experiment. The sample looked dirty and con- tained some suspended solids. The sample was shaken vigorously prior to sub-sampling, then analyzed for THg, MeHg, and EtRHg; concentrations were 6.16 ug/L, 2.96 ng/L, and 2.97 ug/L, respectively. 3 mL of well-mixed, unpreserved, and unfiltered water was added to 50 mL DDW in a bubbler for reaction with 0.2 mL of SnCl2 (25%, w/v, in 20% HCl). The 20 min purge/trap/mea- surement procedure was then repeated over and over, one time after another. After 24 cycles, with Hg0 still coming out of the sample and no idea how many more cycles would be needed, the bubbler was purged for 4 hours for the 25th cycle. Finally, the 26th cycle of 20 min showed no detectable Hg0, suggesting that RHg and Hg0 had been completely removed. 2.4.7. The Stability of RHg in Unpreserved Waters Six unpreserved river water samples with various con- centrations of RHg were collected in 1-L glass bottles and shipped to the lab overnight, on ice. The samples looked clear (TSS < 7 mg/L), suggesting the sample ma- trices might not be complex. The samples were allowed to warm to 20˚C after receipt, and then analyzed for EtRHg. The analyses were carried out multiple times for each sample, at 4, 24, 48, and 72 hours after sample re- ceipt. All analyses were performed in duplicate and the mean value of duplicate results was calculated. Samples were well-mixed prior to sub-sampling. 3. Results and Discussion 3.1. Effect of Analytical Conditions on the Results for Hg2+ Using the Sn2+ Reduction Method The effects of pH and SnCl2concentration on the results of the Sn2+ reduction method are shown in Figure 1. It is worth noting here that the analyte is Hg2+ rather than RHg because this experiment is designed to examine whether pH or the SnCl2 concentration effect results during Sn2+ reduction. Here, the reaction matrix was DDW rather than natural water, and the Hg2+ was not naturally occurring RHg. For the effect of pH, each point is the mean of the results from two duplicate samples. The relative percent difference (RPD) between duplicate samples was <5% for 14 samples at various pH levels. The average recovery of Hg2+was 100.8% ± 2.7% (n = 14), indicating the results are independent of pH. For the effect of the SnCl2 concentration, average recovery was Figure 1. The effect of pH and SnCl2 concentration on re- sults of Hg2+. 100.4 ± 2.23% (n = 7) with RSD = 2.2%, indicating that the SnCl2 concentration in the range tested does not af- fect the results for Hg2+. The results shown in Figure 1 clearly indicate that the “chemically-related factors” of pH and SnCl2 concentration do not affect the Hg2+ results. In contrast, it was found that the “physical factors” of purge gas flow rate and purge time critically affect the results (Figure 2). For the effect of gas flow rate shown in Figure 2, for THg, the recovery increased with increasing gas flow rate before reaching 100% recovery at flow rates be- tween 260 to 370 mL/min. 370 mL/min is the highest useable flow rate without breakthrough using our gold traps (Cebam Analytical, Inc.), then recoveries decreased at higher flow rates; for SnRHg, the recovery also in- creased with increasing gas flow rate, but the highest recovery was found to be only around 40%, and lower values were recorded with further increases in flow rate, again due to breakthrough. This indicated that for SnRHg analysis with a purge time of 20 min at the highest flow rate allowed, only 40% of the SnRHg in this sample was recovered; i.e., the result was negatively biased by 60%. Because there is no range of flow rates at which a plateau in the recovery data is established, it would be difficult to obtain reproducible results for replicate analyses. This Open Access AJAC 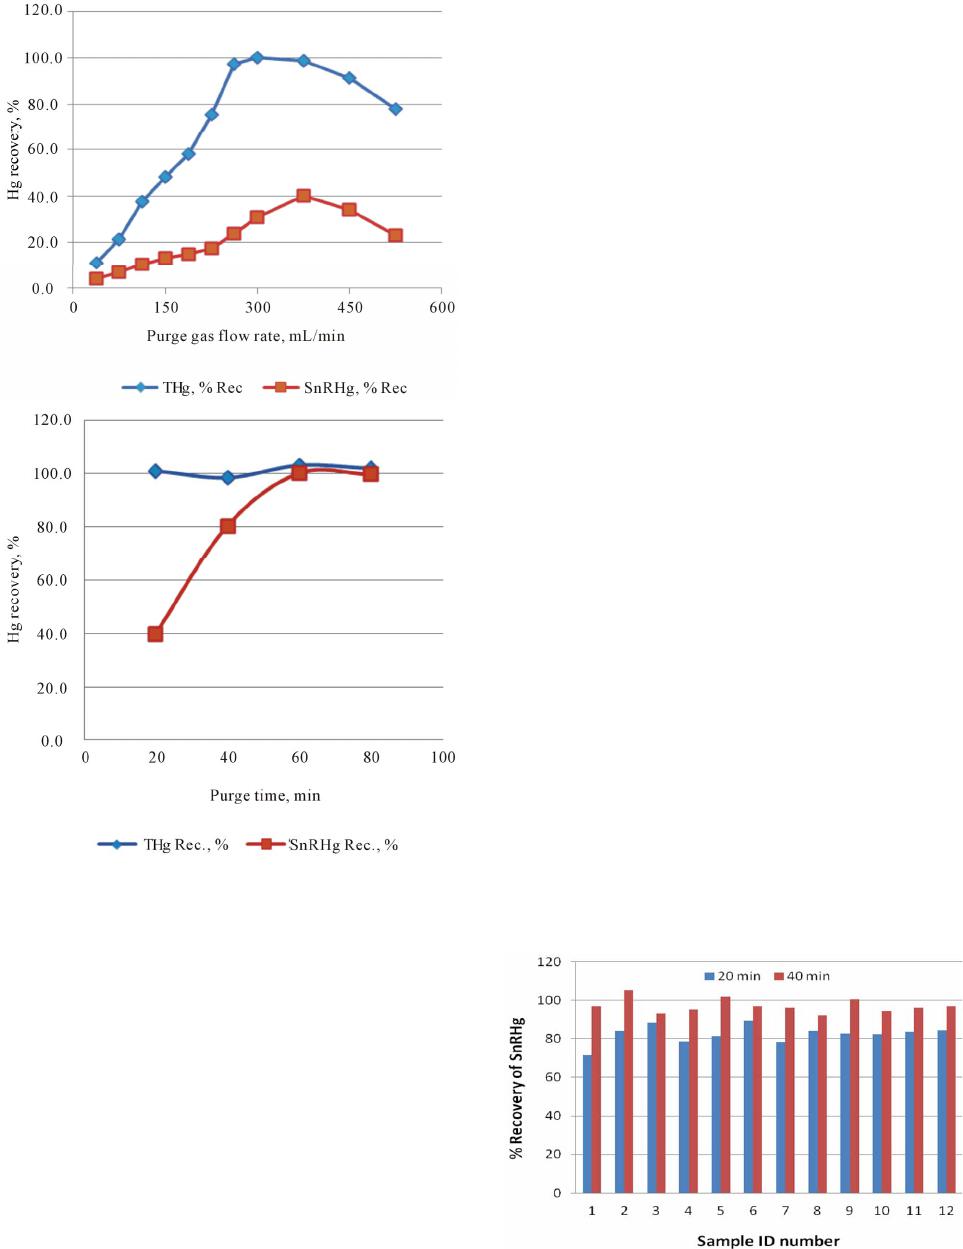 L. LIANG ET AL. 627 Figure 2. Effect of purge gas flow rate (purge time 20 min), and purge time on Hg recovery (purge flow rate 350 mL/ min). explains why previous results using the Sn2+ reduction method were found to be irreproducible and imprecise. For the effect of purge time (Figure 2), 100% recov- ery of SnRHg can be obtained only when the sample is purged for long enough and insufficient purge time leads to lower results for SnRHg. This raises the question of why 20 min was enough to purge the Sn2+-reduced Hg0 for analysis of THg (reaching 100% recovery), but a longer time was required for analysis of SnRHg using the same technique. The only difference in the analytical procedures between THg and SnRHg is that for THg, Sn2+ reduction was carried out in samples which had been oxidized (or digested) with oxidants such as BrCl [20], KMnO4, H2SO4, HNO3 (used by many EPA THg methods), or others, while for SnRHg, the samples were unpreserved and untreated chemically prior to Sn2+ re- duction. It was also found that purging Sn2+-reduced Hg0 from DDW required as much purge time as the oxi- dized/digested medium. Thus, recovering Sn2+-reduced Hg0 from an unpreserved/undigested medium required a longer purge time than from an oxidized/digested me- dium or from DDW. The reason for this will be discussed below. 3.2. The Effect of Purge Time on Results of SnRHg Analysis of River and Industrial Waste Waters To confirm the effect of purge time on the results of SnRHg analysis, more natural river waters with low Hg concentrations and Hg-impacted industrial waste waters with high Hg concentrations were analyzed by the Sn2+ reduction method. Figure 3 shows the effect of purge time on SnRHg results for 12 river water samples. For these relatively clean waters, a 20-min purge recovered about 80% of the RHg, i.e. a negative bias of about 20%. For filtered natural waters, similar patterns were ob- served. However, for the highly contaminated industrial waste waters with complex matrices (Figure 4), for a purge time of 20 min recovered only very small fractions (0.7% to 1.9%) of the RHg, but after purging for 48 hours, 100% recoveries were reached. This reveals how severely biased previous results may have been when the Sn2+ reduction method was used for Hg-impacted waters. 100% recovery can only be reached when the sample is purged for a long enough time. How can we tell if the RHg is recovered completely by this method? By purg- ing a sample for a cycle time such as 20 min, the Hg col- lected on the trap may be measured, and then a new trap is used for the next purge cycle. This is continued until the Hg collected on a trap is not detectable. Then the Hg loaded on all the traps is summed to yield the result for RHg in the sample. Figure 3. Effect of purge time on recoveries of SnRHg in 12 river water samples. Open Access AJAC 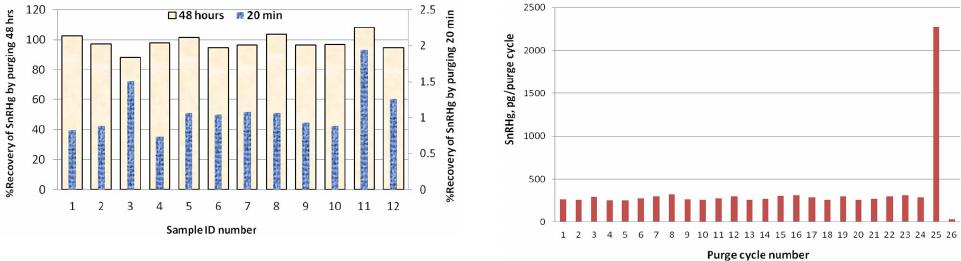 L. LIANG ET AL. 628 Figure 4. The effect of purge time on the recoveries of SnRHg in 12 Hg impacted industrial waster waters. 3.3. Purging Sn2+-Reduced Hg0 from Industrial Waste Waters Having High Hg Concentrations and Complex Matrices To get clearer insight into the purging behavior of Sn2+- reduced Hg0 another experiment was conducted using an Hg-impacted industrial waste water sample (Figure 5). The sample was purged for 26 cycles as described above and the concentration of RHg in the sample was calcu- lated by summing the mass of RHg recovered over all cycles; the result was found to be 2.99 ug/L. Here, it is worth emphasizing that the concentration of RHg by Sn2+ reduction was found to be equivalent to the EtRHg concentration in the sample, i.e., SnRHg ≈ EtRHg. This confirmed the finding in the low level Hg samples (Figure 3), and the Hg-impacted samples (Figure 4), as well as other samples investigated when samples were purged for long enough: The two independently-defined quantities based on two different chemical reactions, ethylation and Sn2+ reduction, were found to represent the same fractions, RHg. Further consideration of the results in Figure 5 show: 1) the sum of RHg purged from the 1st to the 24th cycle was 6707 pg, the average was 279 pg per cycle, and the RSD was 7.7%, indicating that Sn2+-reduced Hg0 was purged out steadily over time; and 2) the mass of RHg purged in the 25th cycle was 2270 pg, and, according to the average rate of the first 24 cycles, 3 hours would have been enough for the 25th cycle. Again, the relation- ship SnRHg ≈ EtRHg can be established only when the sample is purged long enough to ensure the Sn2+-reduced Hg0 is purged out completely. The behavior shown in Figure 5 was similarly found in purging naturally occurring Hg0 from various Hg-im- pacted waste waters, and also found by Horvat [23] in measurements of Hg0 evasion in Hg-impacted river wa- ters. The analysis of Hg0 requires only the purge/trap step prior to CVAFS detection; there were no chemical reac- tions/treatments involved. This may suggest that the long purge time required was for the isolation of Hg0 from the sample medium, regardless of any chemical processes. Based on the nature of Hg0, it may be adsorbed to or- Figure 5. Behavior of purge 8977 pg of Hg0 reduced by Sn2+ from 3 mL Hg contaminated water, the 25th purge cycle is 4 hours, other 20 min. ganic/inorganic substances in the medium, and this bind- ing makes purging the Hg0 difficult. Conversely, the purging of Hg0 from DDW requires less time compared to unpreserved/undigested water because Hg0 occurs free of binding in DDW. An additional or alternative expla- nation for this observation is that the binding between RHg and natural organic material (NOM) makes RHg resistant to reduction by Sn2+ [24-26]. Moreover, as mentioned above, isolating Sn2+-reduced Hg0 from DDW required the same purge times as from oxidized/digested medium. Thus, Hg0 is also present free of binding in oxidized/digested medium, suggesting that this apparent binding mechanism can be destroyed by oxidation/digestion, setting Hg0 free in the medium. This also explains the difference in recoveries between THg and RHg in Figures 4 and 5, where THg can be fully recovered easily by a 20 min purge, but SnRHg cannot. In addition to the negative bias described above, there is potentially a positive bias when waters contain natu- rally occurring Hg0 or dimethyl Hg. It is clear that these species may also be purged, collected, and measured together with Sn2+-reduced Hg0. This positive bias will be discussed below. 3.4. Matrix Interference in the Ethylation Method Matrix interference with the ethylation reaction is a po- tential problem in the determination of MeHg in various matrices [17,18,21], and the same applies to RHg. This is why distillation or other techniques were developed for the isolation of MeHg from matrices prior to ethylation [27,28]. However, existing techniques for the isolation of MeHg cannot be applied for the isolation of RHg because the nature of this fraction will change during processing. Fortunately, matrix interference of the ethylation reaction was found to be easily eliminated by simply diluting the samples. The ratio of RHg to MeHg generally ranges from 10 to 10n depending on the site, and the more im- pacted the site is, the greater the value of n. This allows Open Access AJAC 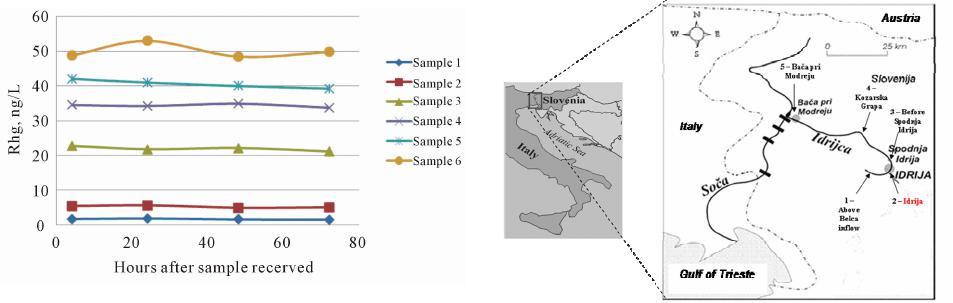 L. LIANG ET AL. 629 diluted samples to be analyzed without matrix interfer- ence [29,30]. The lowest RHg concentrations were found to be >0.5 ng/L, which is about 10 times the MDL, 0.05 ng/L. Matrix interference was determined by analyzing samples spiked with Hg2+ standard. Spike recoveries ranging within 75% to 125% were considered to show no matrix interference. In the experiments on the effect of purge time on the recovery of SnRHg, a MS sample was analyzed for each sample for determination of EtRHg. MS recoveries for 12 unfiltered river samples were found to range from 83% to 107%, while recoveries of 91% to 112% were found for 12 industrial waste water samples. The industrial waste waters were analyzed after dilution by up to 1000 or more times. 3.5. Stability of RHg in Unpreserved Water Samples The results shown in Figure 6 indicate that RHg was stable at 20˚C for at least 72 hours after sample receipt. If the sample shipping time was 24 hours, the samples would thus have been stable for 96 hours after collection. The samples used here were relatively clear, with TSS < 7 mg/L, suggesting that the sample matrices were not complex. Since the stability of RHg may depend strongly on various biogeochemical factors, its relative stability in these water samples for 96 hours does not necessarily ensure its stability in other samples. To obtain reliable results, water samples should be analyzed as soon as possible after sample collection. Freezing of samples is not recommended because adsorption of RHg on the container wall could increase with decreasing tempera- ture. Generally, water samples for analysis of trace metals are preserved with acids such as HNO3 and HCl to main- tain the stability of the analytes for a longer time. In past years, water samples analyzed for RHg were sometimes acidified with HCl prior to analysis [31-34]. However, to maintain the original state of the RHg, water samples Figure 6. Observation of stability of RHg in unpreserved surface water at 20˚C. should not be preserved. Nevertheless, waters acidified to 4% HNO3 or HCl were also investigated in this work, and results around 30% lower than those found in unpre- served waters were observed. This result is similar to that reported by Bloom [10]. MeHg was also involved in these experiments, but in contrast to RHg, higher results for MeHg were found in acidified waters. 3.6. Application of the Ethylation Method to the Determination of RHg in Hg-Impacted Waters from the Idrijca River, Slovenia The Idrijca River in Slovenia drains the area of the Idrija Hg mine, now closed but formerly the world’s second largest Hg mine. Five sampling locations were selected along the Idrijca River (Figure 7), representative of dif- ferent levels of Hg impact as determined by previous studies [15,35-39]. The first location, above the Belca inflow, is a pristine site with very low Hg contamination, while all the downstream sampling sites are affected by the Hg mine to some extent [36]. The second site, in the town of Idrija, is where the mine drainage enters the river. The third location, above the town of Spodnja Idrija, is situated approximately 200 m downstream of the outflow of a municipal wastewater treatment plant. The fourth site, Kozarska grapa, is approximately 15 km down- stream from Spodnja Idrija in a rural area; and Bača pri Modreju, the final sampling site, is about 1 km upstream of the confluence of the Idrijca River with the Soča River (Isonzo). The pH in the river is between 7.73 and 8.82, and the solute composition is dominated by 3 HCO , Ca2+ and Mg2+ [35]. Water temperatures range from about 6˚C in the winter to 18˚C in summer. Monitoring RHg in the Idrijca River was carried out to demonstrate the advantages of the ethylation based method. In the past, Sn2+ reduction has been the only method for measuring RHg at the site. Since the river- drains the area of the former Hg mine, the water contains a significant amount of Hg0 [15]. To eliminate the posi- tive bias caused by naturally occurring Hg0, the samples Figure 7. Sampling locations on the river Idrijca. Open Access AJAC 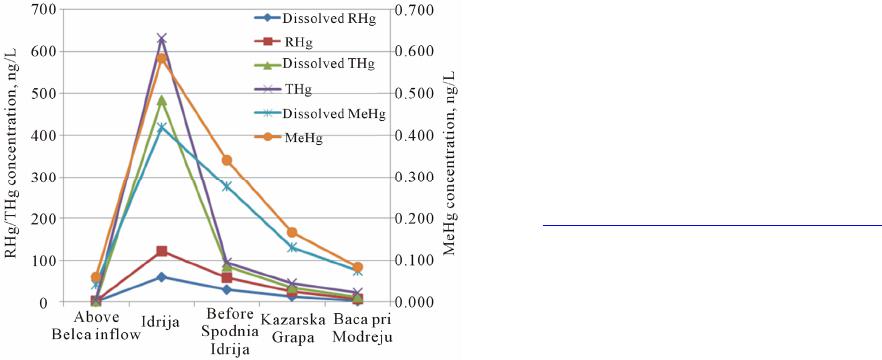 L. LIANG ET AL. 630 were pre-purged prior to adding the Sn2+ reagent. How- ever, purging for 10 to 20 min might not be enough to completely remove naturally occurring Hg0 from highly contaminated samples like these (THg up to 650 ng/L), and a positive bias might result. In contrast to this posi- tive bias, negative bias might be introduced in the sub- sequent Sn2+ reduction of RHg due to an insufficient purge of Sn2+-reduced Hg0. As a result, the data might be highly variable and uncertain due to both positive and negative bias effects. When the ethylation based method was used, neither positive nor negative bias effects were encountered. To examine whether the ethylation method can gener- ate results meaningful for the characterization of Hg speciation in this river, water samples from the five loca- tions were collected in the summer of 2012. Filtration was performed immediately after sample collection at all sites. Both filtered and unfiltered samples were analyzed for THg, MeHg, and EtRHg. Results for RHg determined using the ethylation based method and for other Hg spe- cies measured in the same samples are shown in Figure 8. Concentrations of the various species at the five sam- pling locations were compared and found to vary in ways consistent with each other in response to changes in dilu- tion, mixing, rainfall, etc. For all Hg species/fraction, the highest concentrations were found at the location of the Idrija Hg mine, and concentrations decreased downstream but in different patterns for the different Hg species/fraction. The THg concentration dropped quickly within a relatively short distance (about 10 km), then gradually decreased, ap- proaching the RHg concentration. This indicates that, in addition to RHg, THg includes other Hg species such as Hg0, HgS, Hg2Cl2, HgSe, etc. In the river, Hg0 evasion and the adsorption/precipitation of HgS, Hg2Cl2, and HgSe may take place, resulting in decreasing THg con- Figure 8. Concentrations of Hg species/fractions measured in the River Idrija in Slivenia. centrations which gradually approach the RHg concen- tration. In this particular case, Hg0 evasion enhanced by the turbulent, torrential nature of the river is likely the major cause of the dramatic decrease in the THg concen- tration downstream from the Hg mine. Compared to THg, RHg concentrations vary differently and in a pattern that was not affected by Hg0 evasion. Concentrations of MeHg decreased downstream of the mine, but in another, different pattern compared to both THg and RHg. 4. Conclusion This work has identified and characterized appropriate and reliable analytical methods capable of producing accurate, precise, and meaningful results for RHg. The positive and negative biases that can arise in using the Sn2+ reduction method for the determination of RHg have been described, and the use of the alternative ethylation GC-CVAFS method is recommended. Using the ethyla- tion based method, it is confident that results generated are the biogeochemically reactive fractions of Hg2+. As any good measurements always can promote the research growing up, it is believed that the discovery of the ana- lytical problems using the Sn2+ reduction method for de- termination of RHg will draw significant attention from environmental researchers in the world. Once the prob- lems outlined in this work are recognized and the ethyla- tion based GC-CVAFS method is used, measurement of RHg will become widespread because it will provide the researchers with meaningful data. It is believed that a breakthrough in the research of Hg biogeochemistry is a possible outcome. 5. Acknowledgements The work was partially funded by the Slovenian Re- search Agency (ARRS) through programme P1-0143 and project J1-4288, and also supported by Chevron Energy Technology Company under Contract CW831200. V. We thank Fajon for sampling the water samples from the river Idrijca. REFERENCES [1] T. W. Clarkson and L. Magos, “The Toxicology of Mer- cury and Its Chemical Compounds,” Critical Reviews in Toxicology, Vol. 36, No. 8, 2006, pp. 609-662. http://dx.doi.org/10.1080/10408440600845619 [2] T. Barkay and I. Wagner-Dobler, “Microbial Transforma- tions of Mercury: Potentials, Challenges, and Achieve- ments in Controlling Mercury Toxicity in the Environ- ment,” In: A. I. Laskin, J. W. Bennett and G. M. Gadd, Eds., Advances in Applied Microbiology, Vol. 57, El- sevier Academic Press Inc., San Diego, 2005, pp. 1-52. [3] M. Horvat, J. Snoj Tratnik and A. Miklavcic, “Mercury: Biomarkers of Exposure and Human Biomonitoring,” In: Open Access AJAC  L. LIANG ET AL. 631 L. E. Knudsen and D. F. Merlo, Eds., Biomarkers and Human Biomonitoring, Issues in Toxicology, No. 9, RSC Publishing, Cambridge, 2012, pp. 381-417. [4] M. C. Newman, X. Y. Xu, A. Condon and L. Liang, “Flood- plain Methylmercury Biomagnification Factor Higher than That of the Contiguous River (South River, Virginia USA),” Environmental Pollution, Vol. 159, No. 10, 2011, pp. 2840-2844. http://dx.doi.org/10.1016/j.envpol.2011.04.045 [5] J. C. Wang, M. C. Newman, X. Y. Xu and L. Liang, “Higher and More Variable Methylmercury Biomagnifi- cation Factors for Floodplain Than the Contiguous River (South River, Virginia USA),” Ecotoxicology and Envi- ronmental Safety, 2013. http://dx.doi.org/10.1016/j.ecoenv.2012.04.023i [6] H. Hsu-Kim, K. H. Kucharzyk, T. Zhang and M. A. De- shusses, “Mechanisms Regulating Mercury Bioavailabil- ity for Methylating Microorganisms in the Aquatic Envi- ronment: A Critical Review,” Environmental Science & Technology, Vol. 47, No. 6, 2013, pp. 2441-2456. http://dx.doi.org/10.1021/es304370g [7] J. K. Schaefer, S. S. Rocks, W. Zheng, L. Y. Liang, B. H. Gu and F. M. M. Morel, “Active Transport, Substrate Specificity, and Methylation of Hg(II) in Anaerobic Bac- teria,” Proceedings of the National Academy of Sciences, Vol. 108, No. 21, 2011, pp. 8714-8719. http://dx.doi.org/10.1073/pnas.1105781108 [8] W. Zheng, L. Y. Liang and B. H. Gu, “Mercury Reduc- tion and Oxidation by Reduced Natural Organic Matter in Anoxic Environments,” Environmental Science & Tech- nology, Vol. 46, No. 1, 2012, pp. 292-299. http://dx.doi.org/10.1021/es203402p [9] M. E. Hines, J. Faganeli, I. Adatto and M. Horvat, “Mi- crobial Mercury Transformations in Marine, Estuarine and Freshwater Sediment Downstream of the Idrija Mer- cury Mine,” Applied Geochemistry, Vol. 21, No. 11, 2006, pp. 1924-1939. http://dx.doi.org/10.1016/j.apgeochem.2006.08.008 [10] N. S. Bloom, “Influence of Analytical Conditions on the Observed ‘Reactive Mercury’, Concentrations in Natural Fresh Waters,” In: J. Huckabee and C. J. Watras, Eds., Mercury as a Global Pollutant, Lewis Publishers, Ann Arbor, 1994. [11] J. D. Dean and R. P. Mason, “Estimation of Mercury Bio- accumulation Potential fromWastewater Treatment Plants in Receiving Waters: Phase II,” Final Report, 2009, 05- WEM-1COa, WERF, Co-published by IWA Publishing. [12] S. Rapsomanikis, O. F. X. Donard and J. H. Weber, “Speciation of Lead and Methyllead Ions in Water by Chromatography/Atomic Absorption Spectrometry after Ethylation with Sodium Tetraethylborate,” Analytical Chemistry, Vol. 58, No. 1, 1986, pp. 35-38. http://dx.doi.org/10.1021/ac00292a011 [13] N. S. Bloom, “Determination of Pictogram Levels of Me- thylmercury by Aqueous Phase Ethylation, Followed by Cryogenic Gas Chromatography with Cold Vapor Atomic Fluorescence Detection,” Canadian Journal of Fisheries and Aquatic Sciences, Vol. 46, No. 7, 1989, pp. 1131- 1140. http://dx.doi.org/10.1139/f89-147 [14] L. Liang, M. Horvat and N. S. Bloom, “An Improved Speciation Method for Mercury by GC/CVAFS after Aqueous Phase Ethylation and Room Temperature Pre- collection,” Talanta, Vol. 41, No. 3, 1994, pp. 371-379. http://dx.doi.org/10.1016/0039-9140(94)80141-X [15] S. Žižek, R. Milačič, R. Jaćimivić, M. J. toman and M. Horvat, “Periphyton as a Bioindicator of Mercury Pollu- tion in a Temperate Torrential River Ecosystem,” Che- mosphere, Vol. 85, No. 5, 2011, pp. 883-891. http://dx.doi.org/10.1016/j.chemosphere.2011.06.110 [16] W. R. Hatch and W. L. Ott, “Determination of Sub-Cold Vapour Atomic Absorption Spectrophotometry,” Ana- lytical Chemistry, Vol. 40, No. 14, 1968, pp. 2085-2087. http://dx.doi.org/10.1021/ac50158a025 [17] L. Liang, Bloom and M. Horvat, “Simultaneous Deter- mination of Mercury Speciation in Biological Materials by GC/CVAFS after Ethylation and Room Temperature Precollection,” Clinical Chemistry, Vol. 40, No. 4, 1994, pp. 602-607. [18] L. Liang, C. Evens, S. Lazoff, J. S. Woods, E. Cernichiari, M. Horvat, M. D. Martin and T. DeRouen, “Determina- tion of Methyl Mercury in Whole Blood by Ethylation- GC-CVAFS after Alkaline Digestion-Solvent Extrac- tion,” Journal of Analytical Toxicology, Vol. 24, No. 5, 2000, pp. 328-332. http://dx.doi.org/10.1093/jat/24.5.328 [19] US EPA Method 1669, “Sampling Ambient Water for Trace Metals at EPA Water Quality Criteria Levels,” Washington, DC, 1996. [20] US EPA 1631, “Mercury in Water by Oxidation, Purge and Trap, and Cold Vapor Atomic Fluorescence Spec- trometry,” Environmental Protection Agency, Washing- ton, DC, 2002. [21] US EPA 1630, “Methyl Mercury in Water by Distillation, Aqueous Ethylation,” US Environmental Protection Agency, Washington, DC, 2001. [22] L. Liang and N. S. Bloom, “Determination of Total Mer- cury by Single-Stage Gold Amalgamation with Cold Va- por Atomic Spectrometry,” JAAS, Vol. 8, 1993, pp. 591- 594. [23] M. Horvat, “Determination of Mercury and Its Com- pounds in Water, Sediment, Soil and Biological Sam- ples,” In: N. Pirrone and K. R. Mahaffey, Eds., Dynamics of Mercury Pollution on Regional and Global Scales: Atmospheric Processes and Human Exposures around the World, Springer, New York, 2005, pp. 154-190. http://dx.doi.org/10.1007/0-387-24494-8_8 [24] B. H. Gu, Y. R. Bian, C. L. Miller, W. M. Dong, X. Jiang and L. Y. Liang, “Mercury Reduction and Complexation by Natural Organic Matter in Anoxic Environments,” Proceedings of the National Academy of Sciences, Vol. 108, No. 4, 2011, pp. 1479-1483. http://dx.doi.org/10.1073/pnas.1008747108 [25] W. M. Dong, L. Y. Liang, S. Brooks, G. Southworth and B. H. Gu, “Roles of Dissolved Organic Matter in the Speciation of Mercury and Methylmercury in an Con- taminated Ecosystem in Oak Ridge,” Tennessee Envi- ronmental, Vol. 7, No. 1, 2010, pp. 94-102. [26] C. L. Miller, G. Southworth, S. Brooks, L. Y. Liang and B. H. Gu, “Kinetic Controls on the Complexation be- Open Access AJAC  L. LIANG ET AL. Open Access AJAC 632 tween Mercury and Dissolved Organic Matter in a Con- taminated Environment,” Environmental Science & Tech- nology, 2009, Vol. 43, No. 22, 2009, pp. 8548-8553. [27] M. Horvat, N. S. Bloom and L. Liang, “A Comparison of Distillation with Other Current Isolation Methods for De- termination of Methyl Mercury Compounds in Low Level Environmental Samples, Part 1: Sediment,” Analytica Chimica Acta, Vol. 281, No. 1, 1993, pp. 135-152. http://dx.doi.org/10.1016/0003-2670(93)85348-N [28] M. Horvat, L. Liang and N. S. Bloom, “A Comparison of Distillation with Other Current Isolation Methods for the Determination of Methyl Mercury Compounds in Low Level Environmental Samples, Part 2: Water,” Analytica Chimica Acta, Vol. 282, No. 1, 1993, pp. 153-168. http://dx.doi.org/10.1016/0003-2670(93)80364-Q [29] L. Liang, M. Berndt, T. K. Bavin and P. Pang, “Defini- tion and Application of Alkylatable Mercury (AHg) for Estimation of Bioavailable Mercury,” 9th ICMGP, Gui- yang, June 7-12, 2009, pp. S19-52. [30] L. Liang, D. Hwang, L. Young, E. A. Aultman and P. Pang, “The Use of Alkylatable Mercury for Risk Assess- ment and Remediation Evaluation of Hg Contaminated Water/Soil/Sediment,” 10th ICMGP, Halifax, Nova Sco- tia, July 24-29, 2011. [31] K. Matsunaga, S. Konishi and M. Nishimura, “Possible errors Caused Prior to Measurement of Mercury in Natu- ral Waters with Special Reference to Seawater,” Envi- ronmental Science & Technology, Vol. 13, No. 1, 1979, pp. 63-70. http://dx.doi.org/10.1021/es60149a013 [32] J. A. Dalziel and P. A. Yeats, “Reactive Mercury in the Central North Atlantic Ocean,” Marine Chemistry, Vol. 15, No. 4, 1985, pp. 357-365. http://dx.doi.org/10.1016/0304-4203(85)90046-5 [33] N. S. Bloom and E. A. Crecelius, “Determination of Mer- cury in Seawater at Subnanogram per Liter Levels,” Ma- rine Chemistry, Vol. 14, No. 1, 1983, pp. 59-64. http://dx.doi.org/10.1016/0304-4203(83)90069-5 [34] G. A. Gill and W. F. Fitzgerald, “Picomolar Mercury Measurements in Seawater and Other Materials Using Stannous Chloride Reduction and Two Stage Gold Amalgamation with Gas Phase Detection,” Marine Che- mistry, Vol. 20, No. 3, 1987, pp. 227-243. http://dx.doi.org/10.1016/0304-4203(87)90074-0 [35] T. Kanduc, D. Kocman and N. Ogrinc, “Hydrogeochemi- cal and Stable Isotope Characteristics of the River Idrijca (Slovenia), the Boundary Watershed between the Adriatic and Black Seas,” Marine Chemistry, Vol. 14, No. 3, 2008, pp. 239-262. http://dx.doi.org/10.1007/s10498-008-9035-2 [36] M. E. Hines, M. Horvat, J. Faganeli, J. C. J. Bonzongo, T. Barkay, E. B. Major, K. J. Scott, E. A. Bailey, J. J. War- wick and W. B. Lyons, “Mercury Biogeochemistry in the Idrija River, Slovenia, from above the Mine into the Gulf of Trieste,” Environmental Research, Vol. 83, No. 2, 2000, pp. 129-139. http://dx.doi.org/10.1006/enrs.2000.4052 [37] M. Horvat, S. Covelli, J. Faganeli, M. Logar, V. Mandic, R. Rajar, A. Sirca and D. Zagar, “Mercury in Conta- minated Coastal Environments, a Case Study: The Gulf of Trieste,” Science of The Total Environment, Vol. 237-238, 1999, pp. 43-56. http://dx.doi.org/10.1016/S0048-9697(99)00123-0 [38] M. Horvat, V. Jereb, V. Fajon, M. Logar, J. Kotnik, J. Fa- ganeli, M. E. Hines and J.-C. Bonzongo, “Mercury Dis- tribution in Water, Sediment and Soil in the Idrijca and Soča River Systems,” Geochemistry: Exploration, Envi- ronment, Analysis, Vol. 2, No. 3, 2002, pp. 287-296. http://dx.doi.org/10.1144/1467-787302-033 [39] D. Kocman, T. Kanduc, N. Ogrinc and M. Horvat, “Dis- tribution and Partitioning of Mercury in a River Catch- ment Impacted by Former Mercury Mining Activity,” Biogeochemistry, Vol. 104, No. 1-3, 2011, pp. 183-201. http://dx.doi.org/10.1007/s10533-010-9495-5
|