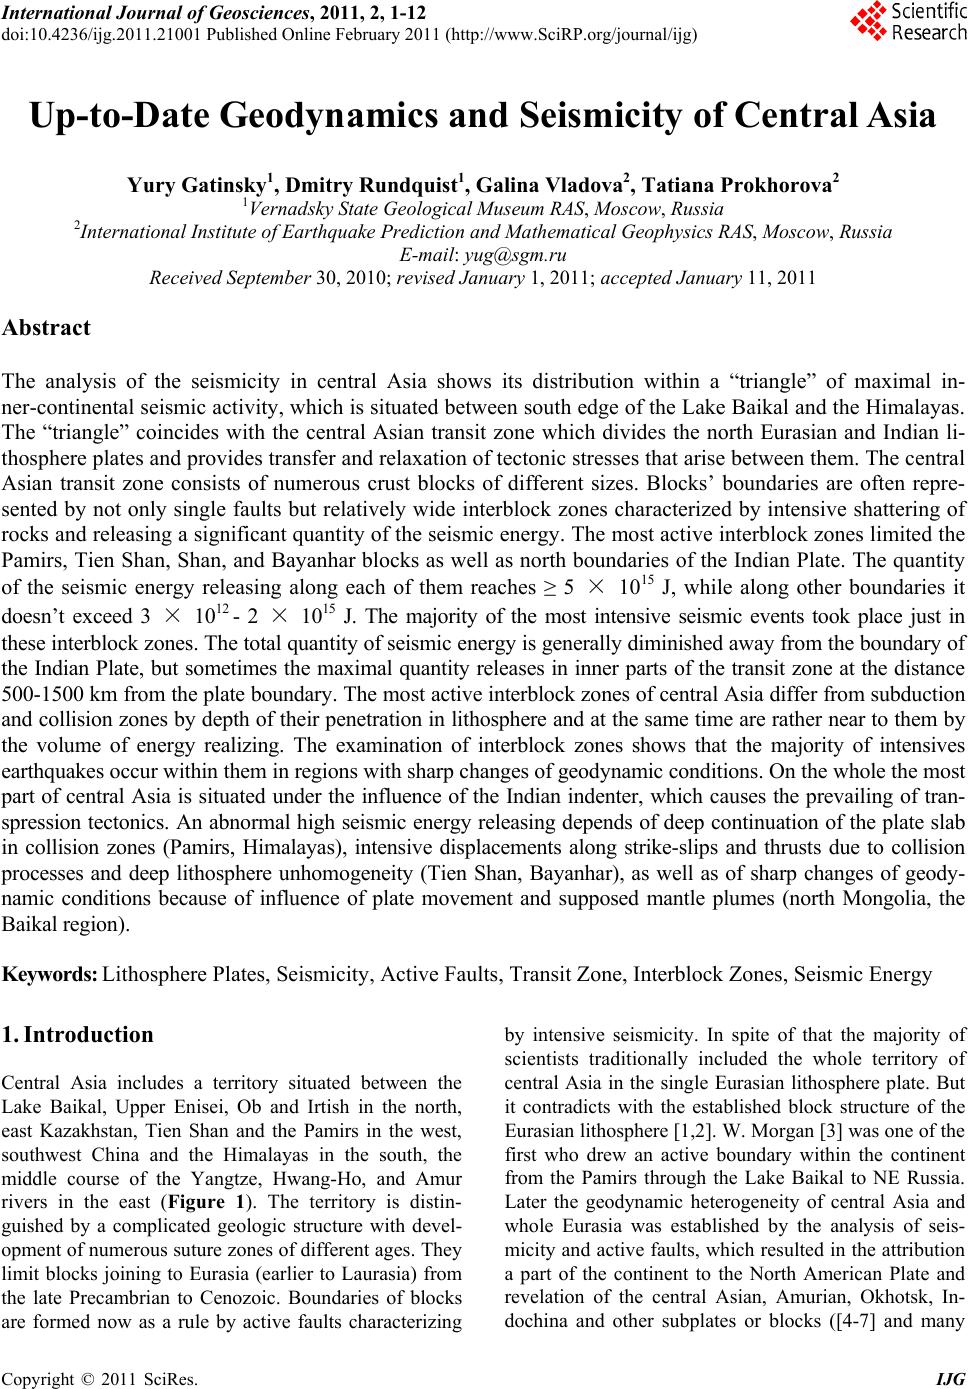
 International Journal of Geosciences, 2011, 2, 1-12 doi:10.4236/ijg.2011.21001 Published Online February 2011 (http://www.SciRP.org/journal/ijg) Copyright © 2011 SciRes. IJG Up-to-Date Geodynamics and Seismicity of Central Asia Yury Gatinsky1, Dmitry Rundquist1, Galina Vladova2, Tatiana Prokhorova2 1Vernadsky State Geological Museum RAS, Moscow, Russia 2International Institute of Earthquake Prediction and Mathematical Geophysics RAS, Mosc ow, Russia E-mail: yug@sgm.ru Received September 30, 2010; revised January 1, 2011; accepted January 11, 2011 Abstract The analysis of the seismicity in central Asia shows its distribution within a “triangle” of maximal in- ner-continental seismic activity, which is situated between south edge of the Lake Baikal and the Himalayas. The “triangle” coincides with the central Asian transit zone which divides the north Eurasian and Indian li- thosphere plates and provides transfer and relaxation of tectonic stresses that arise between them. The central Asian transit zone consists of numerous crust blocks of different sizes. Blocks’ boundaries are often repre- sented by not only single faults but relatively wide interblock zones characterized by intensive shattering of rocks and releasing a significant quantity of the seismic energy. The most active interblock zones limited the Pamirs, Tien Shan, Shan, and Bayanhar blocks as well as north boundaries of the Indian Plate. The quantity of the seismic energy releasing along each of them reaches ≥ 5 × 10¹⁵ J, while along other boundaries it doesn’t exceed 3 × 10¹² - 2 × 10¹⁵ J. The majority of the most intensive seismic events took place just in these interblock zones. The total quantity of seismic energy is generally diminished away from the boundary of the Indian Plate, but sometimes the maximal quantity releases in inner parts of the transit zone at the distance 500-1500 km from the plate boundary. The most active interblock zones of central Asia differ from subduction and collision zones by depth of their penetration in lithosphere and at the same time are rather near to them by the volume of energy realizing. The examination of interblock zones shows that the majority of intensives earthquakes occur within them in regions with sharp changes of geodynamic conditions. On the whole the most part of central Asia is situated under the influence of the Indian indenter, which causes the prevailing of tran- spression tectonics. An abnormal high seismic energy releasing depends of deep continuation of the plate slab in collision zones (Pamirs, Himalayas), intensive displacements along strike-slips and thrusts due to collision processes and deep lithosphere unhomogeneity (Tien Shan, Bayanhar), as well as of sharp changes of geody- namic conditions because of influence of plate movement and supposed mantle plumes (north Mongolia, the Baikal region). Keywords: Lithosphere Plates, Seismicity, Active Faults, Transit Zone, Interblock Zones, Seismic Energy 1. Introduction Central Asia includes a territory situated between the Lake Baikal, Upper Enisei, Ob and Irtish in the north, east Kazakhstan, Tien Shan and the Pamirs in the west, southwest China and the Himalayas in the south, the middle course of the Yangtze, Hwang-Ho, and Amur rivers in the east (Figure 1). The territory is distin- guished by a complicated geologic structure with devel- opment of numerous suture zones of different ages. They limit blocks joining to Eurasia (earlier to Laurasia) from the late Precambrian to Cenozoic. Boundaries of blocks are formed now as a rule by active faults characterizing by intensive seismicity. In spite of that the majority of scientists traditionally included the whole territory of central Asia in the single Eurasian lithosphere plate. But it contradicts with the established block structure of the Eurasian lithosphere [1,2]. W. Morgan [3] was one of the first who drew an active boundary within the continent from the Pamirs through the Lake Baikal to NE Russia. Later the geodynamic heterogeneity of central Asia and whole Eurasia was established by the analysis of seis- micity and active faults, which resulted in the attribution a part of the continent to the North American Plate and revelation of the central Asian, Amurian, Okhotsk, In- dochina and other subplates or blocks ([4-7] and many 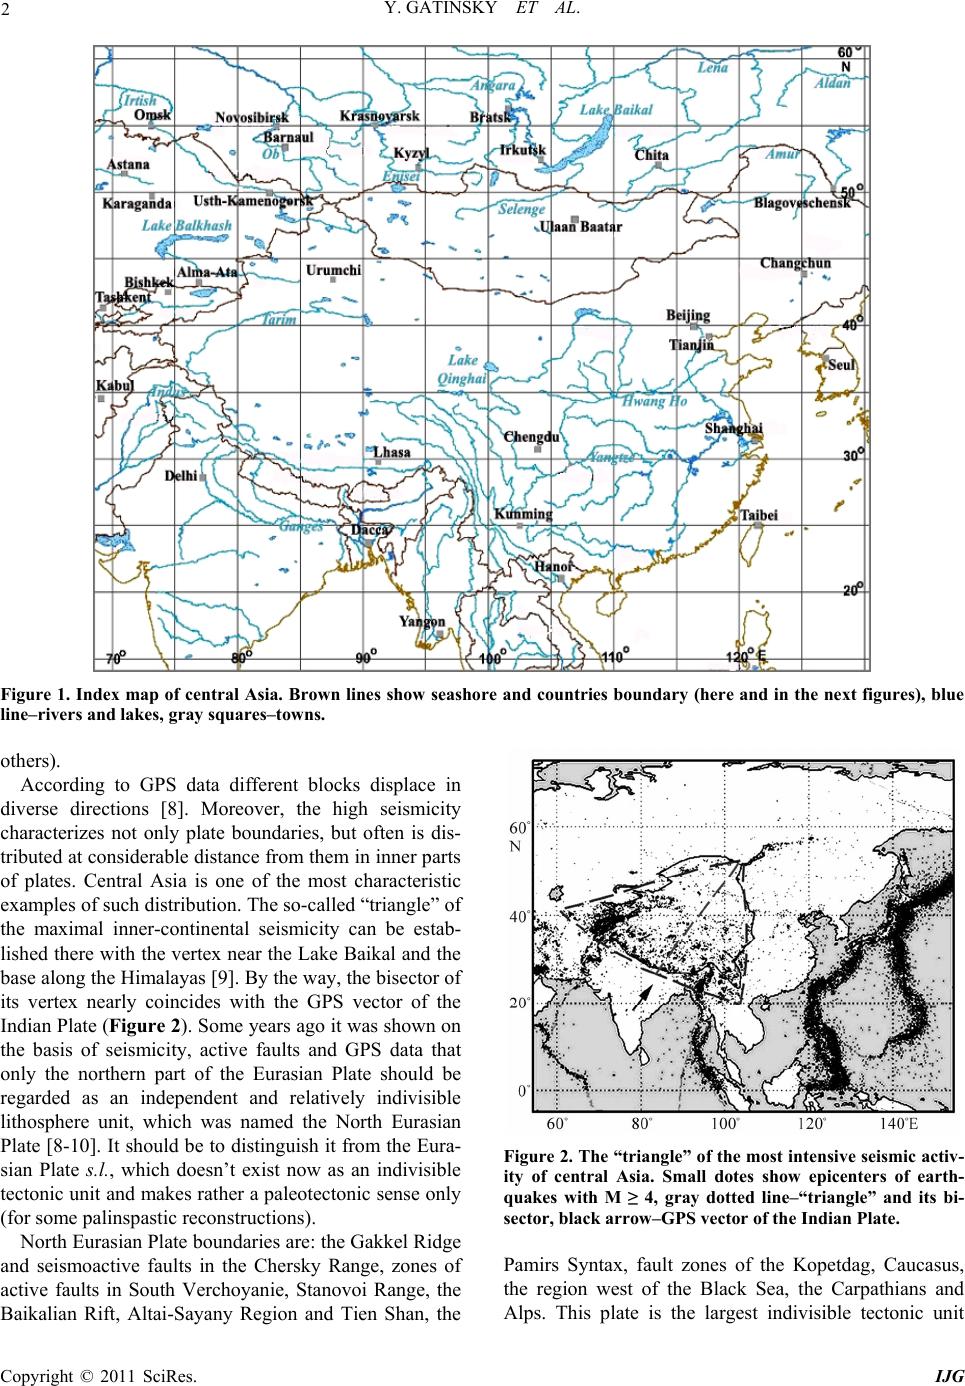 Y. GATINSKY ET AL. Copyright © 2011 SciRes. IJG 2 Figure 1. Index map of central Asia. Brown lines show seashore and countries boundary (here and in the next figures), blue line–rivers and lakes, gray squares–towns. others). According to GPS data different blocks displace in diverse directions [8]. Moreover, the high seismicity characterizes not only plate boundaries, but often is dis- tributed at considerable distance from them in inner parts of plates. Central Asia is one of the most characteristic examples of such distribution. The so-called “triangle” of the maximal inner-continental seismicity can be estab- lished there with the vertex near the Lake Baikal and the base along the Himalayas [9]. By the way, the bisector of its vertex nearly coincides with the GPS vector of the Indian Plate (Figure 2). Some years ago it was shown on the basis of seismicity, active faults and GPS data that only the northern part of the Eurasian Plate should be regarded as an independent and relatively indivisible lithosphere unit, which was named the North Eurasian Plate [8-10]. It should be to distinguish it from the Eura- sian Plate s.l., which doesn’t exist now as an indivisible tectonic unit and makes rather a paleotectonic sense only (for some palinspastic reconstructions). North Eurasian Plate boundaries are: the Gakkel Ridge and seismoactive faults in the Chersky Range, zones of active faults in South Verchoyanie, Stanovoi Range, the Baikalian Rift, Altai-Sayany Region and Tien Shan, the Figure 2. The “triangle” of the most intensive seismic activ- ity of central Asia. Small dotes show epicenters of earth- quakes with M ≥ 4, gray dotted line–“triangle” and its bi- sector, black arrow–GPS vector of the Indian Plate. Pamirs Syntax, fault zones of the Kopetdag, Caucasus, the region west of the Black Sea, the Carpathians and Alps. This plate is the largest indivisible tectonic unit 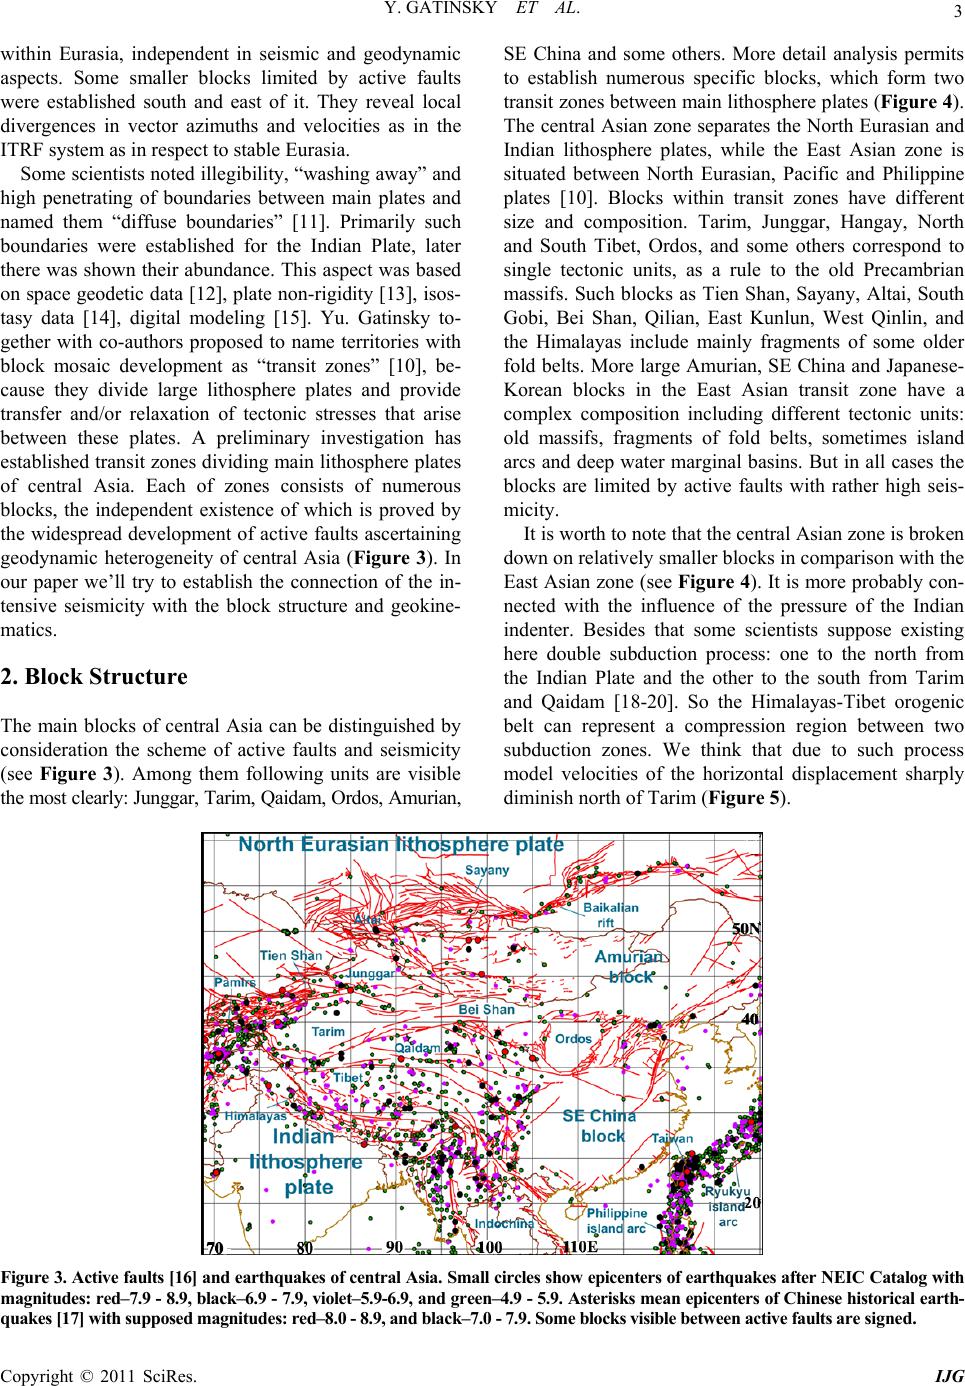 Y. GATINSKY ET AL. Copyright © 2011 SciRes. IJG 3 within Eurasia, independent in seismic and geodynamic aspects. Some smaller blocks limited by active faults were established south and east of it. They reveal local divergences in vector azimuths and velocities as in the ITRF system as in respect to stable Eurasia. Some scientists noted illegibility, “washing away” and high penetrating of boundaries between main plates and named them “diffuse boundaries” [11]. Primarily such boundaries were established for the Indian Plate, later there was shown their abundance. This aspect was based on space geodetic data [12], plate non-rigidity [13], isos- tasy data [14], digital modeling [15]. Yu. Gatinsky to- gether with co-authors proposed to name territories with block mosaic development as “transit zones” [10], be- cause they divide large lithosphere plates and provide transfer and/or relaxation of tectonic stresses that arise between these plates. A preliminary investigation has established transit zones dividing main lithosphere plates of central Asia. Each of zones consists of numerous blocks, the independent existence of which is proved by the widespread development of active faults ascertaining geodynamic heterogeneity of central Asia (Figure 3). In our paper we’ll try to establish the connection of the in- tensive seismicity with the block structure and geokine- matics. 2. Block Structure The main blocks of central Asia can be distinguished by consideration the scheme of active faults and seismicity (see Figure 3). Among them following units are visible the most clearly: Junggar, Tarim, Qaidam, Ordos, Amurian, SE China and some others. More detail analysis permits to establish numerous specific blocks, which form two transit zones between main lithosphere plates (Figure 4). The central Asian zone separates the North Eurasian and Indian lithosphere plates, while the East Asian zone is situated between North Eurasian, Pacific and Philippine plates [10]. Blocks within transit zones have different size and composition. Tarim, Junggar, Hangay, North and South Tibet, Ordos, and some others correspond to single tectonic units, as a rule to the old Precambrian massifs. Such blocks as Tien Shan, Sayany, Altai, South Gobi, Bei Shan, Qilian, East Kunlun, West Qinlin, and the Himalayas include mainly fragments of some older fold belts. More large Amurian, SE China and Japanese- Korean blocks in the East Asian transit zone have a complex composition including different tectonic units: old massifs, fragments of fold belts, sometimes island arcs and deep water marginal basins. But in all cases the blocks are limited by active faults with rather high seis- micity. It is worth to note that the central Asian zone is broken down on relatively smaller blocks in comparison with the East Asian zone (see Figure 4). It is more probably con- nected with the influence of the pressure of the Indian indenter. Besides that some scientists suppose existing here double subduction process: one to the north from the Indian Plate and the other to the south from Tarim and Qaidam [18-20]. So the Himalayas-Tibet orogenic belt can represent a compression region between two subduction zones. We think that due to such process model velocities of the horizontal displacement sharply diminish north of Tarim (Figure 5). Figure 3. Active faults [16] and earthquakes of central Asia. Small circles show epicenters of earthquakes after NEIC Catalog with magnitudes: red–7.9 - 8.9, black–6.9 - 7.9, violet–5.9-6.9, and green–4.9 - 5.9. Asterisks mean epicenters of Chinese historical earth- quakes [17] with supposed magnitudes: red–8.0 - 8.9, and black–7.0 - 7.9. Some blocks visible between active faults are signed. 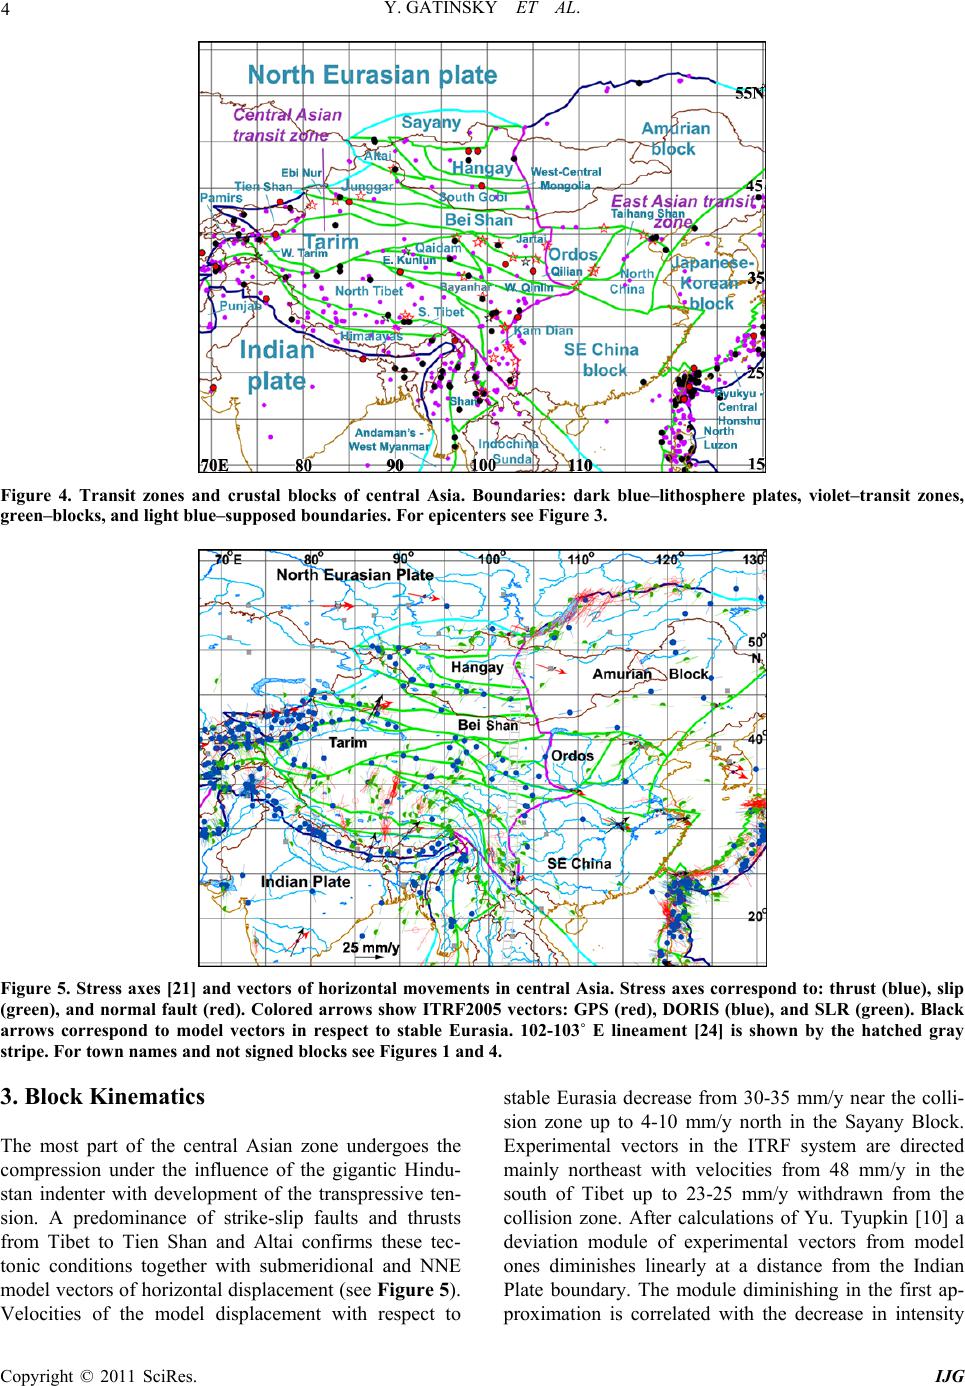 Y. GATINSKY ET AL. Copyright © 2011 SciRes. IJG 4 Figure 4. Transit zones and crustal blocks of central Asia. Boundaries: dark blue–lithosphere plates, violet–transit zones, green–blocks, and light blue–supposed boundaries. For epicenters see Figure 3. Figure 5. Stress axes [21] and vectors of horizontal movements in central Asia. Stress axes correspond to: thrust (blue), slip (green), and normal fault (red). Colored arrows show ITRF2005 vectors: GPS (red), DORIS (blue), and SLR (green). Black arrows correspond to model vectors in respect to stable Eurasia. 102-103˚ E lineament [24] is shown by the hatched gray stripe. For town names and not signed blocks see Figures 1 and 4. 3. Block Kinematics The most part of the central Asian zone undergoes the compression under the influence of the gigantic Hindu- stan indenter with development of the transpressive ten- sion. A predominance of strike-slip faults and thrusts from Tibet to Tien Shan and Altai confirms these tec- tonic conditions together with submeridional and NNE model vectors of horizontal displacement (see Figure 5). Velocities of the model displacement with respect to stable Eurasia decrease from 30-35 mm/y near the colli- sion zone up to 4-10 mm/y north in the Sayany Block. Experimental vectors in the ITRF system are directed mainly northeast with velocities from 48 mm/y in the south of Tibet up to 23-25 mm/y withdrawn from the collision zone. After calculations of Yu. Tyupkin [10] a deviation module of experimental vectors from model ones diminishes linearly at a distance from the Indian Plate boundary. The module diminishing in the first ap- proximation is correlated with the decrease in intensity 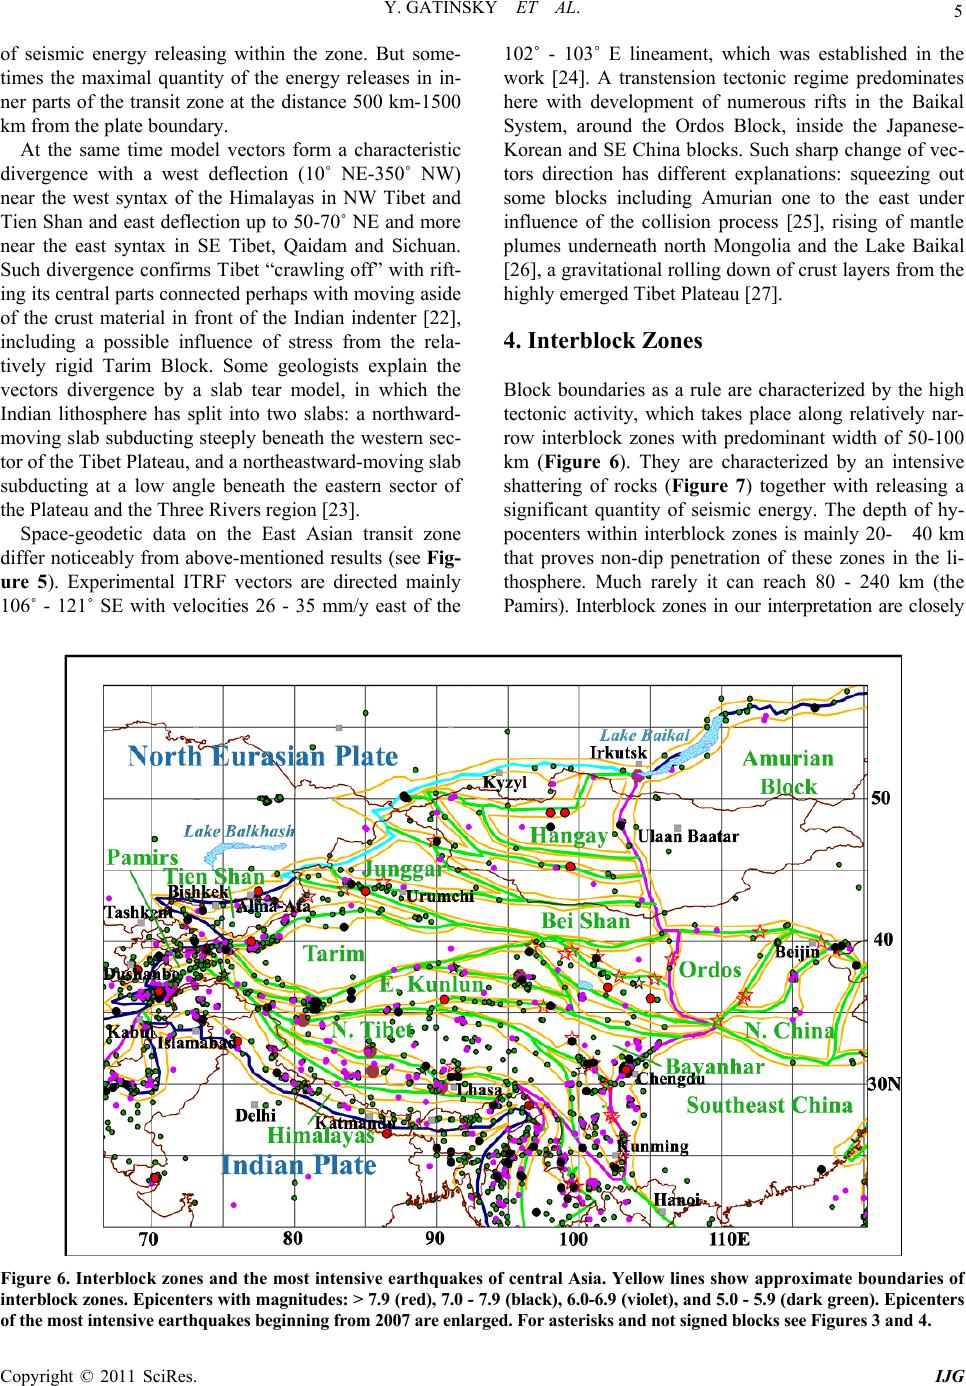 Y. GATINSKY ET AL. Copyright © 2011 SciRes. IJG 5 of seismic energy releasing within the zone. But some- times the maximal quantity of the energy releases in in- ner parts of the transit zone at the distance 500 km-1500 km from the plate boundary. At the same time model vectors form a characteristic divergence with a west deflection (10˚ NE-350˚ NW) near the west syntax of the Himalayas in NW Tibet and Tien Shan and east deflection up to 50-70˚ NE and more near the east syntax in SE Tibet, Qaidam and Sichuan. Such divergence confirms Tibet “crawling off” with rift- ing its central parts connected perhaps with moving aside of the crust material in front of the Indian indenter [22], including a possible influence of stress from the rela- tively rigid Tarim Block. Some geologists explain the vectors divergence by a slab tear model, in which the Indian lithosphere has split into two slabs: a northward- moving slab subducting steeply beneath the western sec- tor of the Tibet Plateau, and a northeastward-moving slab subducting at a low angle beneath the eastern sector of the Plateau and the Three Rivers region [23]. Space-geodetic data on the East Asian transit zone differ noticeably from above-mentioned results (see Fig- ure 5). Experimental ITRF vectors are directed mainly 106˚ - 121˚ SE with velocities 26 - 35 mm/y east of the 102˚ - 103˚ E lineament, which was established in the work [24]. A transtension tectonic regime predominates here with development of numerous rifts in the Baikal System, around the Ordos Block, inside the Japanese- Korean and SE China blocks. Such sharp change of vec- tors direction has different explanations: squeezing out some blocks including Amurian one to the east under influence of the collision process [25], rising of mantle plumes underneath north Mongolia and the Lake Baikal [26], a gravitational rolling down of crust layers from the highly emerged Tibet Plateau [27]. 4. Interblock Zones Block boundaries as a rule are characterized by the high tectonic activity, which takes place along relatively nar- row interblock zones with predominant width of 50-100 km (Figure 6). They are characterized by an intensive shattering of rocks (Figure 7) together with releasing a significant quantity of seismic energy. The depth of hy- pocenters within interblock zones is mainly 20- 40 km that proves non-dip penetration of these zones in the li- thosphere. Much rarely it can reach 80 - 240 km (the Pamirs). Interblock zones in our interpretation are closely Figure 6. Interblock zones and the most intensive earthquakes of central Asia. Yellow lines show approximate boundaries of interblock zones. Epicenters with magnitudes: > 7.9 (red), 7.0 - 7.9 (black), 6.0-6.9 (violet), and 5.0 - 5.9 (dark green). Epicenters of the most intensive earthquakes beginning from 2007 are enlarged. For asterisks and not signed blocks see Figures 3 and 4. 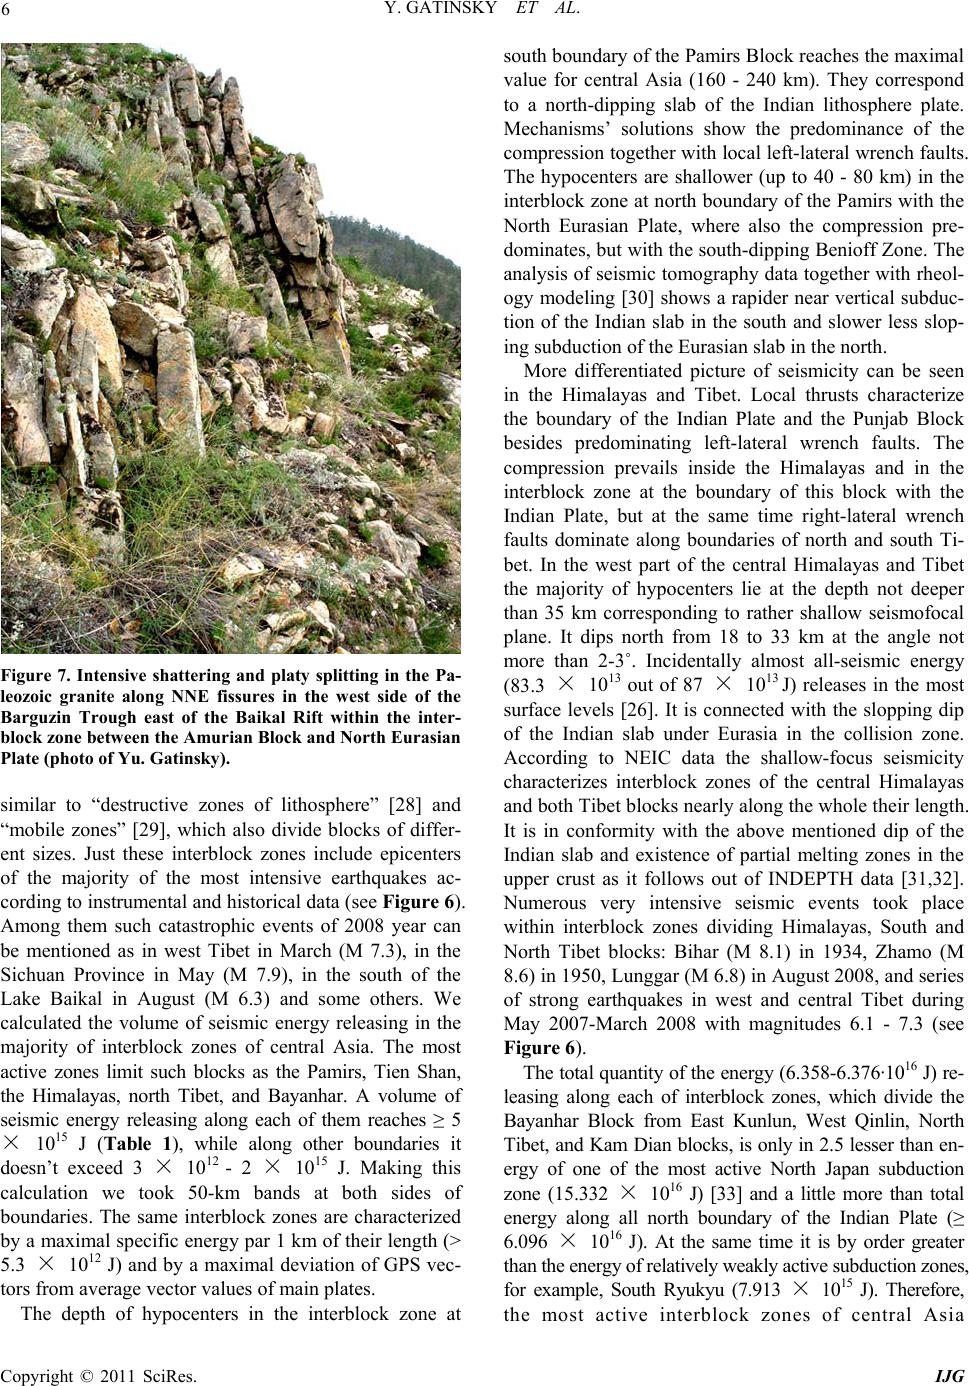 Y. GATINSKY ET AL. Copyright © 2011 SciRes. IJG 6 Figure 7. Intensive shattering and platy splitting in the Pa- leozoic granite along NNE fissures in the west side of the Barguzin Trough east of the Baikal Rift within the inter- block zone between the Amurian Block and North Eurasian Plate (photo of Yu. Gatinsky). similar to “destructive zones of lithosphere” [28] and “mobile zones” [29], which also divide blocks of differ- ent sizes. Just these interblock zones include epicenters of the majority of the most intensive earthquakes ac- cording to instrumental and historical data (see Figure 6). Among them such catastrophic events of 2008 year can be mentioned as in west Tibet in March (M 7.3), in the Sichuan Province in May (M 7.9), in the south of the Lake Baikal in August (M 6.3) and some others. We calculated the volume of seismic energy releasing in the majority of interblock zones of central Asia. The most active zones limit such blocks as the Pamirs, Tien Shan, the Himalayas, north Tibet, and Bayanhar. A volume of seismic energy releasing along each of them reaches ≥ 5 × 10¹⁵ J (Table 1), while along other boundaries it doesn’t exceed 3 × 10¹² - 2 × 10¹⁵ J. Making this calculation we took 50-km bands at both sides of boundaries. The same interblock zones are characterized by a maximal specific energy par 1 km of their length (> 5.3 × 10¹² J) and by a maximal deviation of GPS vec- tors from average vector values of main plates. The depth of hypocenters in the interblock zone at south boundary of the Pamirs Block reaches the maximal value for central Asia (160 - 240 km). They correspond to a north-dipping slab of the Indian lithosphere plate. Mechanisms’ solutions show the predominance of the compression together with local left-lateral wrench faults. The hypocenters are shallower (up to 40 - 80 km) in the interblock zone at north boundary of the Pamirs with the North Eurasian Plate, where also the compression pre- dominates, but with the south-dipping Benioff Zone. The analysis of seismic tomography data together with rheol- ogy modeling [30] shows a rapider near vertical subduc- tion of the Indian slab in the south and slower less slop- ing subduction of the Eurasian slab in the north. More differentiated picture of seismicity can be seen in the Himalayas and Tibet. Local thrusts characterize the boundary of the Indian Plate and the Punjab Block besides predominating left-lateral wrench faults. The compression prevails inside the Himalayas and in the interblock zone at the boundary of this block with the Indian Plate, but at the same time right-lateral wrench faults dominate along boundaries of north and south Ti- bet. In the west part of the central Himalayas and Tibet the majority of hypocenters lie at the depth not deeper than 35 km corresponding to rather shallow seismofocal plane. It dips north from 18 to 33 km at the angle not more than 2-3˚. Incidentally almost all-seismic energy (83.3 × 10¹³ out of 87 × 10 13 J) releases in the most surface levels [26]. It is connected with the slopping dip of the Indian slab under Eurasia in the collision zone. According to NEIC data the shallow-focus seismicity characterizes interblock zones of the central Himalayas and both Tibet blocks nearly along the whole their length. It is in conformity with the above mentioned dip of the Indian slab and existence of partial melting zones in the upper crust as it follows out of INDEPTH data [31,32]. Numerous very intensive seismic events took place within interblock zones dividing Himalayas, South and North Tibet blocks: Bihar (M 8.1) in 1934, Zhamo (M 8.6) in 1950, Lunggar (M 6.8) in August 2008, and series of strong earthquakes in west and central Tibet during May 2007-March 2008 with magnitudes 6.1 - 7.3 (see Figure 6). The total quantity of the energy (6.358-6.376·1016 J) re- leasing along each of interblock zones, which divide the Bayanhar Block from East Kunlun, West Qinlin, North Tibet, and Kam Dian blocks, is only in 2.5 lesser than en- ergy of one of the most active North Japan subduction zone (15.332 × 10¹⁶ J) [33] and a little more than total energy along all north boundary of the Indian Plate (≥ 6.096 × 10¹⁶ J). At the same time it is by order greater than the energy of relatively weakly active subduction zones, for example, South Ryukyu (7.913 × 10¹⁵ J). Therefore, the most active interblock zones of central Asia 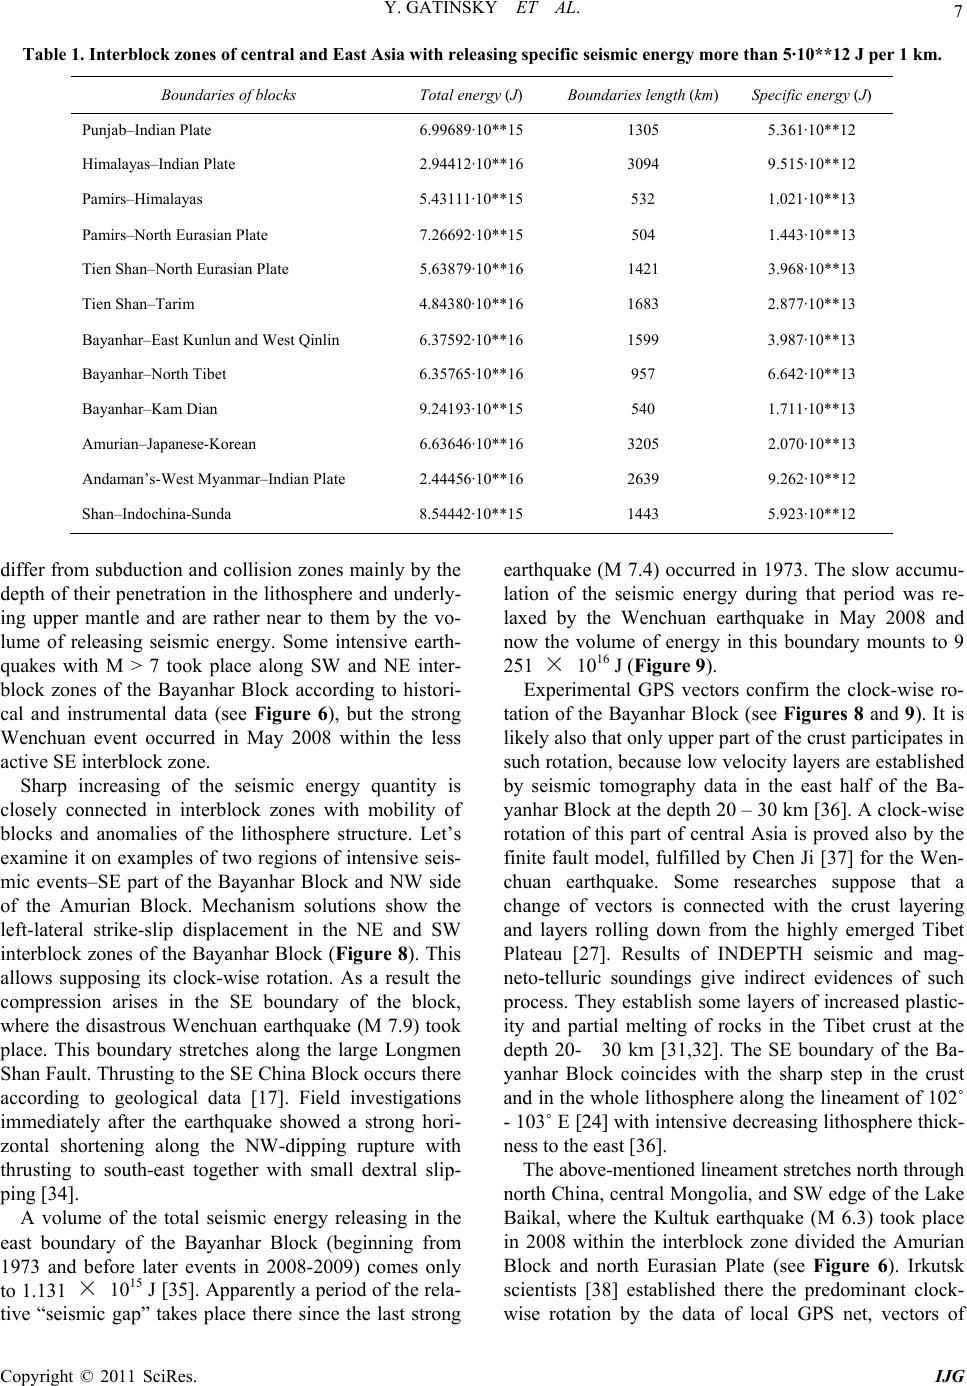 Y. GATINSKY ET AL. Copyright © 2011 SciRes. IJG 7 Table 1. Interblock zones of central and East Asia with releasing specific seismic energy more than 5·10**12 J per 1 km. Boundaries of blocks Total energy (J) Boundaries length (km)Specific energy (J) Punjab–Indian Plate 6.99689·10**15 1305 5.361·10**12 Himalayas–Indian Plate 2.94412·10**16 3094 9.515·10**12 Pamirs–Himalayas 5.43111·10**15 532 1.021·10**13 Pamirs–North Eurasian Plate 7.26692·10**15 504 1.443·10**13 Tien Shan–North Eurasian Plate 5.63879·10**16 1421 3.968·10**13 Tien Shan–Tarim 4.84380·10**16 1683 2.877·10**13 Bayanhar–East Kunlun and West Qinlin 6.37592·10**16 1599 3.987·10**13 Bayanhar–North Tibet 6.35765·10**16 957 6.642·10**13 Bayanhar–Kam Dian 9.24193·10**15 540 1.711·10**13 Amurian–Japanese-Korean 6.63646·10**16 3205 2.070·10**13 Andaman’s-West Myanmar–Indian Plate 2.44456·10**16 2639 9.262·10**12 Shan–Indochina-Sunda 8.54442·10**15 1443 5.923·10**12 differ from subduction and collision zones mainly by the depth of their penetration in the lithosphere and underly- ing upper mantle and are rather near to them by the vo- lume of releasing seismic energy. Some intensive earth- quakes with M > 7 took place along SW and NE inter- block zones of the Bayanhar Block according to histori- cal and instrumental data (see Figure 6), but the strong Wenchuan event occurred in May 2008 within the less active SE interblock zone. Sharp increasing of the seismic energy quantity is closely connected in interblock zones with mobility of blocks and anomalies of the lithosphere structure. Let’s examine it on examples of two regions of intensive seis- mic events–SE part of the Bayanhar Block and NW side of the Amurian Block. Mechanism solutions show the left-lateral strike-slip displacement in the NE and SW interblock zones of the Bayanhar Block (Figure 8). This allows supposing its clock-wise rotation. As a result the compression arises in the SE boundary of the block, where the disastrous Wenchuan earthquake (M 7.9) took place. This boundary stretches along the large Longmen Shan Fault. Thrusting to the SE China Block occurs there according to geological data [17]. Field investigations immediately after the earthquake showed a strong hori- zontal shortening along the NW-dipping rupture with thrusting to south-east together with small dextral slip- ping [34]. A volume of the total seismic energy releasing in the east boundary of the Bayanhar Block (beginning from 1973 and before later events in 2008-2009) comes only to 1.131 × 10¹⁵ J [35]. Apparently a period of the rela- tive “seismic gap” takes place there since the last strong earthquake (M 7.4) occurred in 1973. The slow accumu- lation of the seismic energy during that period was re- laxed by the Wenchuan earthquake in May 2008 and now the volume of energy in this boundary mounts to 9 251 × 1016 J (Figure 9). Experimental GPS vectors confirm the clock-wise ro- tation of the Bayanhar Block (see Figures 8 and 9). It is likely also that only upper part of the crust participates in such rotation, because low velocity layers are established by seismic tomography data in the east half of the Ba- yanhar Block at the depth 20 – 30 km [36]. A clock-wise rotation of this part of central Asia is proved also by the finite fault model, fulfilled by Chen Ji [37] for the Wen- chuan earthquake. Some researches suppose that a change of vectors is connected with the crust layering and layers rolling down from the highly emerged Tibet Plateau [27]. Results of INDEPTH seismic and mag- neto-telluric soundings give indirect evidences of such process. They establish some layers of increased plastic- ity and partial melting of rocks in the Tibet crust at the depth 20- 30 km [31,32]. The SE boundary of the Ba- yanhar Block coincides with the sharp step in the crust and in the whole lithosphere along the lineament of 102˚ - 103˚ E [24] with intensive decreasing lithosphere thick- ness to the east [36]. The above-mentioned lineament stretches north through north China, central Mongolia, and SW edge of the Lake Baikal, where the Kultuk earthquake (M 6.3) took place in 2008 within the interblock zone divided the Amurian Block and north Eurasian Plate (see Figure 6). Irkutsk scientists [38] established there the predominant clock- wise rotation by the data of local GPS net, vectors of 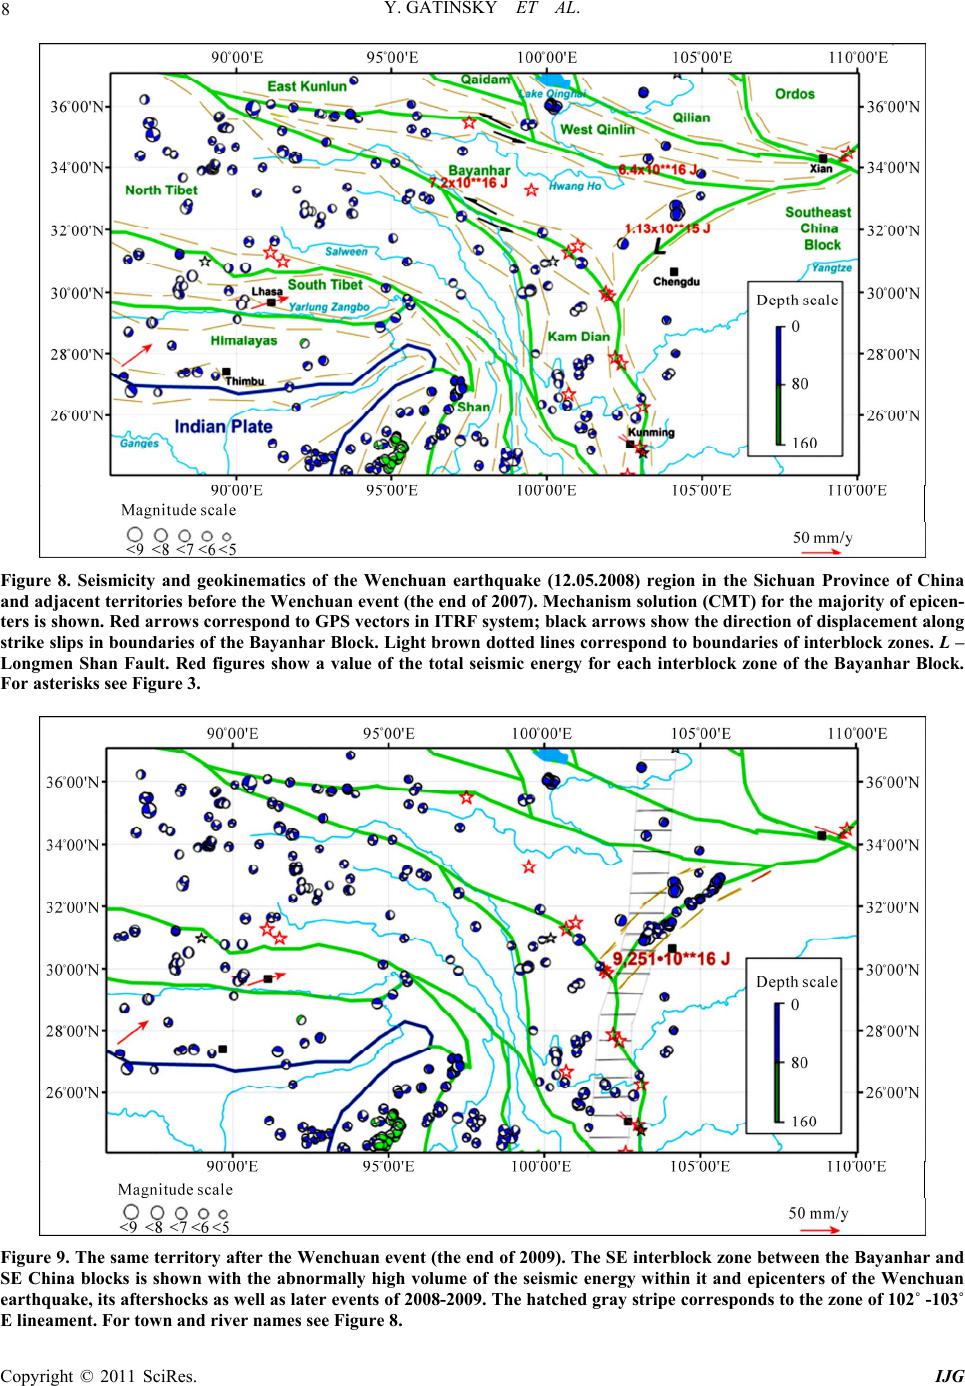 Y. GATINSKY ET AL. Copyright © 2011 SciRes. IJG 8 Figure 8. Seismicity and geokinematics of the Wenchuan earthquake (12.05.2008) region in the Sichuan Province of China and adjacent territories before the Wenchuan event (the end of 2007). Mechanism solution (CMT) for the majority of epicen- ters is shown. Red arrows correspond to GPS vectors in ITRF system; black arrows show the direction of displacement along strike slips in boundaries of the Bayanhar Block. Light brown dotted lines correspond to boundaries of interblock zones. L – Longmen Shan Fault. Red figures show a value of the total seismic energy for each interblock zone of the Bayanhar Block. For asterisks see Figure 3. Figure 9. The same territory after the Wenchuan event (the end of 2009). The SE interblock zone between the Bayanhar and SE China blocks is shown with the abnormally high volume of the seismic energy within it and epicenters of the Wenchuan earthquake, its aftershocks as well as later events of 2008-2009. The hatched gray stripe corresponds to the zone of 102˚ -103˚ E lineament. For town and river names see Figure 8. 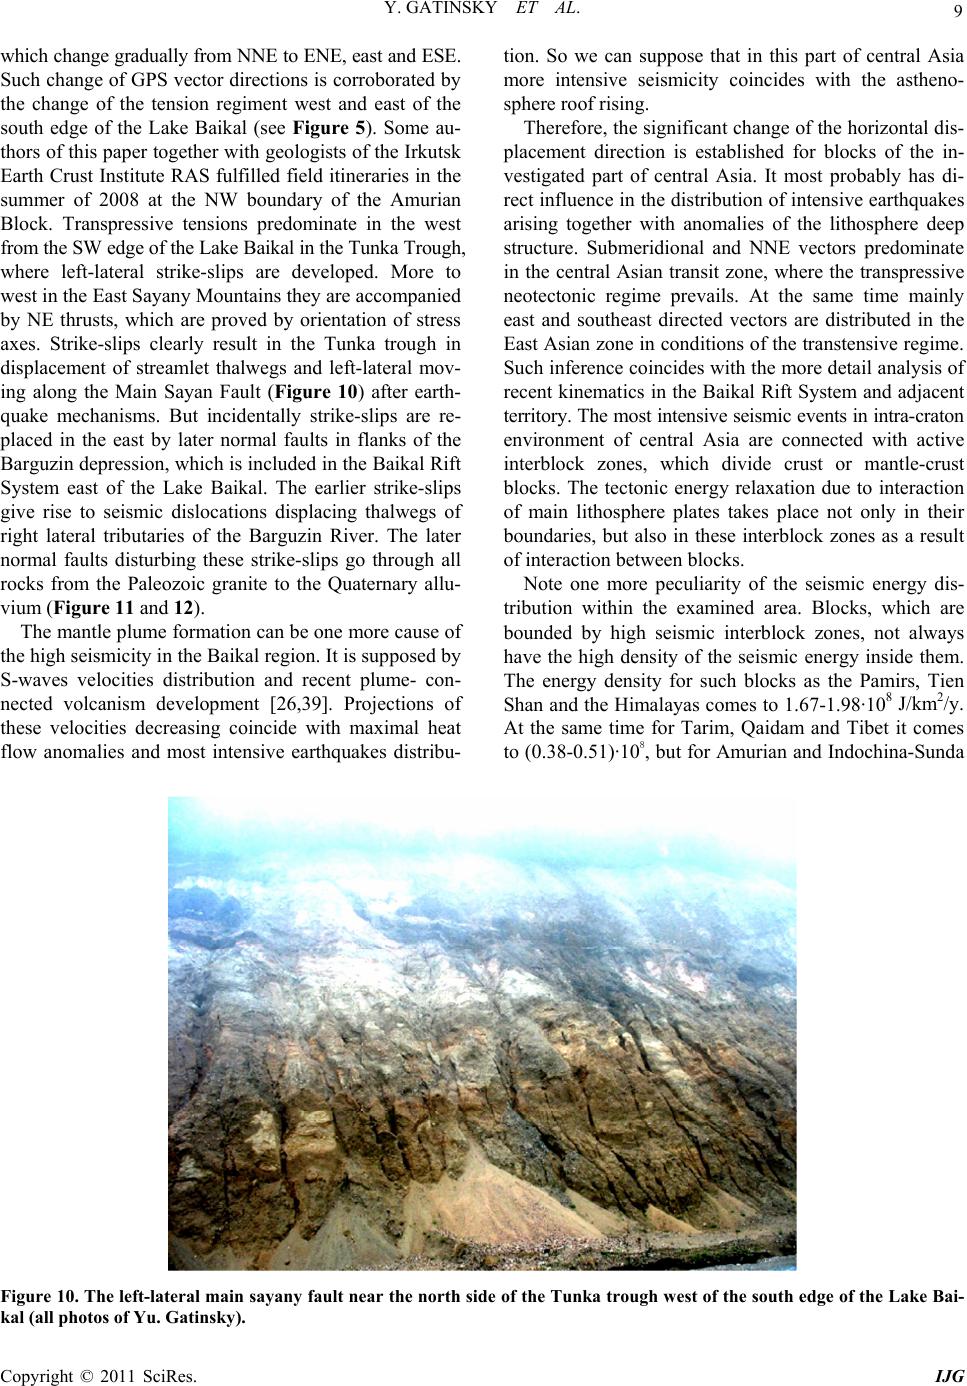 Y. GATINSKY ET AL. Copyright © 2011 SciRes. IJG 9 which change gradually from NNE to ENE, east and ESE. Such change of GPS vector directions is corroborated by the change of the tension regiment west and east of the south edge of the Lake Baikal (see Figure 5). Some au- thors of this paper together with geologists of the Irkutsk Earth Crust Institute RAS fulfilled field itineraries in the summer of 2008 at the NW boundary of the Amurian Block. Transpressive tensions predominate in the west from the SW edge of the Lake Baikal in the Tunka Trough, where left-lateral strike-slips are developed. More to west in the East Sayany Mountains they are accompanied by NE thrusts, which are proved by orientation of stress axes. Strike-slips clearly result in the Tunka trough in displacement of streamlet thalwegs and left-lateral mov- ing along the Main Sayan Fault (Figure 10) after earth- quake mechanisms. But incidentally strike-slips are re- placed in the east by later normal faults in flanks of the Barguzin depression, which is included in the Baikal Rift System east of the Lake Baikal. The earlier strike-slips give rise to seismic dislocations displacing thalwegs of right lateral tributaries of the Barguzin River. The later normal faults disturbing these strike-slips go through all rocks from the Paleozoic granite to the Quaternary allu- vium (Figure 11 and 12). The mantle plume formation can be one more cause of the high seismicity in the Baikal region. It is supposed by S-waves velocities distribution and recent plume- con- nected volcanism development [26,39]. Projections of these velocities decreasing coincide with maximal heat flow anomalies and most intensive earthquakes distribu- tion. So we can suppose that in this part of central Asia more intensive seismicity coincides with the astheno- sphere roof rising. Therefore, the significant change of the horizontal dis- placement direction is established for blocks of the in- vestigated part of central Asia. It most probably has di- rect influence in the distribution of intensive earthquakes arising together with anomalies of the lithosphere deep structure. Submeridional and NNE vectors predominate in the central Asian transit zone, where the transpressive neotectonic regime prevails. At the same time mainly east and southeast directed vectors are distributed in the East Asian zone in conditions of the transtensive regime. Such inference coincides with the more detail analysis of recent kinematics in the Baikal Rift System and adjacent territory. The most intensive seismic events in intra-craton environment of central Asia are connected with active interblock zones, which divide crust or mantle-crust blocks. The tectonic energy relaxation due to interaction of main lithosphere plates takes place not only in their boundaries, but also in these interblock zones as a result of interaction between blocks. Note one more peculiarity of the seismic energy dis- tribution within the examined area. Blocks, which are bounded by high seismic interblock zones, not always have the high density of the seismic energy inside them. The energy density for such blocks as the Pamirs, Tien Shan and the Himalayas comes to 1.67-1.98·108 J/km2/y. At the same time for Tarim, Qaidam and Tibet it comes to (0.38-0.51)·108, but for Amurian and Indochina-Sunda Figure 10. The left-lateral main sayany fault near the north side of the Tunka trough west of the south edge of the Lake Bai- kal (all photos of Yu. Gatinsky). 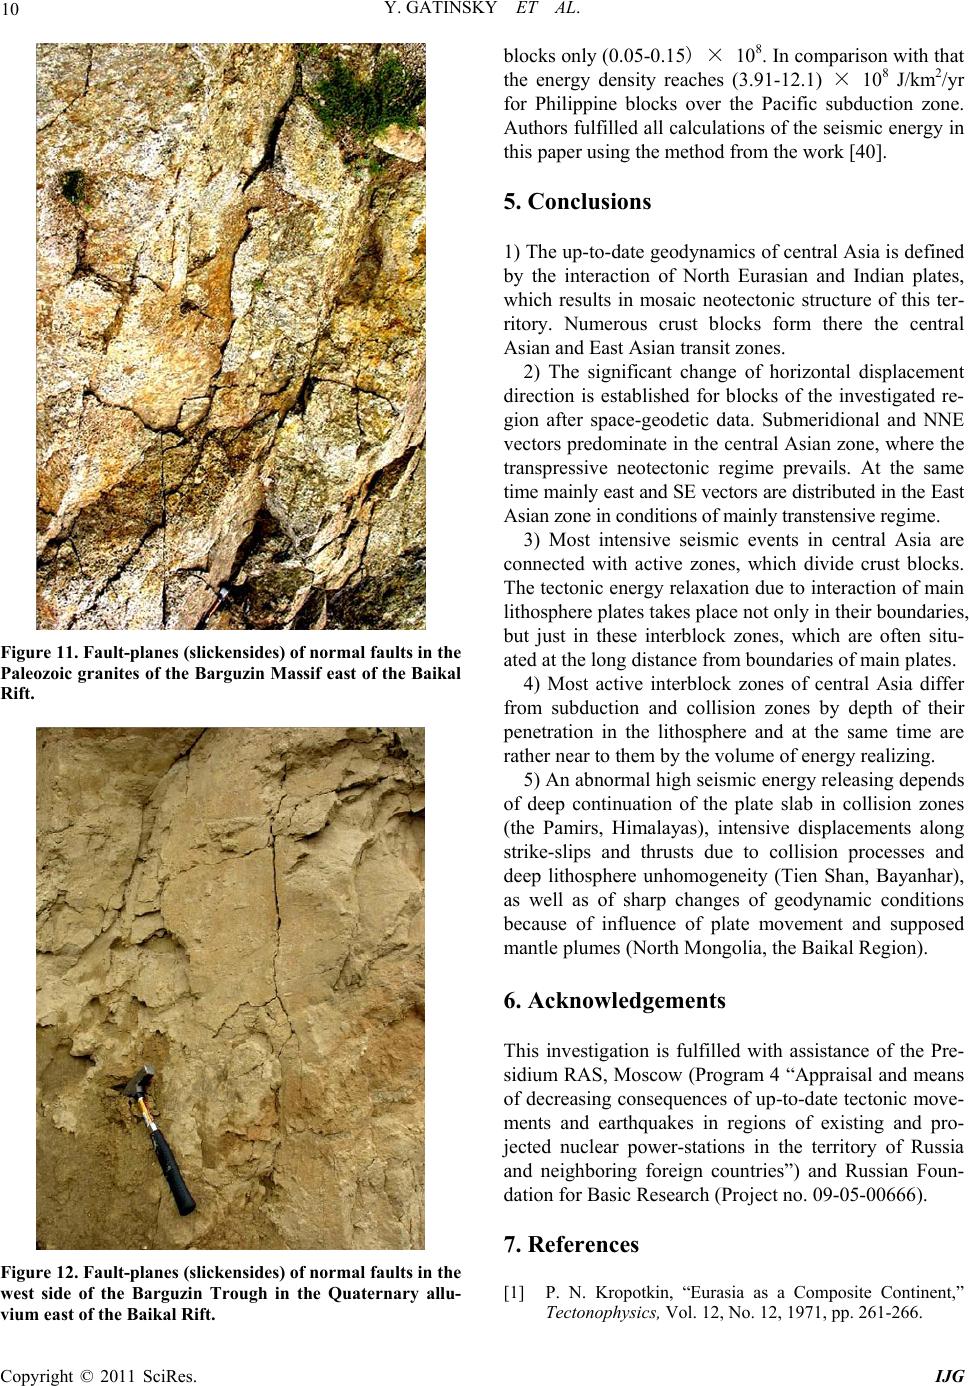 Y. GATINSKY ET AL. Copyright © 2011 SciRes. IJG 10 Figure 11. Fault-planes (slickensides) of normal faults in the Paleozoic granites of the Barguzin Massif east of the Baikal Rift. Figure 12. Fault-planes (slickensides) of normal faults in the west side of the Barguzin Trough in the Quaternary allu- vium east of the Baikal Rift. blocks only (0.05-0.15) × 108. In comparison with that the energy density reaches (3.91-12.1) × 108 J/km2/yr for Philippine blocks over the Pacific subduction zone. Authors fulfilled all calculations of the seismic energy in this paper using the method from the work [40]. 5. Conclusions 1) The up-to-date geodynamics of central Asia is defined by the interaction of North Eurasian and Indian plates, which results in mosaic neotectonic structure of this ter- ritory. Numerous crust blocks form there the central Asian and East Asian transit zones. 2) The significant change of horizontal displacement direction is established for blocks of the investigated re- gion after space-geodetic data. Submeridional and NNE vectors predominate in the central Asian zone, where the transpressive neotectonic regime prevails. At the same time mainly east and SE vectors are distributed in the East Asian zone in conditions of mainly transtensive regime. 3) Most intensive seismic events in central Asia are connected with active zones, which divide crust blocks. The tectonic energy relaxation due to interaction of main lithosphere plates takes place not only in their boundaries, but just in these interblock zones, which are often situ- ated at the long distance from boundaries of main plates. 4) Most active interblock zones of central Asia differ from subduction and collision zones by depth of their penetration in the lithosphere and at the same time are rather near to them by the volume of energy realizing. 5) An abnormal high seismic energy releasing depends of deep continuation of the plate slab in collision zones (the Pamirs, Himalayas), intensive displacements along strike-slips and thrusts due to collision processes and deep lithosphere unhomogeneity (Tien Shan, Bayanhar), as well as of sharp changes of geodynamic conditions because of influence of plate movement and supposed mantle plumes (North Mongolia, the Baikal Region). 6. Acknowledgements This investigation is fulfilled with assistance of the Pre- sidium RAS, Moscow (Program 4 “Appraisal and means of decreasing consequences of up-to-date tectonic move- ments and earthquakes in regions of existing and pro- jected nuclear power-stations in the territory of Russia and neighboring foreign countries”) and Russian Foun- dation for Basic Research (Project no. 09-05-00666). 7. References [1] P. N. Kropotkin, “Eurasia as a Composite Continent,” Tectonophysics, Vol. 12, No. 12, 1971, pp. 261-266. 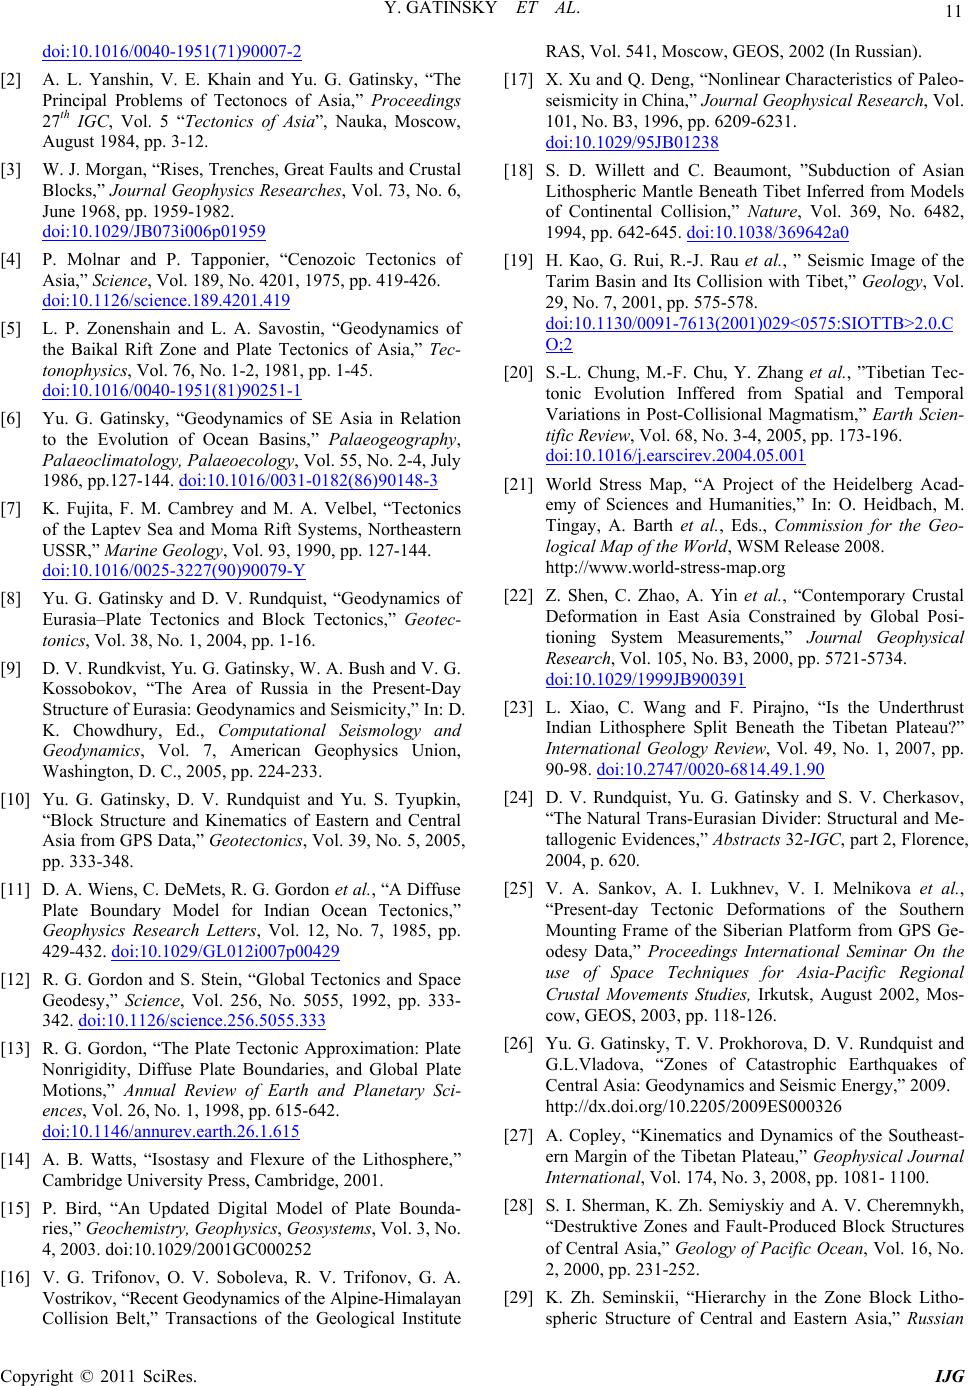 Y. GATINSKY ET AL. Copyright © 2011 SciRes. IJG 11 doi:10.1016/0040-1951(71)90007-2 [2] A. L. Yanshin, V. E. Khain and Yu. G. Gatinsky, “The Principal Problems of Tectonocs of Asia,” Proceedings 27th IGC, Vol. 5 “Tectonics of Asia”, Nauka, Moscow, August 1984, pp. 3-12. [3] W. J. Morgan, “Rises, Trenches, Great Faults and Crustal Blocks,” Journal Geophysics Researches, Vol. 73, No. 6, June 1968, pp. 1959-1982. doi:10.1029/JB073i006p01959 [4] P. Molnar and P. Tapponier, “Cenozoic Tectonics of Asia,” Science, Vol. 189, No. 4201, 1975, pp. 419-426. doi:10.1126/science.189.4201.419 [5] L. P. Zonenshain and L. A. Savostin, “Geodynamics of the Baikal Rift Zone and Plate Tectonics of Asia,” Tec- tonophysics, Vol. 76, No. 1-2, 1981, pp. 1-45. doi:10.1016/0040-1951(81)90251-1 [6] Yu. G. Gatinsky, “Geodynamics of SE Asia in Relation to the Evolution of Ocean Basins,” Palaeogeography, Palaeoclimatology, Palaeoecology, Vol. 55, No. 2-4, July 1986, pp.127-144. doi:10.1016/0031-0182(86)90148-3 [7] K. Fujita, F. M. Cambrey and M. A. Velbel, “Tectonics of the Laptev Sea and Moma Rift Systems, Northeastern USSR,” Marine Geology, Vol. 93, 1990, pp. 127-144. doi:10.1016/0025-3227(90)90079-Y [8] Yu. G. Gatinsky and D. V. Rundquist, “Geodynamics of Eurasia–Plate Tectonics and Block Tectonics,” Geotec- tonics, Vol. 38, No. 1, 2004, pp. 1-16. [9] D. V. Rundkvist, Yu. G. Gatinsky, W. A. Bush and V. G. Kossobokov, “The Area of Russia in the Present-Day Structure of Eurasia: Geodynamics and Seismicity,” In: D. K. Chowdhury, Ed., Computational Seismology and Geodynamics, Vol. 7, American Geophysics Union, Washington, D. C., 2005, pp. 224-233. [10] Yu. G. Gatinsky, D. V. Rundquist and Yu. S. Tyupkin, “Block Structure and Kinematics of Eastern and Central Asia from GPS Data,” Geotectonics, Vol. 39, No. 5, 2005, pp. 333-348. [11] D. A. Wiens, C. DeMets, R. G. Gordon et al., “A Diffuse Plate Boundary Model for Indian Ocean Tectonics,” Geophysics Research Letters, Vol. 12, No. 7, 1985, pp. 429-432. doi:10.1029/GL012i007p00429 [12] R. G. Gordon and S. Stein, “Global Tectonics and Space Geodesy,” Science, Vol. 256, No. 5055, 1992, pp. 333- 342. doi:10.1126/science.256.5055.333 [13] R. G. Gordon, “The Plate Tectonic Approximation: Plate Nonrigidity, Diffuse Plate Boundaries, and Global Plate Motions,” Annual Review of Earth and Planetary Sci- ences, Vol. 26, No. 1, 1998, pp. 615-642. doi:10.1146/annurev.earth.26.1.615 [14] A. B. Watts, “Isostasy and Flexure of the Lithosphere,” Cambridge University Press, Cambridge, 2001. [15] P. Bird, “An Updated Digital Model of Plate Bounda- ries,” Geochemistry, Geophysics, Geosystems, Vol. 3, No. 4, 2003. doi:10.1029/2001GC000252 [16] V. G. Trifonov, O. V. Soboleva, R. V. Trifonov, G. A. Vostrikov, “Recent Geodynamics of the Alpine-Himalayan Collision Belt,” Transactions of the Geological Institute RAS, Vol. 541, Moscow, GEOS, 2002 (In Russian). [17] X. Xu and Q. Deng, “Nonlinear Characteristics of Paleo- seismicity in China,” Journal Geophysical Research, Vol. 101, No. B3, 1996, pp. 6209-6231. doi:10.1029/95JB01238 [18] S. D. Willett and C. Beaumont, ”Subduction of Asian Lithospheric Mantle Beneath Tibet Inferred from Models of Continental Collision,” Nature, Vol. 369, No. 6482, 1994, pp. 642-645. doi:10.1038/369642a0 [19] H. Kao, G. Rui, R.-J. Rau et al., ” Seismic Image of the Tarim Basin and Its Collision with Tibet,” Geology, Vol. 29, No. 7, 2001, pp. 575-578. doi:10.1130/0091-7613(2001)029<0575:SIOTTB>2.0.C O;2 [20] S.-L. Chung, M.-F. Chu, Y. Zhang et al., ”Tibetian Tec- tonic Evolution Inffered from Spatial and Temporal Variations in Post-Collisional Magmatism,” Earth Scien- tific Review, Vol. 68, No. 3-4, 2005, pp. 173-196. doi:10.1016/j.earscirev.2004.05.001 [21] World Stress Map, “A Project of the Heidelberg Acad- emy of Sciences and Humanities,” In: O. Heidbach, M. Tingay, A. Barth et al., Eds., Commission for the Geo- logical Map of the World, WSM Release 2008. http://www.world-stress-map.org [22] Z. Shen, C. Zhao, A. Yin et al., “Contemporary Crustal Deformation in East Asia Constrained by Global Posi- tioning System Measurements,” Journal Geophysical Research, Vol. 105, No. B3, 2000, pp. 5721-5734. doi:10.1029/1999JB900391 [23] L. Xiao, C. Wang and F. Pirajno, “Is the Underthrust Indian Lithosphere Split Beneath the Tibetan Plateau?” International Geology Review, Vol. 49, No. 1, 2007, pp. 90-98. doi:10.2747/0020-6814.49.1.90 [24] D. V. Rundquist, Yu. G. Gatinsky and S. V. Cherkasov, “The Natural Trans-Eurasian Divider: Structural and Me- tallogenic Evidences,” Abstracts 32-IGC, part 2, Florence, 2004, p. 620. [25] V. A. Sankov, A. I. Lukhnev, V. I. Melnikova et al., “Present-day Tectonic Deformations of the Southern Mounting Frame of the Siberian Platform from GPS Ge- odesy Data,” Proceedings International Seminar On the use of Space Techniques for Asia-Pacific Regional Crustal Movements Studies, Irkutsk, August 2002, Mos- cow, GEOS, 2003, pp. 118-126. [26] Yu. G. Gatinsky, T. V. Prokhorova, D. V. Rundquist and G.L.Vladova, “Zones of Catastrophic Earthquakes of Central Asia: Geodynamics and Seismic Energy,” 2009. http://dx.doi.org/10.2205/2009ES000326 [27] A. Copley, “Kinematics and Dynamics of the Southeast- ern Margin of the Tibetan Plateau,” Geophysical Journal International, Vol. 174, No. 3, 2008, pp. 1081- 1100. [28] S. I. Sherman, K. Zh. Semiyskiy and A. V. Cheremnykh, “Destruktive Zones and Fault-Produced Block Structures of Central Asia,” Geology of Pacific Ocean, Vol. 16, No. 2, 2000, pp. 231-252. [29] K. Zh. Seminskii, “Hierarchy in the Zone Block Litho- spheric Structure of Central and Eastern Asia,” Russian  Y. GATINSKY ET AL. Copyright © 2011 SciRes. IJG 12 Geology and Geophysics, Vol. 49, No. 10, October 2008, pp. 771-779. doi:10.1016/j.rgg.2007.11.017 [30] A. M. Negredo, A. Replumaz, A. Villaseñor and S. Guil- lot, “Modeling the Evolution of Continental Subduction Processes in the Pamir–Hindu Kush Region,” Earth and Planetary Science Letters, Vol. 259, No. 1-2, 2007, pp. 212-225. doi:10.1016/j.epsl.2007.04.043 [31] S. Li, M. J. Unsworth, J. R. Booker et al., “Partial Melt Or Aqueous Fluid in the Mid-Crust of Southern Tibet? Constraints from INDEPTH magnetotelluric data,” Geo- physical Journal International, Vol. 153, No. 2, 2003, pp. 289-304. doi:10.1046/j.1365-246X.2003.01850.x [32] K. D. Solon, A. G. Jones, K. D. Nelson et al., “Structure of the Crust in the Vicinity of the Banggong-Nujiang Su- ture in Central Tibet from INDEPTH Magnetotelluric Data,” Journal Geophysical Research, Vol. 110, No. B10102, 2005; doi:10.1029/2003JB002405 [33] Yu. G. Gatinsky and G. L. Vladova, “Subduction Zones of SE Asia: Main Types, Seismicity and Mineralization,” Proceedings VAG International Symposium, Hanoi, No- vember 2008, pp. 9-16. [34] J. Liu-Zeng, Z. Zhang, L. Wen et al., “Co-Seismic Rup- tures of the 12 May 2008, Ms 8.0 Wenchuan Earthquake, Sichuan: East–West Crustal Shortening on Oblique, Par- allel Thrusts Along the Eastern Edge of Tibet,” Earth and Planetary Science Letters, Vol. 286, No. 3-4, 2009, pp. 355-370. doi:10.1016/j.epsl.2009.07.017 [35] Yu. G. Gatinsky, D. V. Rundquist, G. L. Vladova and T. V. Prokhorova, “Geodynamics of the Sichuan Earthquake Region in May 12, 2008,” Doklady Earth Sciences, Vol. 423A, No. 9, 2008, pp.1507-1509. doi:10.1134/S1028334X08090419 [36] X. Yuan, A. S. Egorov, GEMOC, “A Short Introduction to Global Geoscience Transect 21: Arctic Ocean–Eurasia– Pacific Ocean,” Science Press, 2000. [37] Chen Ji, “Finite Fault Models for M7.9 Earthquake,” 2008. http://earthquake.usgs.gov/eqcenter/page [38] A. I. Miroshnichenko, V. A. Sankov, A. V. Parfeevets and A. V. Lukhnev, “State of Stress and Strain of the Earth Crust of the Basins of North Mongolia from the Model Results,” Proceedings Conference commemorat- ing the 50th Anniversary of the 1957 Gobi-Altay earth- quake, Ulaanbaatar–Irkutsk, August. 2007, pp. 138-143. [39] A. F. Grachev, “Modern Volcanism, Mantle Plumes, and Their Connection with the Stress Intensity in the Litho- sphere,” In: A. F. Grachev, Ed., Neotectonics, Geody- namics and Seismicity of Northern Eurasia, Probel, Moscow, 2000, pp. 245-266 (In Russian). [40] H. Kanamori and D. L. Anderson, “Theoretical Basis of Some Empirical Relations in Seismology,” Bulletin of the Seismological Society of America, Vol. 65, No. 5, Octo- ber 1975, pp. 1073-1109.
|