The Empirical Study about Introduction of Stock Index Futures on the Volatility of Spot Market
114
CSI 300 index futures launch date just over three years,
the research scholars are mostly simulation-based trans-
action data, and conclusions vary. Therefore, this paper
by choosing real transaction data were established befo re
and after the introduction of index futures GARCH
model, and the introduction of dummy variables, a series
of empirical tests to explore CSI 300 stock index futures
on the impact of volatility in the spot market, with certain
practical significance.
2. Research Methods
2.1. Sample Description
This data is selected April 16, 2007 to April 16, 2013 in
CSI 300 stock index futures contracts and the CSI 300
stock index daily closing price, that is listed on the CSI
300 stock index futures before and after the three years
of the corresponding stock the daily closing price of the
stock index of 1460 data. Among them, the futures data
for the selection of the main contract data, namely the
nearest month futures contracts of the daily closing price
data. In the most recent month before the contract set-
tlement date two or three days, month contract will be
converted into the main contract, and then turned to the
next nearest month futures contract closing data, and so
on, can be a continuous set of stock index futures price
time series. Data mainly comes from China Financial
Futures Exchange, and the News Finance website. In
accordance with the stock index futures launch time the
data is divided into two stages, the first stage before the
introduction of stock index futures, is from April 16,
2007 to April 16, 2010; second stage after the introduc-
tion of stock index futures, from April 16, 2010 to April
16, 2013.
2.2. Data Processing
Firstly, in order to eliminate heteroscedasticity, respec-
tively futures price and spot price series sequence loga-
rithm.
Assuming that the trading day closing price of a fu-
tures contract and the spot index closing price are de-
noted as t and t, then the natural logarithm of fu-
tures contract price series expressed as t
P Qln
t
P
ln
ttt
, its
logarithmic rate of return is 1
ln
PP
, the
natural logarithm of stock price series expressed as
, its logarithm yields expressed as
ln
t
St
Q
1
ln ln
tt
SQQ
t
.
The study object of this paper is the log return of stock
index future s and spot price rate.
2.3. Model Selection
Existence of financial time series data aggregation and
volatility heterosced asticity, OLS regression model is the
assumption that “homoscedasticity”, therefore, in the
study when the price volatility of financial products,
widely used heteroscedasticity model is the most widely
used in the 1982 Engle proposed autoregressive condi-
tional heteroskedasticity model (ARCH model), Boller-
slev deepened the ARCH model, the generalized autore-
gressive conditional heteroskedasticity model (GARCH
model), GARCH model can well reflect the aggregation
of price volatility, in the previous literature, the wide-
spread use of GARCH (1, 1) model reflects the aggrega-
tion of financial products.
This paper uses the GARCH (1, 1) model stock index
futures on the volatility of the spot market, and the in-
troduction of dummy variables in the conditional vari-
ance to reflect the CSI 300 stock index futures on the
impact of the stock market volatility, Before the intro-
duction of stock index futures, D = 0, after the introduc-
tion of stock index futures D = 1. The GARCH (1, 1)
model with the following :
The mean equation: ttt
yx
The conditional variance equation:
22
11tt
2
t
The GARCH (1, 1) model was respectively established
for the different stages, the model does not add dummy
variables.
3. Empirical Tests
We need to know the basic statistical characteristics of
the return series of CSI 300 index before the empirical
test.
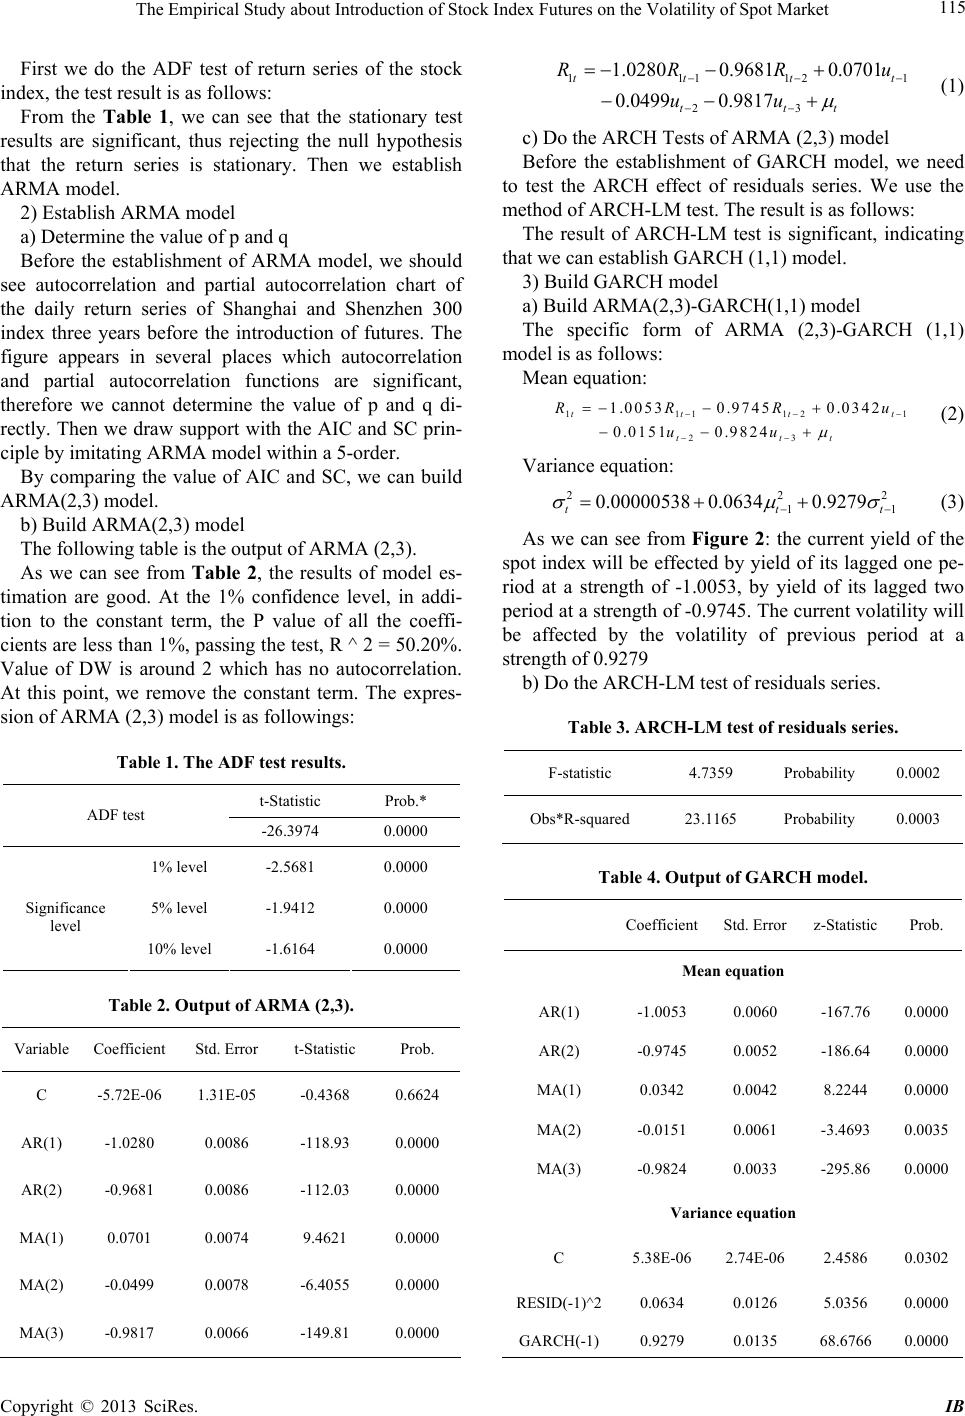
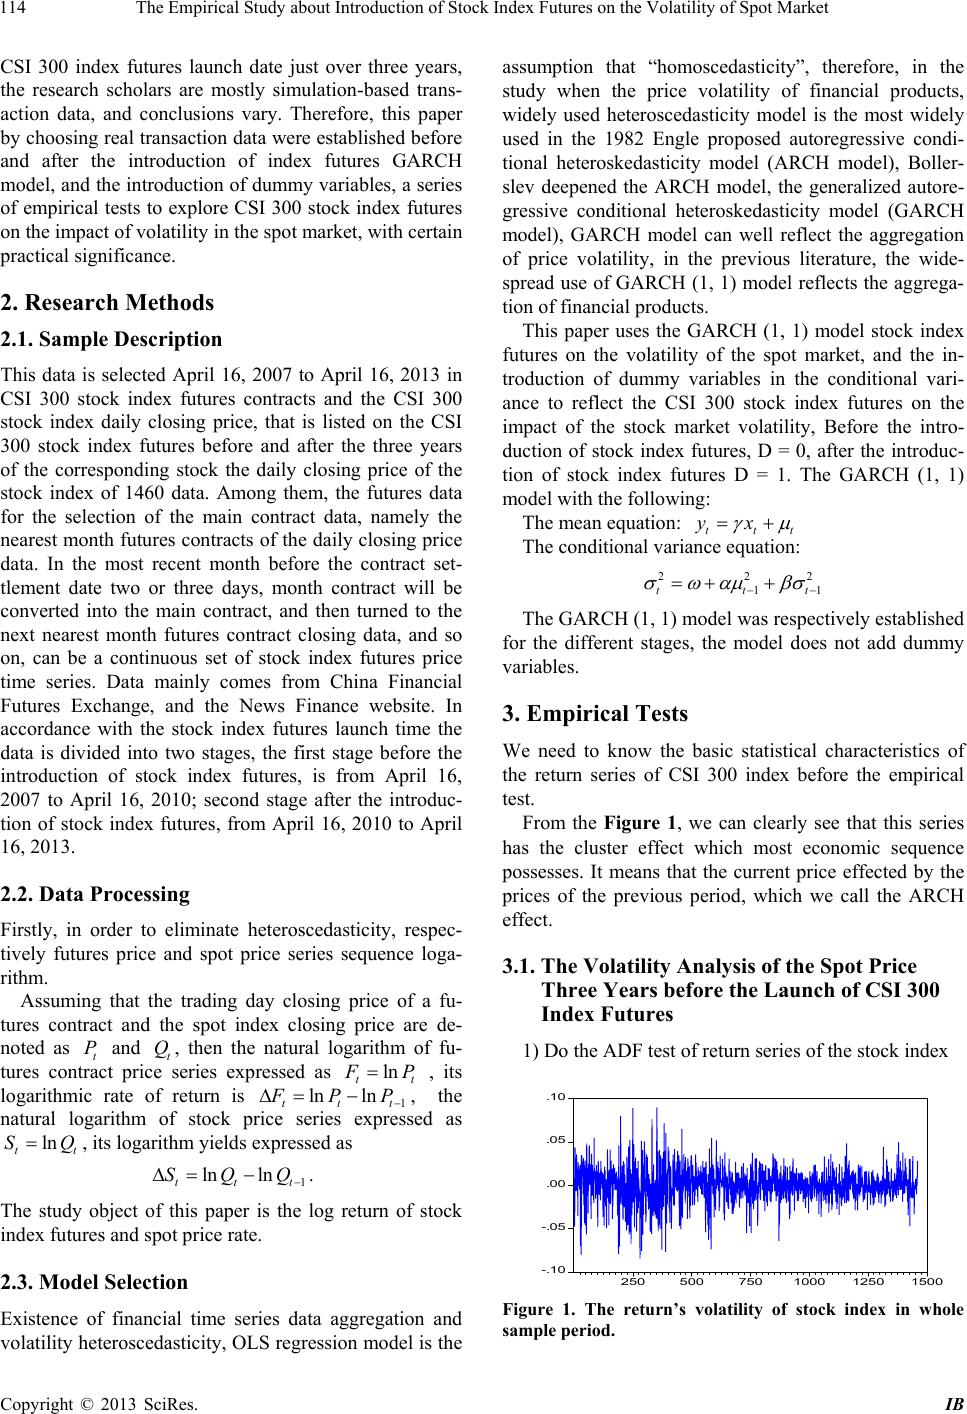
From the Figure 1, we can clearly see that this series
has the cluster effect which most economic sequence
possesses. It means that the current price effected by the
prices of the previous period, which we call the ARCH
effect.
3.1. The Volatility Analysis of the Spot Price
Three Years before the Launch of CSI 300
Index Futures
1) Do the ADF test of return series of the stock index
-.10
-.05
.00
.05
.10
250 500 7501000 1250 150
Figure 1. The return’s volatility of stock index in whole
sample period.
Copyright © 2013 SciRes. IB