Paper Menu >>
Journal Menu >>
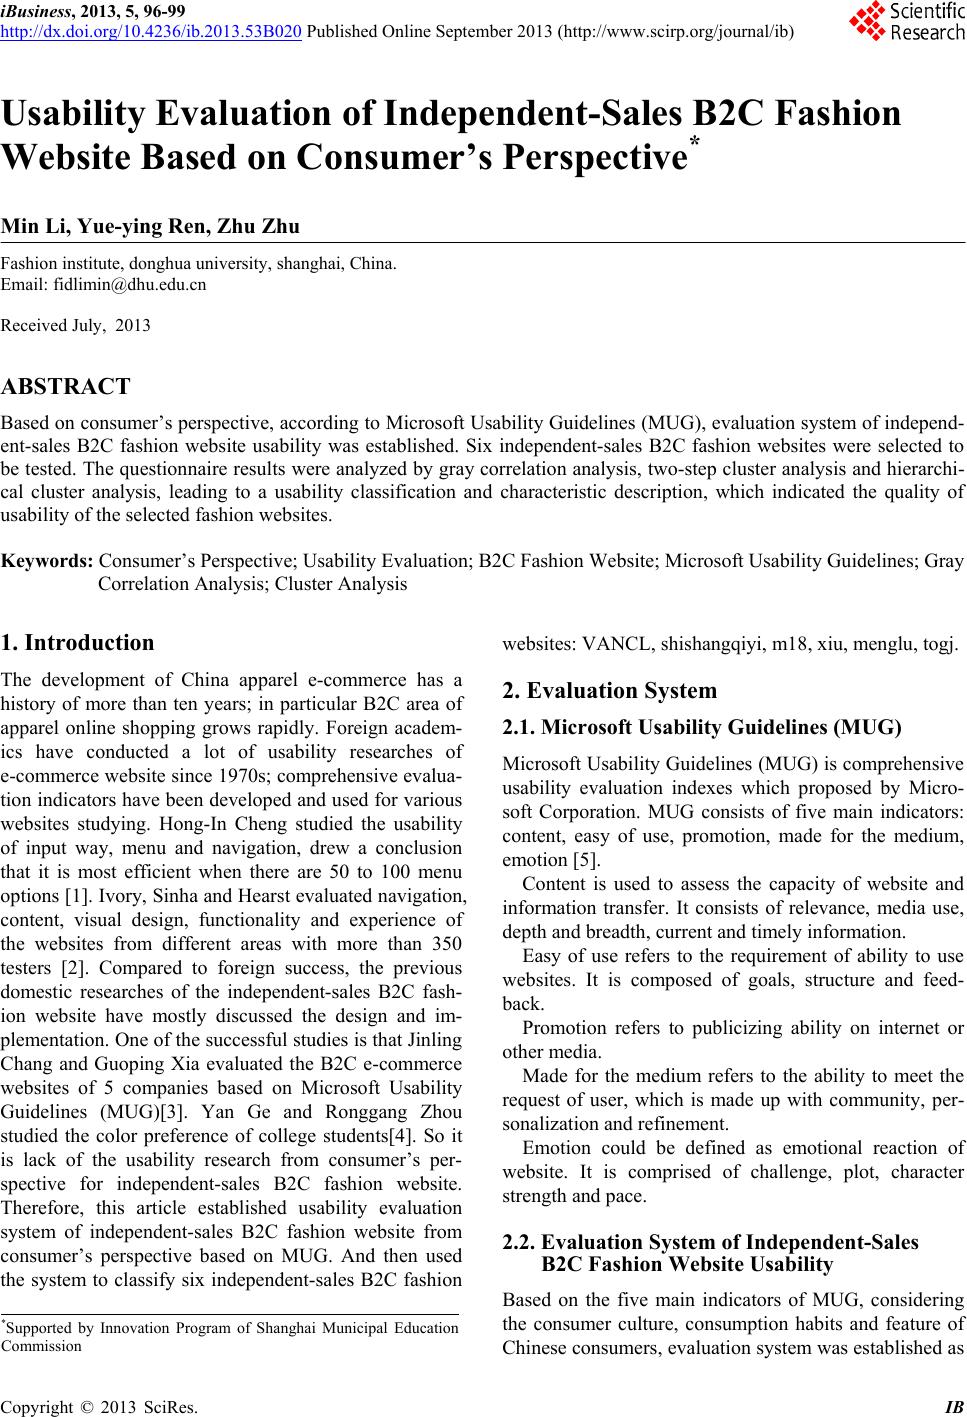 iBusiness, 2013, 5, 96-99 http://dx.doi.org/10.4236/ib.2013.53B020 Published Online September 2013 (http://www.scirp.org/journal/ib) Usability Evaluation of Independent-Sales B2C Fashion Website Based on Consumer’s Perspective* Min Li, Yue-ying Ren, Zhu Zhu Fashion institute, donghua university, shanghai, China. Email: fidlimin@dhu.edu.cn Received July, 2013 ABSTRACT Based on consumer’s perspective, according to Microsoft Usability Guidelines (MUG), evaluation system of independ- ent-sales B2C fashion website usability was established. Six independent-sales B2C fashion websites were selected to be tested. The questionnaire results were analyzed by gray correlation analysis, two-step cluster analysis and hierarchi- cal cluster analysis, leading to a usability classification and characteristic description, which indicated the quality of usability of th e selected fashion websites. Keywords: Consumer’s Perspective; Usability Evaluation; B2C Fashion Website; Microsoft Usability Guid elines; Gray Correlation Analysis; Cluster Analysis 1. Introduction The development of China apparel e-commerce has a history of more than ten years; in particular B2C area of apparel online shopping grows rapidly. Foreign academ- ics have conducted a lot of usability researches of e-commerce website since 1970s; comprehensive evalua- tion indicators have been developed and used for various websites studying. Hong-In Cheng studied the usability of input way, menu and navigation, drew a conclusion that it is most efficient when there are 50 to 100 menu options [1]. Ivory, Sinha and Hearst evaluated navigation, content, visual design, functionality and experience of the websites from different areas with more than 350 testers [2]. Compared to foreign success, the previous domestic researches of the independent-sales B2C fash- ion website have mostly discussed the design and im- plementation. One of the successfu l studies is that Jinling Chang and Guoping Xia evaluated the B2C e-commerce websites of 5 companies based on Microsoft Usability Guidelines (MUG)[3]. Yan Ge and Ronggang Zhou studied the color preference of college students[4]. So it is lack of the usability research from consumer’s per- spective for independent-sales B2C fashion website. Therefore, this article established usability evaluation system of independent-sales B2C fashion website from consumer’s perspective based on MUG. And then used the system to classify six independent-sales B2C fashion websites: VANCL, shishangqiyi, m18, xiu, menglu, togj. 2. Evaluation System 2.1. Microsoft Usability Guidelines (MUG) Microsoft Usability Guidelines (MUG) is compreh ensive usability evaluation indexes which proposed by Micro- soft Corporation. MUG consists of five main indicators: content, easy of use, promotion, made for the medium, emoti on [5]. Content is used to assess the capacity of website and information transfer. It consists of relevance, media use, depth and breadth, current and timely information. Easy of use refers to the requirement of ability to use websites. It is composed of goals, structure and feed- back. Promotion refers to publicizing ability on internet or other media. Made for the medium refers to the ability to meet the request of user, which is made up with community, per- sonalization and refinement. Emotion could be defined as emotional reaction of website. It is comprised of challenge, plot, character strength and pace. 2.2. Evaluation System of Independent-Sales B2C Fashion Website Usability Based on the five main indicators of MUG, considering the consumer culture, consumption habits and feature of Chinese consumers, evaluation system was established as *Supported by Innovation Program of Shanghai Municipal Education Commission Copyright © 2013 SciRes. IB 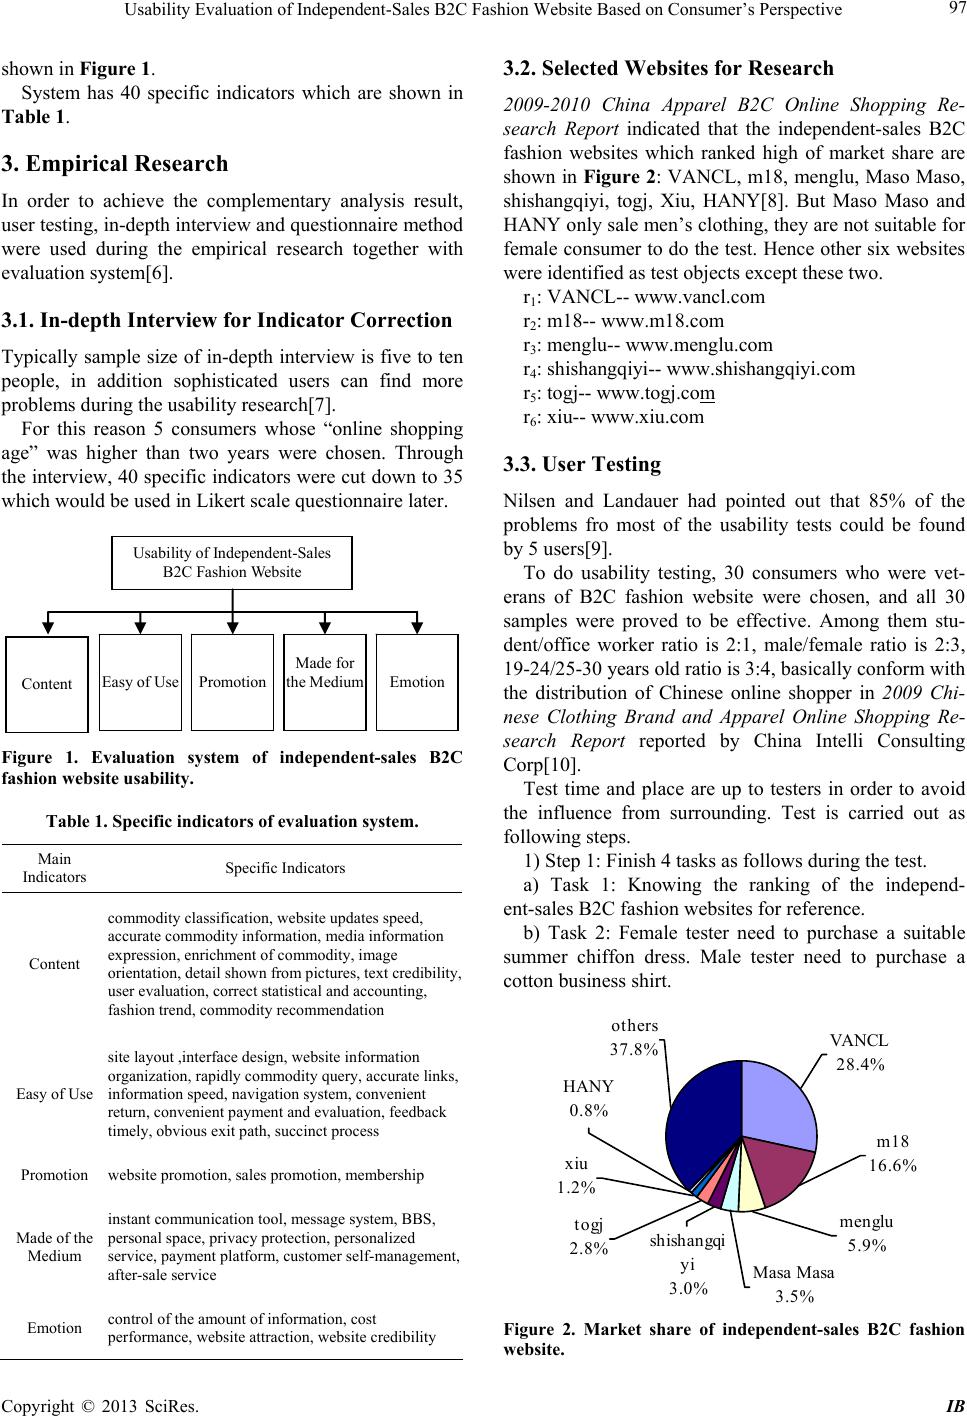 Usability Evaluation of Independent-Sales B2C Fashion Website Based on Consumer’s Perspective 97 shown in Figure 1. System has 40 specific indicators which are shown in Table 1. 3. Empirical Research In order to achieve the complementary analysis result, user testing, in-depth in terview and qu estionnaire method were used during the empirical research together with evaluation system[6]. 3.1. In-depth Interview for Indicator Correction Typically sample size of in-depth interview is five to ten people, in addition sophisticated users can find more problems during th e usability research[7]. For this reason 5 consumers whose “online shopping age” was higher than two years were chosen. Through the interview, 40 specific indicator s were cut down to 35 which would be used in Likert scale questionnaire later. Usability of Independent-Sales B2C Fashion Website Content Easy of Use Promotion Made for the Medium Emotion Figure 1. Evaluation system of independent-sales B2C fashion website usability. Table 1. Specific indicators of evaluation system. Main Indicators Specific Indicators Content commodity classification, website updates s pee d, accurate commodity information, media information expression, enrichment of com modity, image orientation, detail shown from pictures, text credi b ility, user evaluation, correct statistical and accounting, fashion trend, commodity recommendation Easy of Use site layout ,interface design, website information organization, rapidly commodity query, accurate links, informa tion speed, navigation system, convenient return, convenient payment and evaluation, feedback timely, obvious exit path, succinct process Promotion website promotion, sales promotion, membership Made of the Medium instant communication tool, message system, BBS, personal space, privacy protection, personalized service, payment platform, customer self-management, after-sale service Emotion control of the amount of information, cost performance, website attraction, website credibility 3.2. Selected Websites for Research 2009-2010 China Apparel B2C Online Shopping Re- search Report indicated that the independent-sales B2C fashion websites which ranked high of market share are shown in Figure 2: VANCL, m18, menglu, Maso Maso, shishangqiyi, togj, Xiu, HANY[8]. But Maso Maso and HANY only sale men’s clothing, they are not suitable for female consumer to do the test. Hence other six websites were identified as test objects except these two. r1: VANCL-- www.vancl.com r2: m18-- www.m18.com r3: menglu-- www.menglu.com r4: shishangqiyi-- www.shishangqiyi.com r5: togj-- www.togj.com r6: xiu-- www.xiu.com 3.3. User Testing Nilsen and Landauer had pointed out that 85% of the problems fro most of the usability tests could be found by 5 users[9]. To do usability testing, 30 consumers who were vet- erans of B2C fashion website were chosen, and all 30 samples were proved to be effective. Among them stu- dent/office worker ratio is 2:1, male/female ratio is 2:3, 19-24/25-30 years old ratio is 3:4, basically conform with the distribution of Chinese online shopper in 2009 Chi- nese Clothing Brand and Apparel Online Shopping Re- search Report reported by China Intelli Consulting Corp[10]. Test time and place are up to testers in order to avoid the influence from surrounding. Test is carried out as following steps. 1) Step 1: Finish 4 tasks as follows during the test. a) Task 1: Knowing the ranking of the independ- ent-sales B2C fashion websites for reference. b) Task 2: Female tester need to purchase a suitable summer chiffon dress. Male tester need to purchase a cotton business shirt. menglu 5.9% togj 2.8% Masa Masa 3.5% xiu 1.2% shishangqi yi 3.0% HANY 0.8% VANCL 28.4% m18 16.6% ot hers 37.8% Figure 2. Market share of independent-sales B2C fashion website. Copyright © 2013 SciRes. IB  Usability Evaluation of Independent-Sales B2C Fashion Website Based on Consumer’s Perspective 98 c) Task 3: Female tester need to purchase a striped sweater which is on promotion. Male tester need to pur- chase a pair of jeans which is on promotion. d) Task 4: Consult with customer service about size. 2) Step 2: Fill the form of indicator weight. 3) Step 3: Fill in the score of each indicator for each website. 4. Data Analysis 4.1. Gray Correlation Analysis Subjective assessment for indicators of website are in- fluenced by knowledge, experience, culture and many other known or unknown factors, as a result, grey corre- lation analysis can be used for evaluation[11]. Based on grey correlation analysis, the higher the cor- relation coefficient is, the better the usability will be. After analyzing scores given by testers with SPSS17.0, here are correlation coefficients of websites: r1=0.902, r2=0.821, r3=0.684, r4=0.827, r5=0.670, r6=0.72. It is leading to the classification of usability: VANCL, shis- hangqiyi, m18, xiu, menglu, togj. Table 2 is the correlation coefficient of main indica- tors, it is shown that shishangqiyi, m18 an d VANCL rank high of content, which accords with their feature of fast fashion. VANCL performs well in easy of use, and testers also have pointed out the download time is very important during the shopping. It seems to make sense that the ranking of promotion matches that of market share in the main. VANLE get high praise of made of medium, from lo- gistics to packing it does very well. On the contrary, af- ter-sale service of menglu has been co mplained a lot. At last it is not surprising that VANCL ranks high of emotion, owe to th e good reputation. 4.2. Cluster Analysis Cluster analysis of SPSS is composed by K-means clus- ter, hierarchical cluster and two-step cluster, the latter two have been used in this article. Table 2. Correlation coefficient of main indicators. correlation coefficient Content Easy of Use Promotion Made of the Medium Emotion r1 0.299 0.218 0.118 0.137 0.129 r2 0.295 0.193 0.098 0.123 0.111 r3 0.246 0.163 0.072 0.100 0.103 r4 0.325 0.205 0.073 0.106 0.118 r5 0.235 0.160 0.066 0.112 0.096 r6 0.239 0.187 0.064 0.132 0.102 Log-likelihood and Bayesian Information Criterion (BIC) have been selected to do two-step cluster analysis, as shown in Tab le 3, it comes to higher distance ratio in step 2 and step 4. Besides, each cluster should extremely represent the characteristics of the website, consequently hierarchical cluster analysis has been down under the premise of 4 clusters based on Between-groups Linkage and Squared Euclidean. Figure 3 Dendrogram shows that 4 clusters are: VANCL and m18, menglu and togj, shishangqiyi, xiu. According to Table 4, Cluster 1 performs the best for promotion, Cluster 3 is the best of content, and Cluster 4 does better than others in made of the medium. As a result of the Cluster Analysis, the characteristics of each cluster could be summarized and described as blow in Table 5. It is observed that the clustering result is basically conducted in accordance with the sorting of the usability: r1>r4>r2>r6>r 3>r5. 5. Conclusions 1) The evaluation system of this article is based on consumer’s perspective, and Microsoft Usability Guide- lines (MUG), combined with the uniqueness of inde- pendent-sales B2C fashion website. 2) On the basis of evaluation system, the usability classification of selected websites is given by gray corre- lation analysis: VANCL, shishangqiyi, m18, xiu, menglu, togj. Table 3. SPSS auto-clustering. Clusters BIC BIC Variance Variance Ratio Distance Ratio 1 36.102 2 43.602 7.501 1.000 3.832 3 58.802 15.199 2.026 1.093 4 74.231 15.429 2.057 1.821 5 90.783 16.552 2.207 1.144 6 107.50616.723 2.230 0.000 CASE 0 5 10 15 20 25 Label Num+-------+-------+------+-------+-------+ menglu r3 -+--------------+ togj r5 -+ +------------------------------+ xiu r6 -----------------+ | VANCL r1 -+------------+ | m18 r2 -+ +--------------------------------+ shis- hangqiyi r4 ---------------+ Figure 3. Dendrogram. Copyright © 2013 SciRes. IB 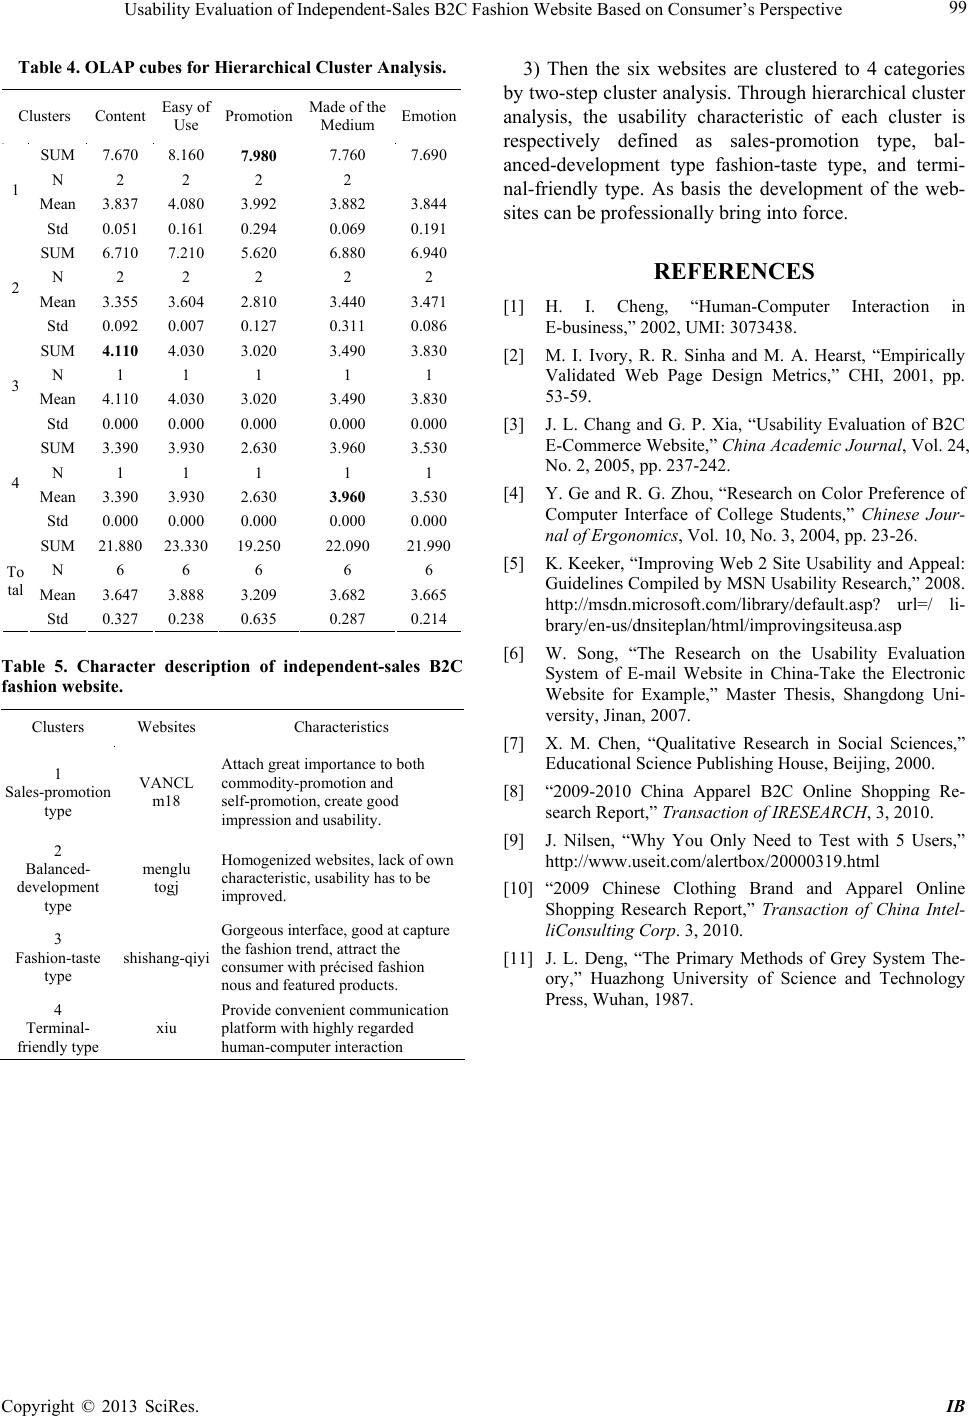 Usability Evaluation of Independent-Sales B2C Fashion Website Based on Consumer’s Perspective Copyright © 2013 SciRes. IB 99 Table 4. OLAP cubes for Hierarchical Cluster Analysis. Clusters Content Easy of Use Promotion Made of the Medium Emotion SUM 7.670 8.160 7.980 7.760 7.690 N 2 2 2 2 Mean 3.837 4.080 3.992 3.882 3.844 1 Std 0.051 0.161 0.294 0.069 0.191 SUM 6.710 7.210 5.620 6.880 6.940 N 2 2 2 2 2 Mean 3.355 3.604 2.810 3.440 3.471 2 Std 0.092 0.007 0.127 0.311 0.086 SUM 4.110 4.030 3.020 3.490 3.830 N 1 1 1 1 1 Mean 4.110 4.030 3.020 3.490 3.830 3 Std 0.000 0.000 0.000 0.000 0.000 SUM 3.390 3.930 2.630 3.960 3.530 N 1 1 1 1 1 Mean 3.390 3.930 2.630 3.960 3.530 4 Std 0.000 0.000 0.000 0.000 0.000 SUM 21.880 23.330 19.250 22.090 21.990 N 6 6 6 6 6 Mean 3.647 3.888 3.209 3.682 3.665 To tal Std 0.327 0.238 0.635 0.287 0.214 Table 5. Character description of independent-sales B2C fashion website. Clusters Websites Characteristics 1 Sales-promotion type VANCL m18 Attach great importance to both commodity-promotion and self-promotion, create good impression and usability. 2 Balanced- development type menglu togj Homogenized websites, lack of own characteristic, usability has to be improved. 3 Fashion-taste type shishang-qiyi Gorgeous interface, good at capture the fashion trend, attract the consumer with précised fashion nous and feat ured products. 4 Terminal- friendly type xiu Provide convenient communication platform with highly regarded human-computer interaction 3) Then the six websites are clustered to 4 categories by two-step cluster analysis. Through hierarchical cluster analysis, the usability characteristic of each cluster is respectively defined as sales-promotion type, bal- anced-development type fashion-taste type, and termi- nal-friendly type. As basis the development of the web- sites can be professionally bring into force. REFERENCES [1] H. I. Cheng, “Human-Computer Interaction in E-business,” 2002, UMI: 3073438. [2] M. I. Ivory, R. R. Sinha and M. A. Hearst, “Empirically Validated Web Page Design Metrics,” CHI, 2001, pp. 53-59. [3] J. L. Chang and G. P. Xia, “Usability Evaluation of B2C E-Commerce Website, ” China Academic Journal, Vol. 24, No. 2, 2005, pp. 237-242. [4] Y. Ge and R. G. Zhou, “Research on Color Preference of Computer Interface of College Students,” Chinese Jour- nal of Ergonomics, Vol. 10, No. 3, 2004, pp. 23-26. [5] K. Keeker, “Improving Web 2 Site Usability and Appeal: Guidelines Compiled by MSN Usability Research,” 2008. http://msdn.microsoft.com/library/default.asp? url=/ li- brary/en-us/dnsiteplan/html/improvingsiteusa.asp [6] W. Song, “The Research on the Usability Evaluation System of E-mail Website in China-Take the Electronic Website for Example,” Master Thesis, Shangdong Uni- versity, Jinan, 2007. [7] X. M. Chen, “Qualitative Research in Social Sciences,” Educational Science Publishing House, Beijing, 2000. [8] “2009-2010 China Apparel B2C Online Shopping Re- search Report,” Transaction of IRESEARCH, 3, 2010. [9] J. Nilsen, “Why You Only Need to Test with 5 Users,” http://www.useit.com/alertbox/20000319.html [10] “2009 Chinese Clothing Brand and Apparel Online Shopping Research Report,” Transaction of China Intel- liConsulting Corp. 3, 2010. [11] J. L. Deng, “The Primary Methods of Grey System The- ory,” Huazhong University of Science and Technology Press, Wuhan, 1987. |