iBusiness, 2013, 5, 59-62
http: //dx.doi.org/10.4236/ib.201 3.53B013 Published Online September 2013 (http://www.scirp.org/journal/ib) 59
Study on the Indicators of Taiwanese Tour Guides’
Service Quality
Jennifer Chen-Hua Min, Shu-Hua Chen, Mou-Yi Kao, Fu-Nan Hsu
Department of International Business, Ming Chuan University
Email: jennifer_min.tw@yahoo.com.tw, shchen@mail.mcu.edu.tw, mykao@mail.mcu.edu.tw, n32330015@yahoo.com.tw
Received June, 2013
ABSTRACT
The tourism industry is considered a typical service industry, one in which the involvement of service components is
relatively high. Serv ing and satisfying cu stomers are fundamental goals of the tourism business, with service pro viders
being part of the product itself. Given tour guides’ roles as intermediaries between tourists and an unfamiliar environ-
ment, special attention sh ould be paid to the service qu ality of tour guides, as it has th e potential to increase tourist sat-
isfaction and produce measurable benefits in profits and market share. The aim of the study is therefore to build the
quality indicators of tour gu ide services. In terms of research methodologies, a combination of qualitative an d quantita-
tive approaches was conducted to reach the objectives. After both in-depth interviews and two rounds of focus group
sessions, six dimensions (reliability, response, physical environment, guarantee, care and culture) and 30 indicators
were obtained. Analytic Hierarchy Process (AHP) was applied to determine the weighting of various evaluation criteria
on the indicators of Taiwanese tou r guides’ service quality. Among the criteria, “The tour guides hav e a precise service
attitude and executio n ability.” was found to be the most important, while “During the trip, the tour guides dress prop-
erly.” ranked as the least important.
Keywords: Tour Guides; PZB Model; Focus Group; AHP
1. Introduction
The significant role of service quality for business success
has been well acknowledged. Delivery of high service
quality can help organization s gain a co mpetitive advan tage
and differentiate themselves more effectively in the
marketplace [1]. How ever, service quality is rather difficu lt
to measure because of the complex nature of services and
unique qualiti es of a service tran sactio n (i.e. h eterog enei ty,
intangibility, and inseparability of production and
consumption), while the quality of a physical good is
relatively straightforward [2].
As an industry, the tourism industry is considered a
typical service industry, one in which the involvement of
service components is relatively high. Serving and
satisfying customers are fundamental goals of the
tourism business [3], with service providers being part of
the product itself [4].
However, although extensive literature has been de-
voted to the service quality in the tourism field, there has
been relatively little discussion of the service quality of
the tour guide population, nor has there been any as-
sessment of their quality of performance. The reason for
this gap may be the lack of appropriate service quality
indicators for tour guides. This is a worthwhile area of
research, as tour guides play an important role in the
success or failure of a tour experience and often crucially
influence tourists’ perceptions of the host destinatio n [5].
Given tour guides’ roles as intermediaries between tour-
ists and an unfamiliar environment, special attention
should be paid to the service quality of tour guides,
which has the potential to increase tourist satisfaction
and produce measurable benefits in profits and market
share [6]. A combination of qualitative and quantitative
approaches was conducted to reach the objectives. Since
the Analytic Hierarchy Process (AHP) method systema-
tizes complicated problems, is easy to operate, and inte-
grates most of the experts’ and evaluators’ opinions,
AHP method was therefore applied to determine the
weighting of various evaluation criteria [7].
Hence, the purpose of this study is threefold:
1) Build the dimensions on the quality indicators of
tour guide servi ces
2) Construct related evaluation indicators on tour
guide service quality
3) Evaluate the applicability of the quality indicators
of tour guide services in the tourism industry.
2. Methodology
In terms of research methodologies of the current study,
Copyright © 2013 SciRes. IB
Study on the Indicators of Taiwanese Tour Guides’ Service Quality
60
a combination of qualitative and quantitative approaches
was conducted to reach the objectives. In terms of quail-
tative method, both in-depth interviews and two rounds
of focus group sessions were carried out to ensure the
inclusion of an adequate and representative set of indica-
tors. Besides reviewing, comparing and contrasting rele-
vant research literature, one-on-one interviews of tour
guides were conducted to obtain information from their
different points of view using open-ended questions.
Both the interviews and focus group sessions were audio
tape-recorded, and a content analytic approach was em-
ployed which provides the researchers with the opportu-
nity to double check the answers and avoid missing any
important information [8]. Then, a panel of experts in-
cluding tour guides, practitio ners, travel agents, and gov-
ernment officials in charge of tourism affairs were ex-
amine the generated list of service quality dimensions
and criteria of tour guides to ensure that they adequately
cover the most important aspects.
In the current study, indicators of tour guides’ service
quality involve many complex aspects and could be
viewed as a multi-criteria decision-making problem.
Therefore a systematic measurement was adapted to
simplify the complexity and incorporate correlative crite-
ria for analysis of issues. Since AHP method has the
characteristics that is systematizes complicated problems,
is relatively easy to operate, and integrates most of the
experts’ and evaluators’ opinions, this study therefore
adopted AHP for the contrivance of weights. For the
quantitative method of the study, AHP was therefore
applied to determine the weighting of various evaluation
criteria on the indicators of Taiwanese tour guides’ ser-
vice quality.
AHP was first developed by Thomas L. Saaty in 1980
[7], and now has been applied in many diverse areas of
social management sciences. In the 1990’s, the tourism
scholars also applied in tourism planning , evaluation , and
decision making [9]. The method decomposes compli-
cated problems from higher hierarchies to lower ones.
Furthermore, it also systematizes the problem by utilize-
ing the subsystem perspective endowed in the system
that can be easily comprehended and evaluated. Finally,
it determines the priorities of the elements at each level
of the decision hierarchy an d synthesizes the priorities to
determine the overall priorities of the decision alterna-
tives. To apply AHP in prioritizing indicators of tour
guides’ service quality in this stud y, all indicato r s hav e to
be structured into different hierarchical levels. This study
shows the three-level hierarchy for indicators based on
the hierarchical structures of AHP.
3. Basic Concept of AHP
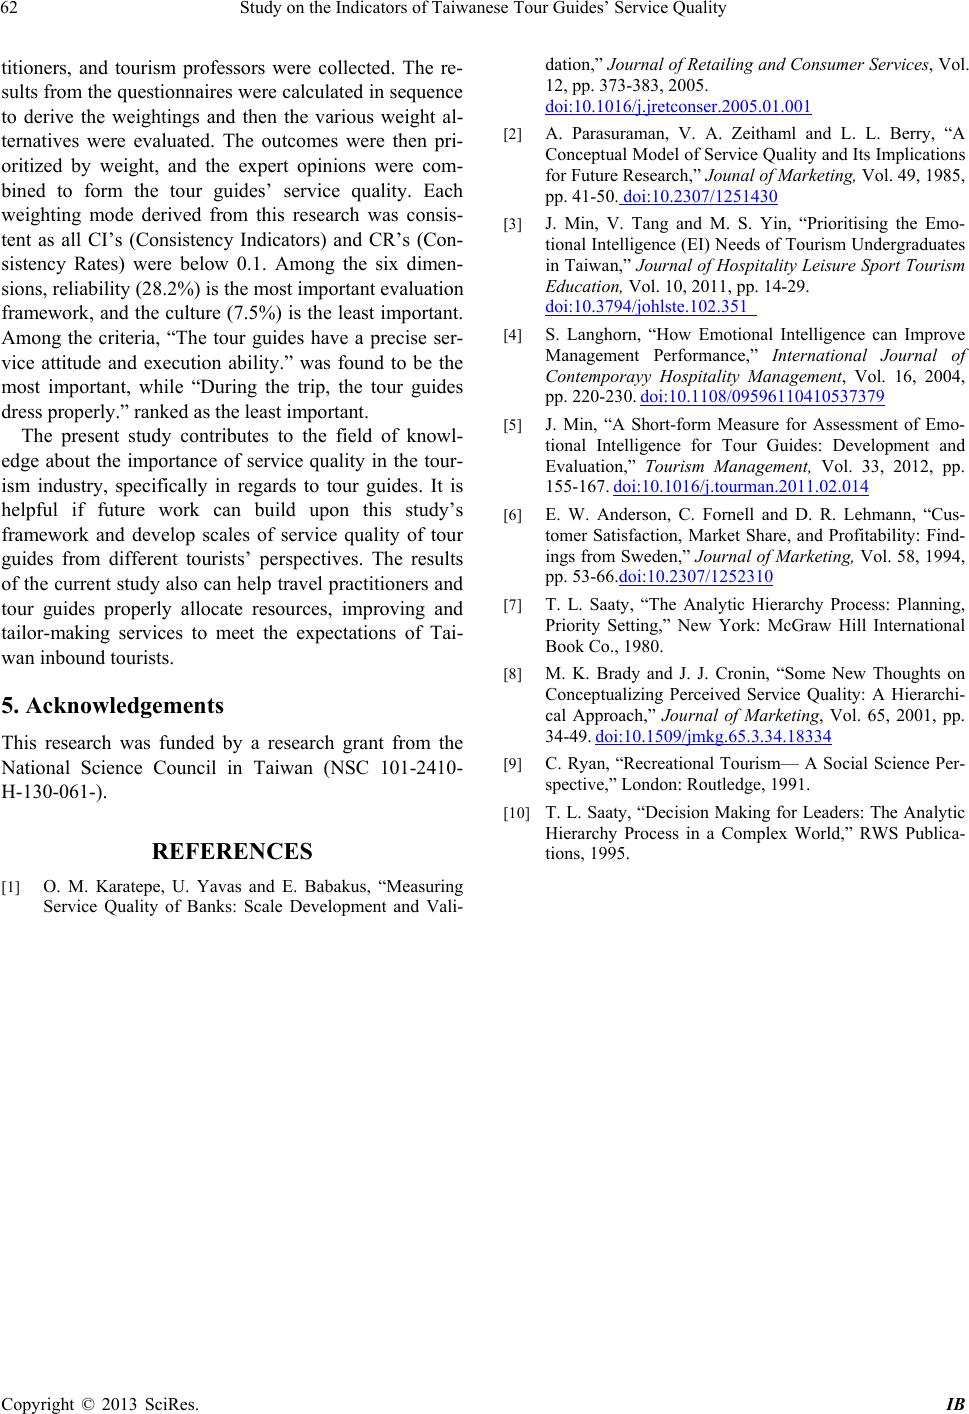
3.1. Hierarchical Structures
Suppose there is a hierarchical structure showed in Fig-
ure 1. Nodes in the hierarchy represent criteria, sub-cri-
teria, or alternatives to be prioritized, and arcs reflect
relationships between the nodes in different levels. Each
relationship (arc) represents a relative weight or impor-
tance of a node at Level L relating to a node at Level L-1,
where L = 2, 3, …, N-1, N. The nodes at Level L do not
necessarily connect to all the nodes at Level L-1, where
L = 2, 3, …, N-1, N.
The computation of weights is performed in the fol-
lowing way. Suppose there is a set of n criteria
nLLL ,2,1, located at a hierarchical Level L.
Assuming that all the criteria at Level L are comparable
with each other, n (n-1)/2 paired comparisons of the n
criteria at Level L are performed. For each pair of com-
parisons, a decision maker (individual or group) uses the
nine-point scale to reflect the degree of preference. The
final AHP result is an assignment of weights to the crite-
ria or alternatives at the lowest Level N.
cccC ,,,
For the research, the word “criteria” may represent any
one of three conceptual levels: identified usability di-
mensions, sub-dimensions, and individual questionnaire
items. For example, in the lowest level (Level N), criteria
can represent the set of individual questionnaire items,
and criteria can represent the set of sub-dimensions in the
Level N-1. The top level node represents construct of
overall usability which should ultimately be measured
3.2. Pairwise Comparison
In terms of the scales for quantifying pairwise compare-
sons, several approaches are available; although Saaty’s
[10] linear scale was the first proposed and has been used
pervasively. Based on the fact that most humans cannot
simultaneously compare more than seven objects (plus or
minus two), Saaty [10] established 9 as the upper limit of
the scale and 1 as the lower limit.
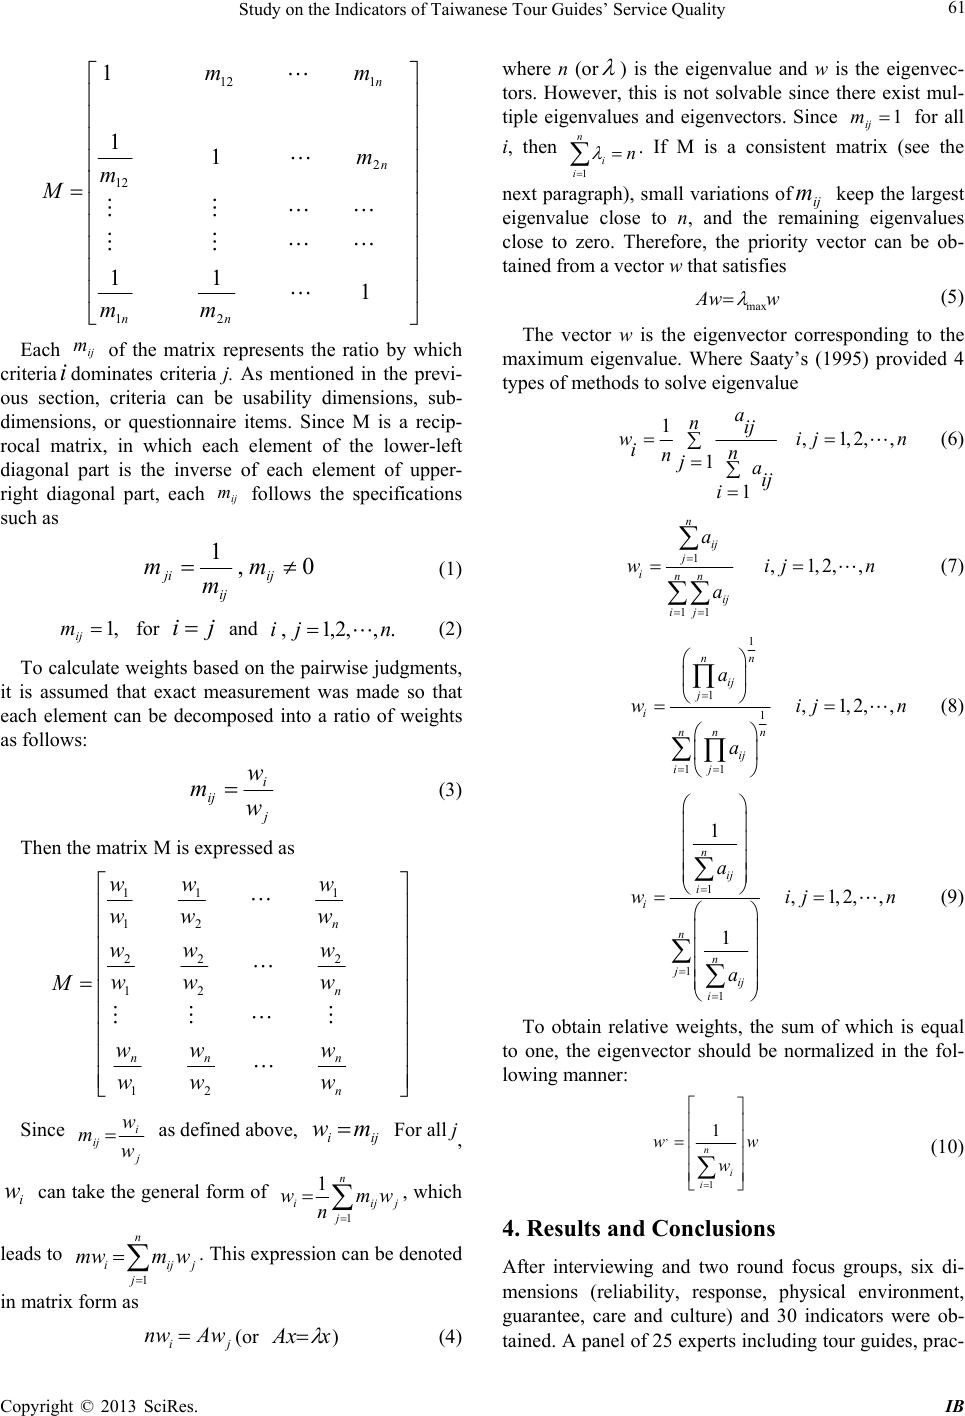
3.3. AHP Data Analysis Procedure
Using any of the scales the preference or dominance
measures of paired comparisons are placed in a matrix
form in the following manner:
Figure 1. AHP structure.
Copyright © 2013 SciRes. IB
Study on the Indicators of Taiwanese Tour Guides’ Service Quality 61
1
11
1
1
1
21
2
12
112


nn
n
n
mm
m
m
mm
M
Each of the matrix represents the ratio by which
criteriaidominates criteria j. As mentioned in the previ-
ous section, criteria can be usability dimensions, sub-
dimensions, or questionnaire items. Since M is a recip-
rocal matrix, in which each element of the lower-left
diagonal part is the inverse of each element of upper-
right diagonal part, each follows the specifications
such as
ij
m
ij
m
0,
1 ij
ij
ji m
m
m (1)
,1
ij
m for
j
i and (2)
.,,2,1, nji
To calculate weights based on the pairwise judgments,
it is assumed that exact measurement was made so that
each element can be decomposed into a ratio of weights
as follows:
j
i
ij w
w
m (3)
Then the matri x M is expressed as
n
nnn
n
n
w
w
w
w
w
w
w
w
w
w
w
w
w
w
w
w
w
w
M

21
2
2
2
1
2
1
2
1
1
1
Since
j
i
ij w
w
m
as defined above, For all j,
can take the general form of
iji mw
i
wj
n
jiji wm
n
w
1
1, which
leads to . This expression can be denoted
in matrix form as
j
n
jiji wmmw
1
ji Awnw(or xAx
) (4)
where n (or
) is the eigenvalue and w is the eigenvec-
tors. However, this is not solvable since there exist mul-
tiple eigenvalues and eigenvectors. Since 1
ij
m for all
i, then . If M is a consistent matrix (see the
n
n
ii
1
next paragraph), small variations ofij keep the largest
eigenvalue close to n, and the remaining eigenvalues
close to zero. Therefore, the priority vector can be ob-
tained from a vector w that satisfies
m
wAw max
(5)
The vector w is the eigenvector corresponding to the
maximum eigenvalue. Where Saaty’s (1995) provided 4
types of methods to solve eigenvalue
1,1,2,,
1
1
a
nij
wij
in
njaij
i

n
(6)
1
11
,1,2,,
n
ij
j
inn
ij
ij
a
wij
a



n
(7)
1
1
1
11
,1,2,,
n
n
ij
j
i
n
n
n
ij
ij
a
wij
a







n
(8)
1
1
1
1
,1,2,,
1
n
ij
i
i
n
n
jij
i
a
wij
a













n
(9)
To obtain relative weights, the sum of which is equal
to one, the eigenvector should be normalized in the fol-
lowing manner:
w
w
wn
ii
1
,1 (10)
4. Results and Conclusions
After interviewing and two round focus groups, six di-
mensions (reliability, response, physical environment,
guarantee, care and culture) and 30 indicators were ob-
tained. A panel of 25 experts including tour guides, prac-
Copyright © 2013 SciRes. IB
Study on the Indicators of Taiwanese Tour Guides’ Service Quality
Copyright © 2013 SciRes. IB
62
titioners, and tourism professors were collected. The re-
sults from the questionnaires were calculated in sequence
to derive the weightings and then the various weight al-
ternatives were evaluated. The outcomes were then pri-
oritized by weight, and the expert opinions were com-
bined to form the tour guides’ service quality. Each
weighting mode derived from this research was consis-
tent as all CI’s (Consistency Indicators) and CR’s (Con-
sistency Rates) were below 0.1. Among the six dimen-
sions, reliability (28.2%) is the most important evaluation
framework, and the culture (7.5 %) is the least important.
Among the criteria, “The tour guides have a precise ser-
vice attitude and execution ability.” was found to be the
most important, while “During the trip, the tour guides
dress properly.” ranked as the least important.
The present study contributes to the field of knowl-
edge about the importance of service quality in the tour-
ism industry, specifically in regards to tour guides. It is
helpful if future work can build upon this study’s
framework and develop scales of service quality of tour
guides from different tourists’ perspectives. The results
of the current stud y also can help travel practitioners and
tour guides properly allocate resources, improving and
tailor-making services to meet the expectations of Tai-
wan inbound tourists.
5. Acknowledgements
This research was funded by a research grant from the
National Science Council in Taiwan (NSC 101-2410-
H-130-061-).
REFERENCES
[1] O. M. Karatepe, U. Yavas and E. Babakus, “Measuring
Service Quality of Banks: Scale Development and Vali-
dation,” Journal of Retailing and Consumer Services, Vol.
12, pp. 373-383, 2005.
doi:10.1016/j.jretconser.2005.01.001
[2] A. Parasuraman, V. A. Zeithaml and L. L. Berry, “A
Conceptual Model of Service Quality and Its Implications
for Future Research,” Jounal of Marketing, Vol. 49, 1985,
pp. 41-50. doi:10.2307/1251430
[3] J. Min, V. Tang and M. S. Yin, “Prioritising the Emo-
tional Intelligence (EI) Needs of Tourism Undergraduates
in Taiwan,” Journal of Hospitality Leisure Sport Tourism
Education, Vol. 10, 2011, pp. 14-29.
doi:10.3794/johlste.102.351
[4] S. Langhorn, “How Emotional Intelligence can Improve
Management Performance,” International Journal of
Contemporayy Hospitality Management, Vol. 16, 2004,
pp. 220-230. doi:10.1108/09596110410537379
[5] J. Min, “A Short-form Measure for Assessment of Emo-
tional Intelligence for Tour Guides: Development and
Evaluation,” Tourism Management, Vol. 33, 2012, pp.
155-167. doi:10.1016/j.tourman.2011.02.014
[6] E. W. Anderson, C. Fornell and D. R. Lehmann, “Cus-
tomer Satisfaction, Market Share, and Profitability: Find-
ings from Sweden,” Journal of Marketing, Vol. 58, 1994,
pp. 53-66.doi:10.2307/1252310
[7] T. L. Saaty, “The Analytic Hierarchy Process: Planning,
Priority Setting,” New York: McGraw Hill International
Book Co., 1980.
[8] M. K. Brady and J. J. Cronin, “Some New Thoughts on
Conceptualizing Perceived Service Quality: A Hierarchi-
cal Approach,” Journal of Marketing, Vol. 65, 2001, pp.
34-49. doi:10.1509/jmkg.65.3.34.18334
[9] C. Ryan, “Recreational Tourism— A Social Science Per-
spective,” London: Routledge, 1991.
[10] T. L. Saaty, “Decision Making for Leaders: The Analytic
Hierarchy Process in a Complex World,” RWS Publica-
tions, 1995.