iBusiness, 2013, 5, 21-25
http: //dx.doi.org/10.4236/ib.2013.53B005 Published Online September 2013 (http://www.scirp.org/journal/ib)
21
Valuation Channel and Losses of Chinese External Wealth
Zefa ng Liao1,2, Jianpeng Zhang1, Bing Li1,3
1Financial Research Center Fudan University, Shanghai, China; 2Guangdong Ocean University, Zhanjiang Guangdong, 3China;
School of Economics and Business Administration, Shanxi University, China.
Received May, 2013
ABSTRACT
Based on the intertemporal theoretical framework of Gourinchas and Rey ( 2005), using Vector Error Correction Model
and time-varying Space State Model, the paper estimates the return and factors of China’s net foreign assets. The results
show that significant negative valuation effects in the change of net foreign assets and its sub-category, “risk assets”,
especially at short and medium horizons. The fluctuation of assets prices arising from international financial crisis and
appreciation of RMB contribute to the losses of external wealth, implying much wealth outflow to other economies.
Keywords: Capital Flows; Net Foreign Assets; Valuation Effects
1. Introduction
The rapid growth in cross-border financial trade has been
one of the salient economic developments over the last
two decades. And new questions arise from this. First,
the fact is that capital tends to flow uphill—from poor to
rich countries rather than the other way round, a phe-
nomenon known in the literature as the “Lucas Paradox”.
[1] Second, it is increasingly well appreciated that capital
gains and losses on existing holdings of foreign assets
and liabilities can be important in determining the dy-
namics of the net foreign assets position, so much wealth
are transferred across different economies.
The recent experience of some countries provides il-
lustrations of capital gains and losses on cross-border
flows. For example, cumulative debt inflows in Argen-
tina measured US7.9bn between 1977 and 1981,While
the debt stock(net of the effect of currency fluctuations)
increased by US24.8bn, a difference of over 20% of
Argentina’s 1981 GDP. [2] More recently, During 2002-
2007, despite average current account deficit of over 5%
of GDP, the U.S. net international investment position
(IIP)--which measures the difference between U.S. ex-
ternal assets and liabilities—has remained broadly un-
changed.1[3]
What explains these remarkable differences? Based on
the measure of external wealth (Lane and Milesi-Ferretti,
2001), Some recent strand of the literature emphasizes
the role of valuation effects in the process of external
wealth (Gourinchas and Rey, 2005, 2007a; Lane and
Milesi-Ferretti,2005, 2007; Obstfeld,2004).[4]
Under the current international monetary system,
valuation effects play different roles across countries in
international financial markets. In developed countries,
where foreign assets tend to be denominated in foreign
currency and liabilities in domestic currency, thus valua-
tion effects arising from unexpected depreciation of do-
mestic currency would increase the domestic currency
value of foreign assets and with the value of liabilities
unchanged-net foreign assets improve exhibiting positive
valuation effects. For example, during U.S. current ac-
count correction of 1985-1988, the U.S. dollar depreci-
ated by about 30% in real effective terms. More recently,
the valuation adjustments associated with the U.S. dollar
depreciation during 2002-2004 have offset about three-
fourths of the cumulative U.S. current account deficit
over the same period. [5] Over a longer horizon, the sta-
bilizing valuation effects contribute as much as 31% of
U.S. external imbalance adjustment during 1980-2003
(Gourinchas and Rey, IMF, 2005). [6] With large gross
asset and liability positions, a change in the dollar ex-
change rate can transfer large amount of wealth across
countries. As documented by Gourinchas and Rey
(2007a) and Lane and Milesi-Ferretti (2007b), these
capital gains imply that the return earned by U.S. resi-
dents on their external assets is signicantly higher than
the return earned by foreign residents on U.S. assets. [7,8]
The similar cases occurred in U.K. and Canada, positive
valuation effect accounted for about 20% the change of
Canada’s net international position to GDP in 2004, and
valuation represented about 50% of U.K.’s GDP in 2000,
even exceeding the impact of current account on interna-
tional position (Gourinchas and Rey, IMF, 2005). Cur-
rency depreciation in these countries where external
1Net external liabilities measured with FDI at current cost are un-
changed as a ratio of GDP between 2001and 2007, while net liabilities
measured at market value have actually in absolutes terms.
Copyright © 2013 SciRes. IB
Valuation Channel and Losses of Chinese External Wealth
22
wealth have been to improve—that is equivalent to a
wealth transfer from other countries [6].
Whereas in emerging market and developing countries,
where most foreign assets and liabilities tend to be de-
nominated in foreign currency, valuation effects arising
from unexpected exchange rate appreciation are likely to
deteriorate their international position—most are negative
valuation shocks because of currency mismatch. For
example, during1992-2001, current account surplus to
GDP accounted for 32.9% and 11.9% of Indonesia and
Thailand respectively, but the losses to net international
position from valuation represented 39% and 21.9% of
their own GDP over the same period [9].
According to measurement on Net Foreign Asset (NFA)
of Lane and Milesi-Ferretti (2001), China had turned into
the holder of NFA since in the early 1990s, and now it is
one of the biggest global creditor. But due to unrealized
RMB internationalization, China is still an immature
creditor country,2 whose external wealth is facing with risk
of large losses, especially in the expectation of RMB
revaluation and fluctuation of international financial as-
set prices. How about the gain or losses on China’s ex-
ternal wealth? The paper will focuses on this question.
In this paper, my methodology builds on the working
paper of Gourinchas and Rey(2005)in NBER, aiming to
investigate the relation among net external wealth, export
and import, and the real exchange rate of China, making
use of a new data set on external assets and liabilities
constructed by Lane and Milesi-Ferretti (2001) [2].
The remainder of the paper is structured as follows. In
section 2 I provide the theoretical framework that used
for empirical investigation of the mechanisms of valua-
tion effect on net external wealth. I explore the construc-
tion of annual and quarterly dataset of China’s net for-
eign assets and its sub-category, “risk assets” position at
statistical values in section 3. Empirical results are pre-
sented in the section 4. First, we estimates valuation ef-
fect to annual external wealth of China, then the “risk
assets” are evaluated in the model. Section 5 concludes.
2. Theoretical Framework and Implication
According to the dynamic model of net foreign asset of
Gourinchas-Rey (2005) and Lane, P., Milesi-Ferretti
(2007), [5, 8] this section lays down an intertemporal ap-
proach to the cumulative net foreign net (external wealth):
an intertemporal budget constraint and a long-run stabil-
ity condition.
Account for the dynamic accumulation equation be-
tween t and t + 1:

11
1
()
()()
;
ttt t
ttt tt
tttttt
NFARNFA NX
RALXM
NFAAL NXXM


 
(1)
t and represent net foreign assets and their
gains, and t are defined as the difference between
gross foreign assets t
NFA t
R
ANF
A
and gross foreign liabilities t,
net exports t are defined as the difference between
the volumes of exports t
L
NX
X
and imports t
M
of goods
and services, measured in U.S. dollar.3 Divide through
GDP, identity (1) transform to:
11
1
1
()(
tt
tt
ttt t
t
tt tt
NFA GDP
GDP GDP
AL XM
RGDP GDPGDPGDP

)

(2)
To discuss further the implication of equation (2) and
log-linearize. The log-linearization requires the following
assumptions:
i) R and Ratios 1
1
t
t
NFA
GDP
, 1t
t
GDP
GDP
, t
t
A
GDP , t
t
L
GDP ,
t
t
X
GDP , t
t
GDP are stationary. ii) 1t
t
GDP
GDP
= g, and R >
g, 1
g
R
, t
t
NX
NFA satisfies: 10
t
t
NX
NFA
.
Following the methodology of Corsetti and Konstan-
tinou(2004) and Gourinchas and Rey2005, [5,6]it is
possible to derive the following log-linear approximation
of equation(1):

1
(1)
(1)
tt t
i
ti titi
i
xm nfa
x
mr





(3)
Where lowercase letters denote logarithms.4
Equations (3) play a central role in my analysis. Un-
der the assumptions that t, t
r
x
and t are station-
ary, expression (3) implies that x, m and nfa should be
cointegrated, and the left-hand side (the cointegration
residual) represents deviations from the long-run rela-
tionship among three variable. Expression (3) also im-
plies that if the cointegrating residual is not a constant, it
has to predict either changes in the future net exports or
in net foreign returns or both. For example, if a country
develops a large trade surplus relative to what is consis-
tent with its steady-state net foreign assets position, the
deviation from the long-run relationship has to be ad-
justed either by decrease in future net exports or by fu-
m
3Accumulation equation (1) implies that NFAt are measured at the
beginning of the period. One could instead define NFA't as the stock o
f
net foreign assets at the end of period t-1, so NFAt = RtNFA't. The dy-
namic accumulation equation becomes: NFA't+1 = RtNFA't + NXt.
4In expression(4), γ and ρ are constants related to the log-linearization
of the country’s intertemporal budget constraint(see Corsetti and Kon-
stantinou, 2004).
2Ronald Mckinnon(2009) called those countries who can’t provide
finance to other economies with their own currencies as immature
countries.
Copyright © 2013 SciRes. IB
Valuation Channel and Losses of Chinese External Wealth 23
ture losses on the stock of its foreign assets and liabilities,
or a combination of the two. The latter are valuation ef-
fects. If valuation of some economy’s NFA is positive,
implying a wealth transfer from other countries through
international financial channel, which makes net foreign
asset increased or net foreign liability decreased. On the
contrary, if valuation of some economy’s NFA is negative,
implying a wealth outflow to other countries through
international financial markets, which makes net foreign
asset decreased or net foreign liability increased. Con-
sider the case of the China with both a large trade surplus
and positive net foreign assets, negative valuation of net
foreign assets implying vast losses of external wealth.
3. International Assets Position
In this section, I describe briery the construction of my
dataset. All data are available from IMF’s International
Financial Statistics. Export and import is flowing asset,
net foreign asset and “risk assets” are cumulative assets.
These assets are measured in USmillion. Use nominal
effective exchange rate (2005=100) as RMB exchange
rate. Select annual data for the period 1991-2010, quar-
terly data for the period 1981Q1-2010Q4 as sample, take
1981 (or 1981 Q1) as initial period of cumulative assets.
Following official classifications, I split China’s net
foreign asset into four categories: Foreign Direct Invest-
ment (FDI), Portfolio Investment Assets (Equity Securi-
ties and Debt Securities), Other Investment Assets and
Reserve Assets (including gold reserves). “Risk assets”
calculated as cumulative Other Investment Assets and
Reserve Assets.
Denote by t
X
the end of period t position for some
asset X. Use the following updating equation:
1tttt
X
XFXDX

 (4)
where t
F
X denotes the ows corresponding to asset X
that enter the balance of payments, and t denotes a
discrepancy reecting a market valuation adjustment or
(less often) a change of coverage in the series between
periods t1and t.
DX
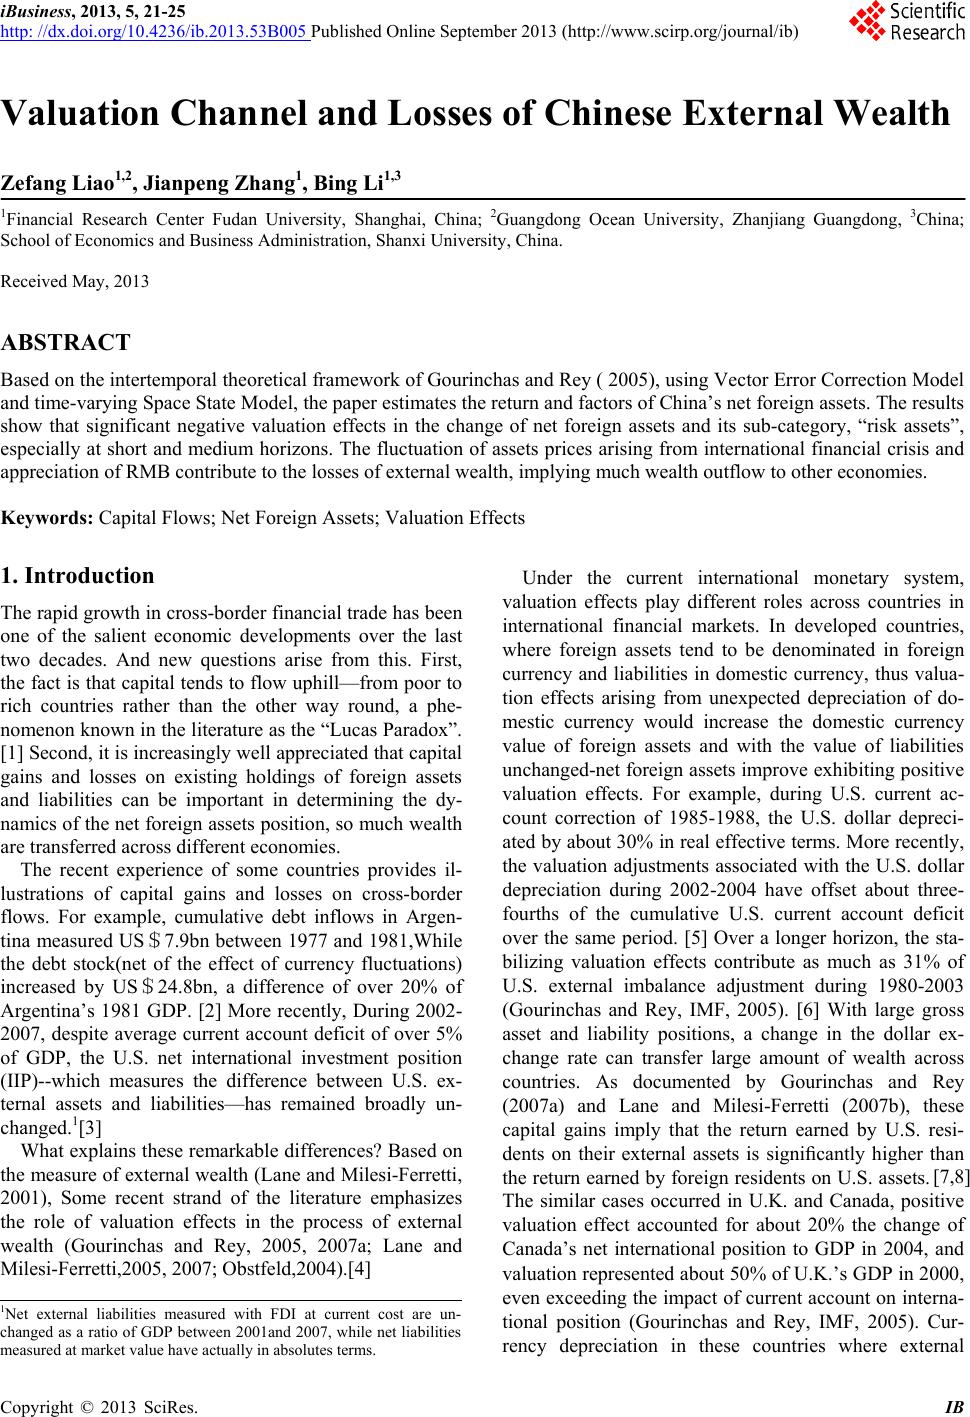
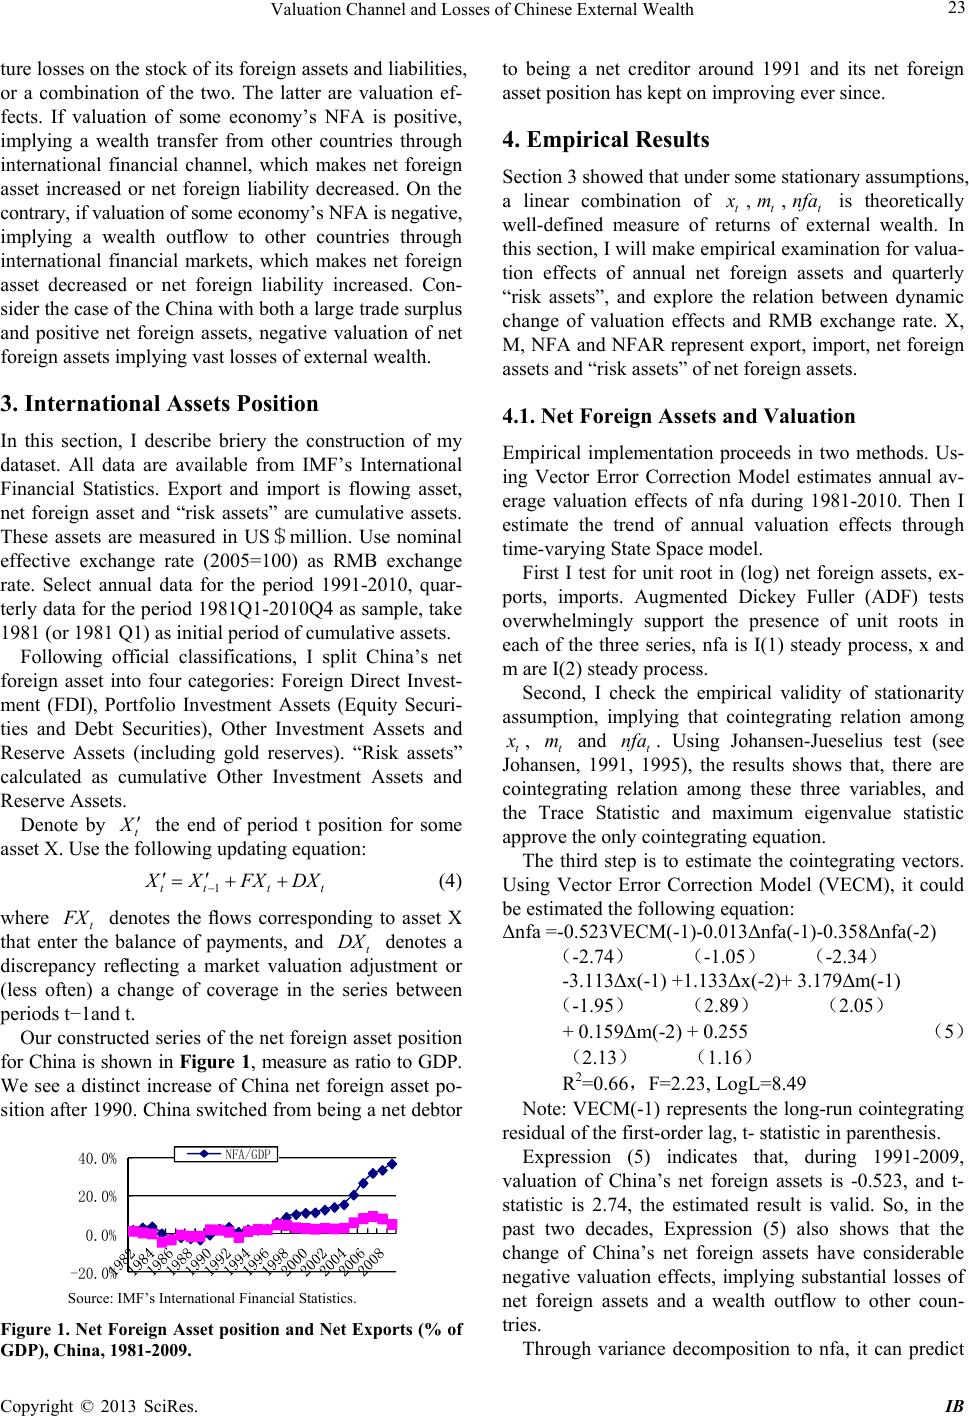
Our constructed series of the net foreign asset position
for China is shown in Figure 1, measure as ratio to GDP.
We see a distinct increase of China net foreign asset po-
sition after 1990. China switched from being a net debtor
-20.0%
0.0%
20.0%
40.0%
NFA
/
GDP
Source: IMF’s International Financial Statistics.
Figure 1. Net Foreign Asset position and Net Exports (% of
GDP), China, 1981-2009.
to being a net creditor around 1991 and its net foreign
asset position has kept on improving ever since.
4. Empirical Results
Section 3 showed that under some stationary assumptions,
a linear combination of t
x
,t,t is theoretically
well-defined measure of returns of external wealth. In
this section, I will make empirical examination for valua-
tion effects of annual net foreign assets and quarterly
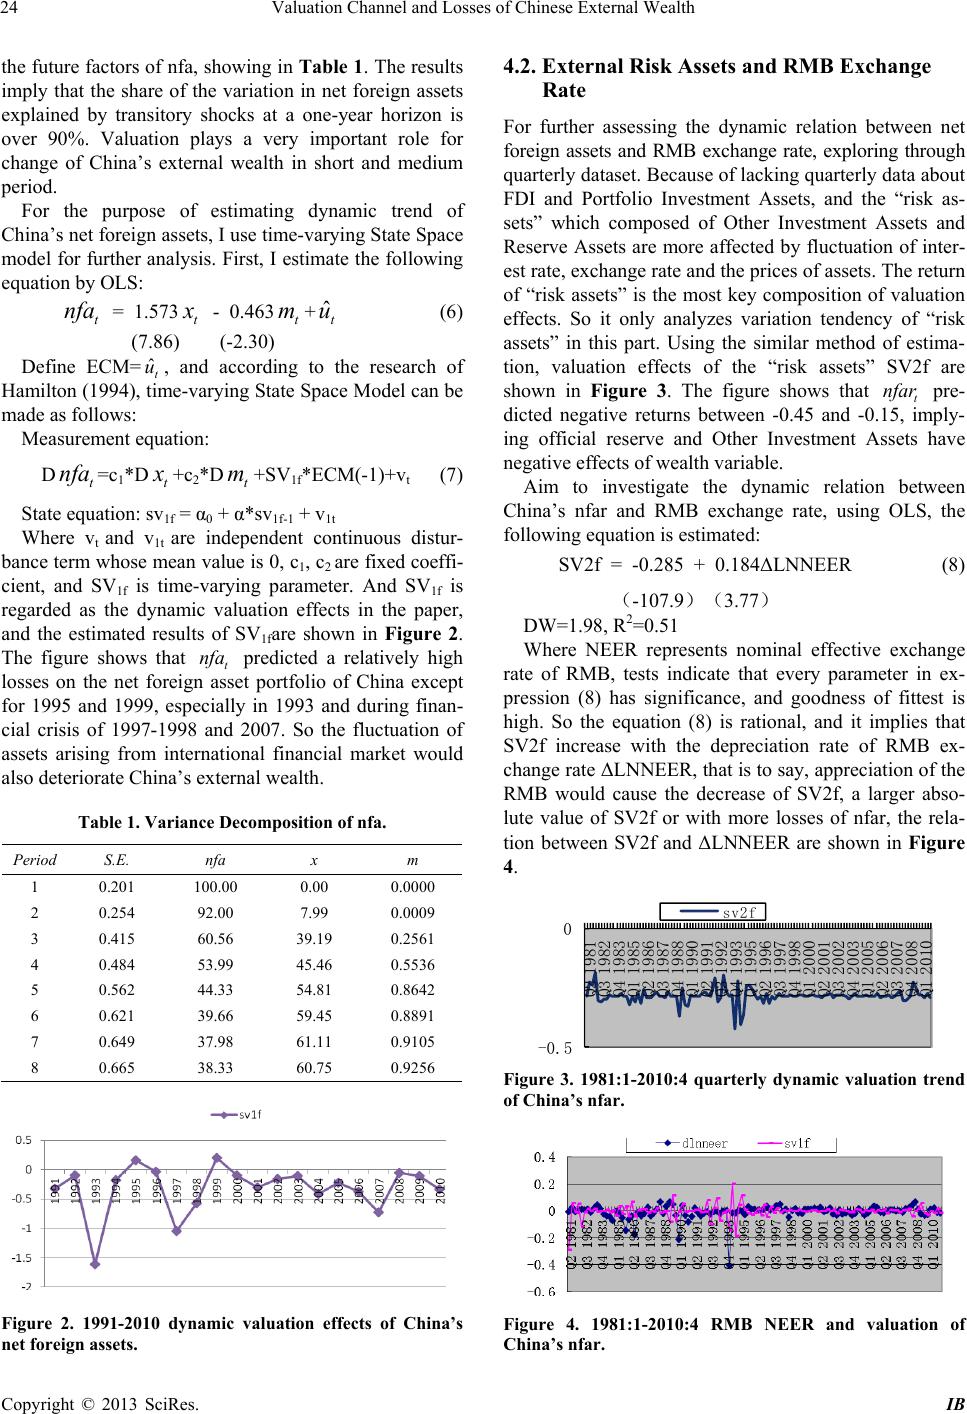
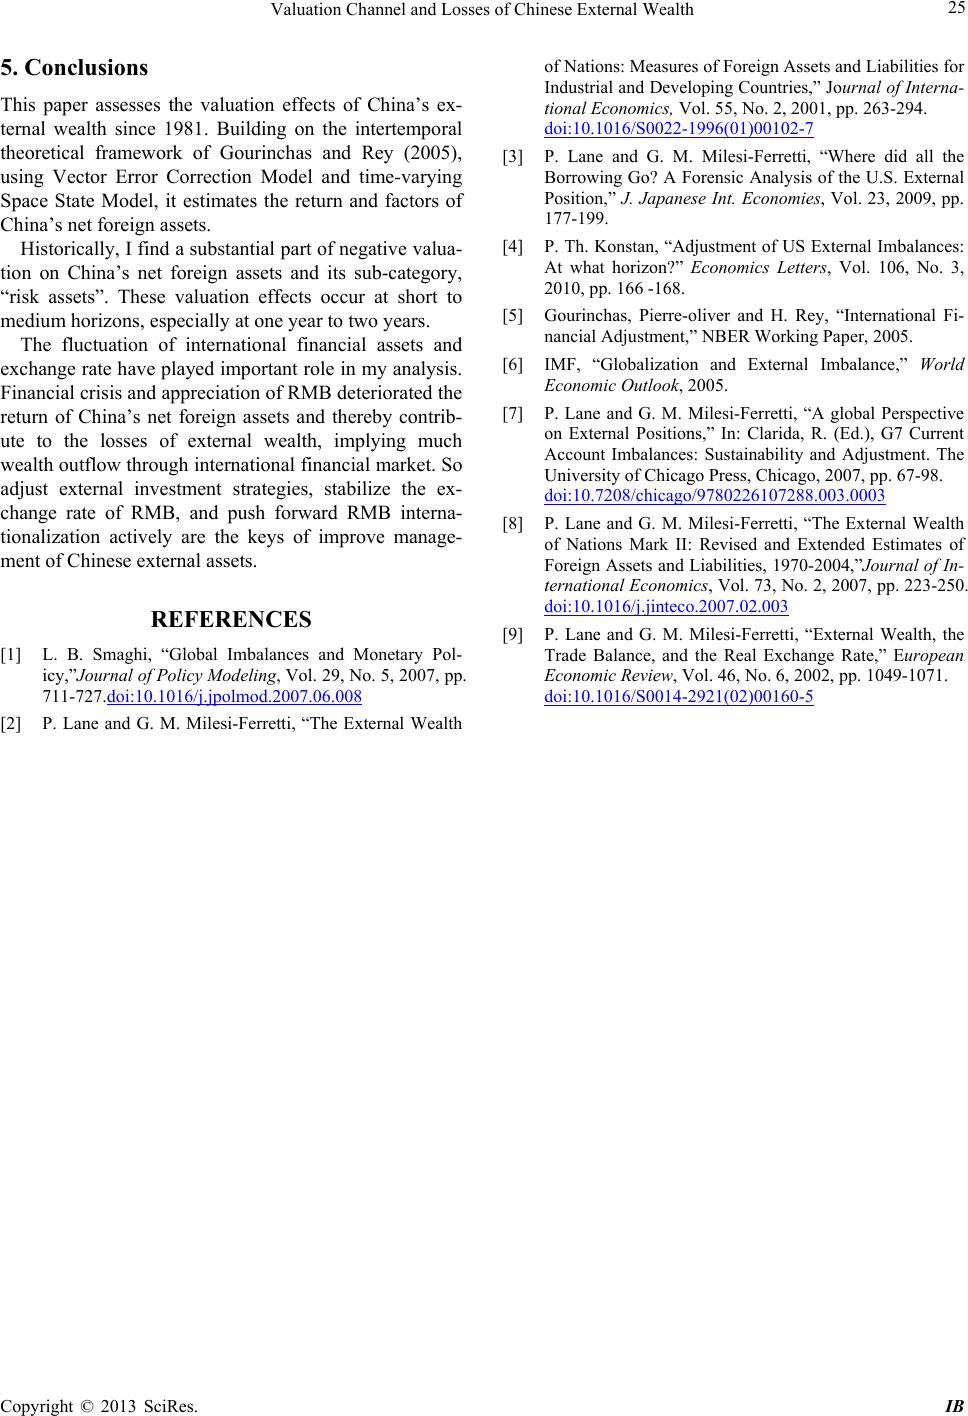
“risk assets”, and explore the relation between dynamic
change of valuation effects and RMB exchange rate. X,
M, NFA and NFAR represent export, import, net foreign
assets and “risk assets” of net foreign assets.
mnfa
4.1. Net Foreign Assets and Valuation
Empirical implementation proceeds in two methods. Us-
ing Vector Error Correction Model estimates annual av-
erage valuation effects of nfa during 1981-2010. Then I
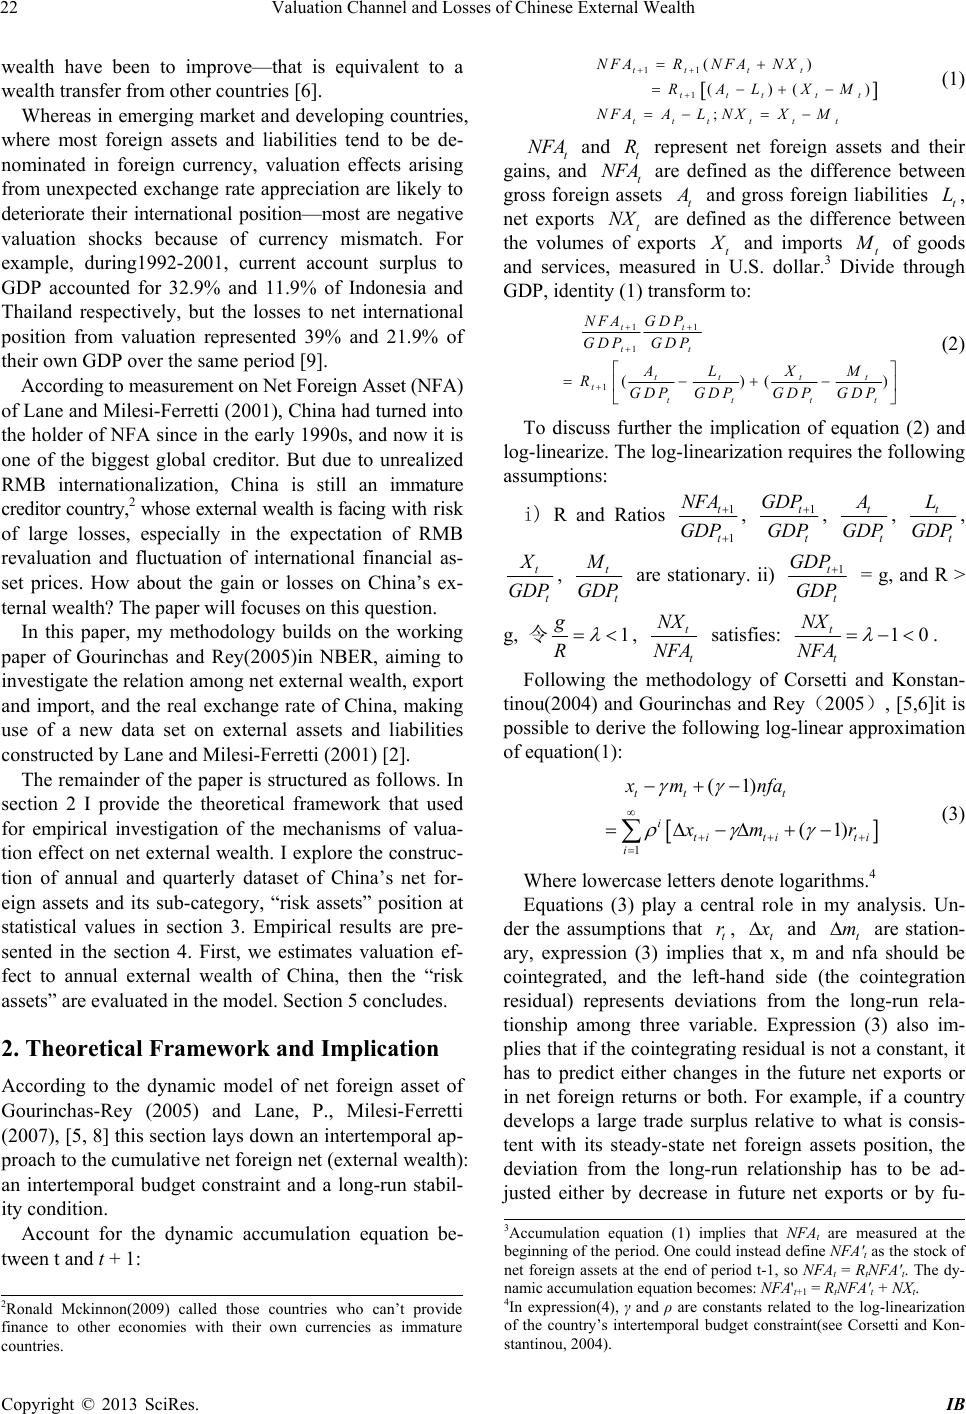
estimate the trend of annual valuation effects through
time-varying State Space model.
First I test for unit root in (log) net foreign assets, ex-
ports, imports. Augmented Dickey Fuller (ADF) tests
overwhelmingly support the presence of unit roots in
each of the three series, nfa is I(1) steady process, x and
m are I(2) steady process.
Second, I check the empirical validity of stationarity
assumption, implying that cointegrating relation among
t
x
, t and t. Using Johansen-Jueselius test (see
Johansen, 1991, 1995), the results shows that, there are
cointegrating relation among these three variables, and
the Trace Statistic and maximum eigenvalue statistic
approve the only cointegrating equation.
mnfa
The third step is to estimate the cointegrating vectors.
Using Vector Error Correction Model (VECM), it could
be estimated the following equation:
Δnfa =-0.523VECM(-1)-0.013Δnfa(-1)-0 .358Δnfa(-2)
-2.74 -1.05 -2.34
-3.113Δx(-1) +1.133Δx(-2)+ 3.179Δm(-1)
-1.95 2.89 2.05
+ 0.159Δm(-2) + 0.255 5
2.13 1.16
R2=0.66F=2.23, LogL=8.49
Note: VECM(-1) represents the long-run cointegrating
residual of the first-order lag, t- statistic in parenthesis.
Expression (5) indicates that, during 1991-2009,
valuation of China’s net foreign assets is -0.523, and t-
statistic is 2.74, the estimated result is valid. So, in the
past two decades, Expression (5) also shows that the
change of China’s net foreign assets have considerable
negative valuation effects, implying substantial losses of
net foreign assets and a wealth outflow to other coun-
tries.
Through variance decomposition to nfa, it can predict
Copyright © 2013 SciRes. IB
Valuation Channel and Losses of Chinese External Wealth
24
the future factors of nfa, showing in Tab le 1. The results
imply that the share of the variation in net foreign assets
explained by transitory shocks at a one-year horizon is
over 90%. Valuation plays a very important role for
change of China’s external wealth in short and medium
period.
For the purpose of estimating dynamic trend of
China’s net foreign assets, I use time-varying State Space
model for further analysis. First, I estimate the following
equation by OLS:
t
nfa = 1.573t
x
- 0.463+ (6)
t
mˆt
u
(7.86) (-2.30)
Define ECM=, and according to the research of
Hamilton (1994), time-varying State Space Model can be
made as follows:
ˆt
u
Measurement equation:
D=c1*D
t
nfa t
x
+c2*D +SV1f*ECM(-1 )+vt (7)
t
m
State equation: sv1f = α0 + α*sv1f-1 + v1t
Where vt and v1t are independent continuous distur-
bance term whose mean value is 0, c1, c2 are fixed coeffi-
cient, and SV1f is time-varying parameter. And SV1f is
regarded as the dynamic valuation effects in the paper,
and the estimated results of SV1fare shown in Figure 2.
The figure shows that t predicted a relatively high
losses on the net foreign asset portfolio of China except
for 1995 and 1999, especially in 1993 and during finan-
cial crisis of 1997-1998 and 2007. So the fluctuation of
assets arising from international financial market would
also deteriorate China’s external wealth.
nfa
Table 1. Variance Decomposition of nfa.
Period S.E. nfa x m
1 0.201 100.00 0.00 0.0000
2 0.254 92.00 7.99 0.0009
3 0.415 60.56 39.19 0.2561
4 0.484 53.99 45.46 0.5536
5 0.562 44.33 54.81 0.8642
6 0.621 39.66 59.45 0.8891
7 0.649 37.98 61.11 0.9105
8 0.665 38.33 60.75 0.9256
Figure 2. 1991-2010 dynamic valuation effects of China’s
net foreign assets.
4.2. External Risk Assets and RMB Exchange
Rate
For further assessing the dynamic relation between net
foreign assets and RMB exchange rate, exploring through
quarterly dataset. Because of lacking quarterly data about
FDI and Portfolio Investment Assets, and the “risk as-
sets” which composed of Other Investment Assets and
Reserve Assets are more affected by fluctuation of inter-
est rate, exchange rate and the prices of assets. The return
of “risk assets” is the most key composition of valuation
effects. So it only analyzes variation tendency of “risk
assets” in this part. Using the similar method of estima-
tion, valuation effects of the “risk assets” SV2f are
shown in Figure 3. The figure shows that t pre-
dicted negative returns between -0.45 and -0.15, imply-
ing official reserve and Other Investment Assets have
negative effects of wealth variable.
nfar
Aim to investigate the dynamic relation between
China’s nfar and RMB exchange rate, using OLS, the
following equation is estimated:
SV2f = -0.285 + 0.184ΔLNNEER (8)
-107.9)(3.77
DW=1.98, R2=0.51
Where NEER represents nominal effective exchange
rate of RMB, tests indicate that every parameter in ex-
pression (8) has significance, and goodness of fittest is
high. So the equation (8) is rational, and it implies that
SV2f increase with the depreciation rate of RMB ex-
change rate ΔLNNEER, that is to say, appreciation of the
RMB would cause the decrease of SV2f, a larger abso-
lute value of SV2f or with more losses of nfar, the rela-
tion between SV2f and ΔLNNEER are shown in Figure
4.
-0.5
0
Q2 1981
Q3 1982
Q4 1983
Q1 1985
Q2 1986
Q3 1987
Q4 1988
Q1 1990
Q2 1991
Q3 1992
Q4 1993
Q1 1995
Q2 1996
Q3 1997
Q4 1998
Q1 2000
Q2 2001
Q3 2002
Q4 2003
Q1 2005
Q2 2006
Q3 2007
Q4 2008
Q1 2010
sv2f
Figure 3. 1981:1-2010:4 quarterly dynamic valuation trend
of China’s nfar.
Figure 4. 1981:1-2010:4 RMB NEER and valuation of
China’s nfar.
Copyright © 2013 SciRes. IB
Valuation Channel and Losses of Chinese External Wealth
Copyright © 2013 SciRes. IB
25
5. Conclusions
This paper assesses the valuation effects of China’s ex-
ternal wealth since 1981. Building on the intertemporal
theoretical framework of Gourinchas and Rey (2005),
using Vector Error Correction Model and time-varying
Space State Model, it estimates the return and factors of
China’s net foreign assets.
Historically, I find a substantial part of negative valua-
tion on China’s net foreign assets and its sub-category,
“risk assets”. These valuation effects occur at short to
medium horizons, especially at one year to two years.
The fluctuation of international financial assets and
exchange rate have played important role in my analysis.
Financial crisis and appreciation of RMB deteriorated the
return of China’s net foreign assets and thereby contrib-
ute to the losses of external wealth, implying much
wealth outflow through international financial market. So
adjust external investment strategies, stabilize the ex-
change rate of RMB, and push forward RMB interna-
tionalization actively are the keys of improve manage-
ment of Chinese external assets.
REFERENCES
[1] L. B. Smaghi, “Global Imbalances and Monetary Pol-
icy,”Journal of Policy Modeling, Vol. 29, No. 5, 2007, pp.
711-727.doi:10.1016/j.jpolmod.2007.06.008
[2] P. Lane and G. M. Milesi-Ferretti, “The External Wealth
of Nations: Measures of Foreign Assets and Liabilities for
Industrial and Developing Countries,” Journal of Interna-
tional Economics, Vol. 55, No. 2, 2001, pp. 263-294.
doi:10.1016/S0022-1996(01)00102-7
[3] P. Lane and G. M. Milesi-Ferretti, “Where did all the
Borrowing Go? A Forensic Analysis of the U.S. External
Position,” J. Japanese Int. Economies, Vol. 23, 2009, pp.
177-199.
[4] P. Th. Konstan, “Adjustment of US External Imbalances:
At what horizon?” Economics Letters, Vol. 106, No. 3,
2010, pp. 166 -168.
[5] Gourinchas, Pierre-oliver and H. Rey, “International Fi-
nancial Adjustment,” NBER Working Paper, 2005.
[6] IMF, “Globalization and External Imbalance,” World
Economic Outlook, 2005.
[7] P. Lane and G. M. Milesi-Ferretti, “A global Perspective
on External Positions,” In: Clarida, R. (Ed.), G7 Current
Account Imbalances: Sustainability and Adjustment. The
University of Chicago Press, Chicago, 2007, pp. 67-98.
doi:10.7208/chicago/9780226107288.003.0003
[8] P. Lane and G. M. Milesi-Ferretti, “The External Wealth
of Nations Mark II: Revised and Extended Estimates of
Foreign Assets and Liabilities, 1970-2004,”Journal of In-
ternational Economics, Vol. 73, No. 2, 2007, pp. 223-250.
doi:10.1016/j.jinteco.2007.02.003
[9] P. Lane and G. M. Milesi-Ferretti, “External Wealth, the
Trade Balance, and the Real Exchange Rate,” European
Economic Review, Vol. 46, No. 6, 2002, pp. 1049-1071.
doi:10.1016/S0014-2921(02)00160-5