Open Journal of Social Sciences
2013. Vol.1, No.5, 5-9
Published Online October 2013 in SciRes (http://www.scirp.org/journal/jss) http://dx.doi.org/10.4236/jss.2013.15002
Open Access 5
Performance Measurement for Construction CALS
Application of Ubiquitous Technology Using
the Process Chart Method
Tae Hak Kim, Seong Yun Jeong
ICT Convergence and Integration Research Division,
Korea Institute of Construction Technology, Goyang-Si, Republic of Korea
Email: kimth@re.kr
Received September 2013
From the industrial field that spearheaded IT created new added values and markets, and with the fusion
of the traditional industry composition, researches are actively being conducted to steer advancement. The
application possibility of the high-tech IT technique in the construction industry is increasing. Therefore,
when a technique similar to this ubiquitous technique is applied to the Construction CALS system, the ef-
fectiveness of the business transaction is augmented, and a business that could reduce the various needed
expenses is predicted. In this research, the exhibition features developed and detailed the features of the
Construction CALS system to measure the effectiveness of the development so as to prove the validity of
the Process Chart using techniques with detailed exhibition features, and will want to conduct quantitative
performance measurement.
Keywords: Construction CALS; Ubiquitous; Process Chart Method; Quantitative Performance
Measurement
Introduction
In recent years, the national infrastructure business of the
construction sector has been calling for the upgrading of con-
struction informatization through the convergence and combi-
nation of sophisticated IT application technologies. In the con-
struction field, the HR management and logistics management
sectors are researching on the application of the RFID technol-
ogy to actual work, along with the pilot application of the
technology. In connection with such changes, in road/river
project management, to resolve the problems with the users’
manual inputting of construction field data, such as data input
delay, inaccuracy and absence, a need to develop methods of
using the ubiquitous technology and automatically inputting
data is emerging.
Thus, the existing construction CALS system must be im-
proved. In recent years, the functions of the construction CALS
system are being improved and upgraded by using sophisticated
technologies, gathering information in real time, achieving
automatic connection, removing unnecessary processes, and
changing approval processes, so as to enhance work efficiency,
reduce manpower and shorten construction periods, and conse-
quently cut various costs, including labor cost.
From this viewpoint, to continue develop the construction
CALS system, it should be upgraded in line with environmental
changes, and the performance of the upgraded functions must
be analyzed.
Even though the construction of the CALS system is up-
graded in a timely manner, the performance of its upgraded
function should be analyzed quantitatively and verified to prove
its effects.
Thus, to measure and prove the effects of the developed pilot
functions and detailed functions, this study quantitatively meas-
ured the time and cost results, used the process chart technique,
and offered a method of analyzing the performance of pilot
functions and detailed functions.
To measure the performance of the developed construction
CALS system, the performance of the system function in using
its sensor network, inspecting facilities and automatically in-
putting/gathering onsite data was measured.
Preliminary Discussion
Outline of the Constr uc tion CALS System
CALS is an integrated informatization strategy designed to
enable the client, the constructor and other related parties to
exchange and share via the Internet the information created in
the entire process of construction project planning and design,
construction execution, and maintenance. It is based on the
Construction Technology Management Act—Article 15-2 (the
construction of integrated information systems for supporting
construction work). The project began in 1998, and systems and
construction information standards have since been developed.
The fourth master plan (2013-2017) has been devised and is
now being implemented.
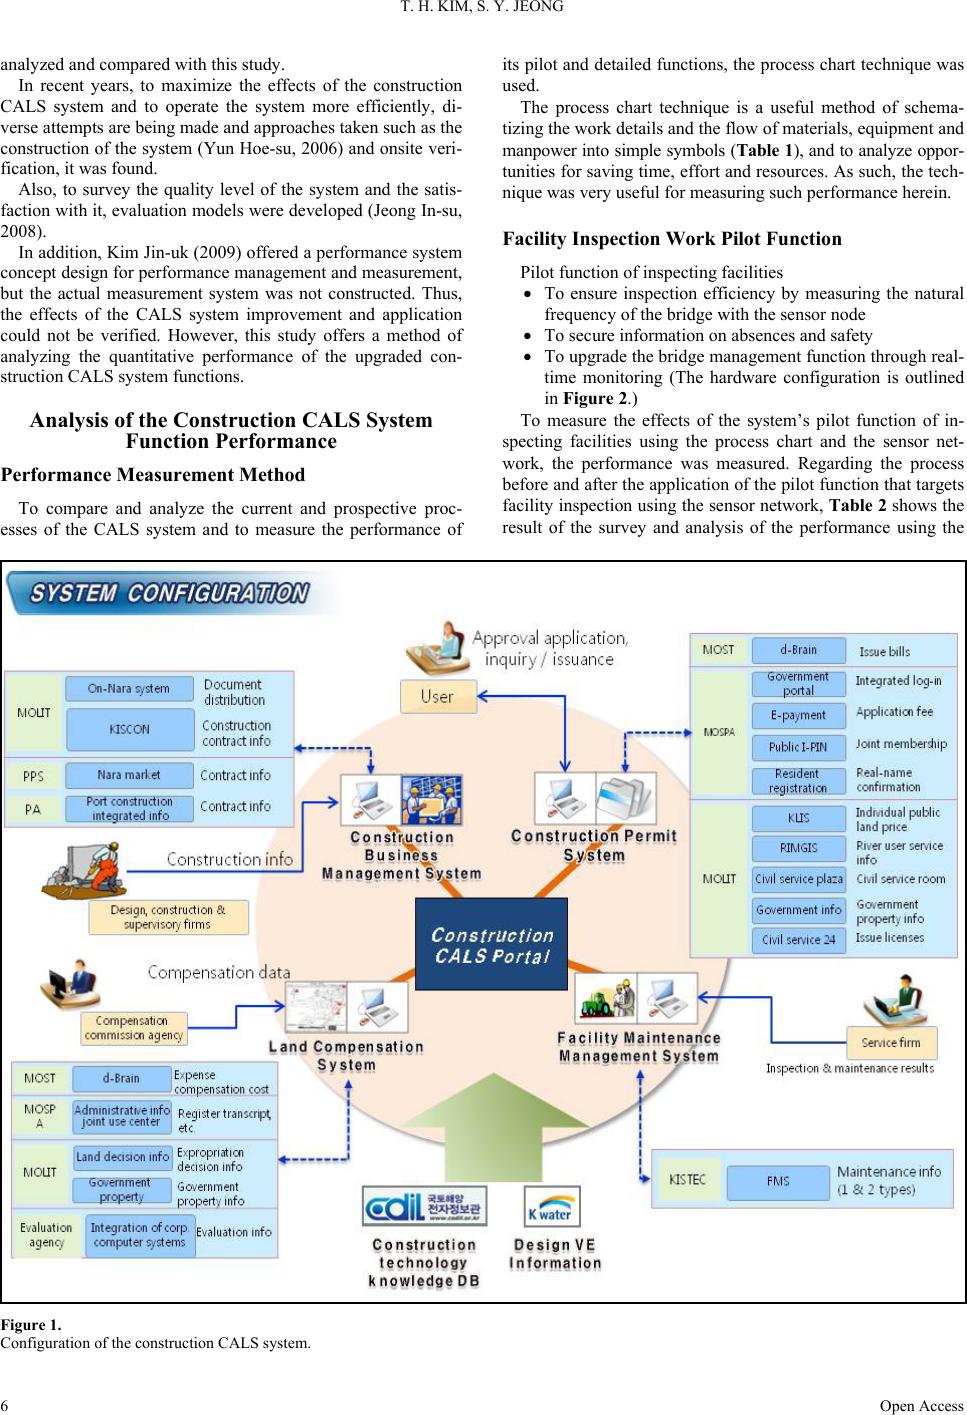
The developed systems are the Construction Project Man-
agement System, the Facility Maintenance Management Sys-
tem, the Land Compensation System, the Construction Permit
System and the Construction CALS Portal System (Figure 1).
Discussion of Existing Researches
To propose a method of measuring the performance of the
construction CALS system, existing studies on the system were
T. H. KIM, S. Y. JEONG
Open Access
6
analyzed and compared with this study.
In recent years, to maximize the effects of the construction
CALS system and to operate the system more efficiently, di-
verse attempts are being made and approaches taken such as the
construction of the system (Yun Hoe-su, 2006) and onsite veri-
fication, it was found.
Also, to survey the quality level of the system and the satis-
faction with it, evaluation models were developed (Jeong In-su,
2008).
In addition, Kim Jin-uk (2009) offered a performance system
concept design for performance management and measurement,
but the actual measurement system was not constructed. Thus,
the effects of the CALS system improvement and application
could not be verified. However, this study offers a method of
analyzing the quantitative performance of the upgraded con-
struction CALS system functions.
Analysis of the Construction CALS System
Function Performance
Performance Measurement Method
To compare and analyze the current and prospective proc-
esses of the CALS system and to measure the performance of
its pilot and detailed functions, the process chart technique was
used.
The process chart technique is a useful method of schema-
tizing the work details and the flow of materials, equipment and
manpower into s imple symbols (Table 1), and to analyze oppor-
tunities for saving time, effort and resources. As such, the tech-
nique was very useful for measuring such performance herein.
Facility Inspection Work Pilot Fun ctio n
Pilot function of inspecting facilities
To ensure inspection efficiency by measuring the natural
frequency of the bridge with the sensor node
To secure inf ormation on absences and safety
To upgrade the bridge management function through real-
time monitoring (The hardware configuration is outlined
in Figure 2.)
To measure the effects of the system’s pilot function of in-
specting facilities using the process chart and the sensor net-
work, the performance was measured. Regarding the process
before and after the application of the pilot function that targets
facility inspection using the sensor network, Table 2 shows the
result of the survey and analysis of the performance using the
Figure 1.
Configuration of the construction CALS system.
T. H. KIM, S. Y. JEONG
Open Access
7
Table 1.
ASME (American Society of Mechanical Engineers) process symbols.
Symbol Name Meaning
Work Behavior or di splacement that accompanie s changes
Move Movement of humans or obj ec ts
Store Long-term storage of information, materials, etc.
Inspect Inspection to secure quality a nd quantity
Figure 2.
Configuration of the pilot function hardware for inspecting facilities.
Table 2.
Current and prospective pilot functions of facility inspection using the sensor network based on the process chart analysis.
(Unit: minute)
Chart As-is Process Model To-be Process Model Effect
Symbol Process Work Time Process Work Time
Prior survey 240 Prior survey (web) 30 210
Move to the field 60 Move to the field 60 0
Onsite survey (Appearance survey) 30 Onsite survey (Appearance survey) 30 0
Move to the office 60 Move to the office 60 0
Review and analyze the survey results 30 Review and analyze the survey results 30 0
Write the report 60 Write the report 60 0
Approve an d s tore Approve and store
Total 480 270 210
process chart technique.
As shown in Table 2, the current facility inspection work
and the inspection process were classified into four stages
based on one bridge and took 360 minutes. Moreover, the pro-
spective work and the inspection process of the developed pilot
function had four stages but took 150 minutes, thus reducing
the time by 210 minutes compared with the current process.
The staff’s onsite visual check and review/analysis report
writing took the same amount of time; but with the prospective
process, the time required for identifying onsite problems be-
fore performing onsite work and for gathering related data was
drastically reduced.
Onsite Data Automa ti c Input/Gathering Functions
The onsite-data automatic input/gathering function had the
hardware configuration shown in Figure 3 to:
Secure manage information in real time and achieve JIT
T. H. KIM, S. Y. JEONG
Open Access
8
Check the transport time between the factory and the field
and secure quality
Automate the gathering of invoice information; and Ana-
lyze the gathered data and devise an optimal transport
plan
Using the process chart technique, Table 3 shows the results
of the survey/analysis of the process with the application of the
onsite-data automatic input/gathering functions, based on an
onsite survey and interviews with the working staffers (the
survey targeted remicon work, for which the remicon, ascon
and soil function is expected to be used the most), and the
process before the application of the detailed functions.
As shown in Tabl e 3, the current remicon management work
and the inspection process were classified into seven stages
based on one vehicle’s one-time work, and took 150 minutes.
Moreover, the prospective work and inspection process with the
application of the developed functions had six stages, one stage
less than the current process, and took 47 minutes, 103 minutes
less than the current process.
Conclusion
To examine the effects of the developed pilot functions and
detailed functions, the process chart technique was used and
quantitatively analyzed. The findings revealed that the work
time was reduced.
Specifically, in the pilot function of inspecting facilities us-
ing the sensor network, the inspection time was reduced by
Table 3.
Current and prospective onsite-data automatic input/gathering function based on the process chart analysis.
(Unit: minute)
Chart As-is Process Model To-be Process Model Effect
Symbol
Process Work Time
Process Work Time
Factory vehicle departure and invoice issuance 10
After the vehicle departure from the factory, confirmation
of the issuance of the invoice (RFID card) and the vehicle
departure (RFID scanning)
5 5
Vehicle move to the field 30 Vehicle mov e to the field 30 0
management of the entrance and checking of the
number of tra nsports 10 After the vehicle entry into the field, scanning of the RFID card 1 9
Onsite concrete placement 30 Onsite concrete placement 30 0
management of the entr ance and checking of the
10 After the vehicle entry into the field, scanning of the RFID ca r d 1 9
Vehicle move to the factory 30 Vehicle move to the factory 30 0
Checking of the day’s vehicles and gathering
of the results 50 Automatic gathering and u pdating of the work amount 0 50
Writing of the work diary (PC) 30 Reporting and approval of the writ t en work diary (web) 10 20
Reporting and approva l of the written work diary 10 - 10
Approval and storage Approval a nd storage
Total 210 107 103
Figure 3.
Configuration of the onsite-data automatic input/gathering function hardware.
T. H. KIM, S. Y. JEONG
Open Access
9
60% compared with the existing inspection process; and in the
onsite-data automatic input/gathering function, the time was
reduced by 70% compared with the existing work process.
The process chart technique that was proposed herein for
quantitative performance measurement can be used to analyze
the performance of other functions of the established construc-
tion CALS system to devise strategies for upgrading the con-
struction CALS system and to come up with a method of mea-
suring the system performance.
Acknowledgements
This study was conducted as part of the [13. Operation and
Technical Improvement of the Construction CALS System (II)]
by the Ministry of Land, Infrastructure and Transport.
REFERENCES
Jeong, I.-S. (2008). Analysis of the quality level of the construction
CALS system. Seoul: Architectural Institute of Korea.
Kim, C.-H. (2005). USN concept and analysis of recent trends. Seoul:
Korea Institute of Information and Communication.
Kim, J.-U. (2009). Design of the construction CALS performance
management system. Seoul: Korean Institute of Information Tech-
nology.
Yun, H.-S. (2006). A study on the design direction of the construction
CALS portal system. Seoul: Architectural Institute of Korea.