Paper Menu >>
Journal Menu >>
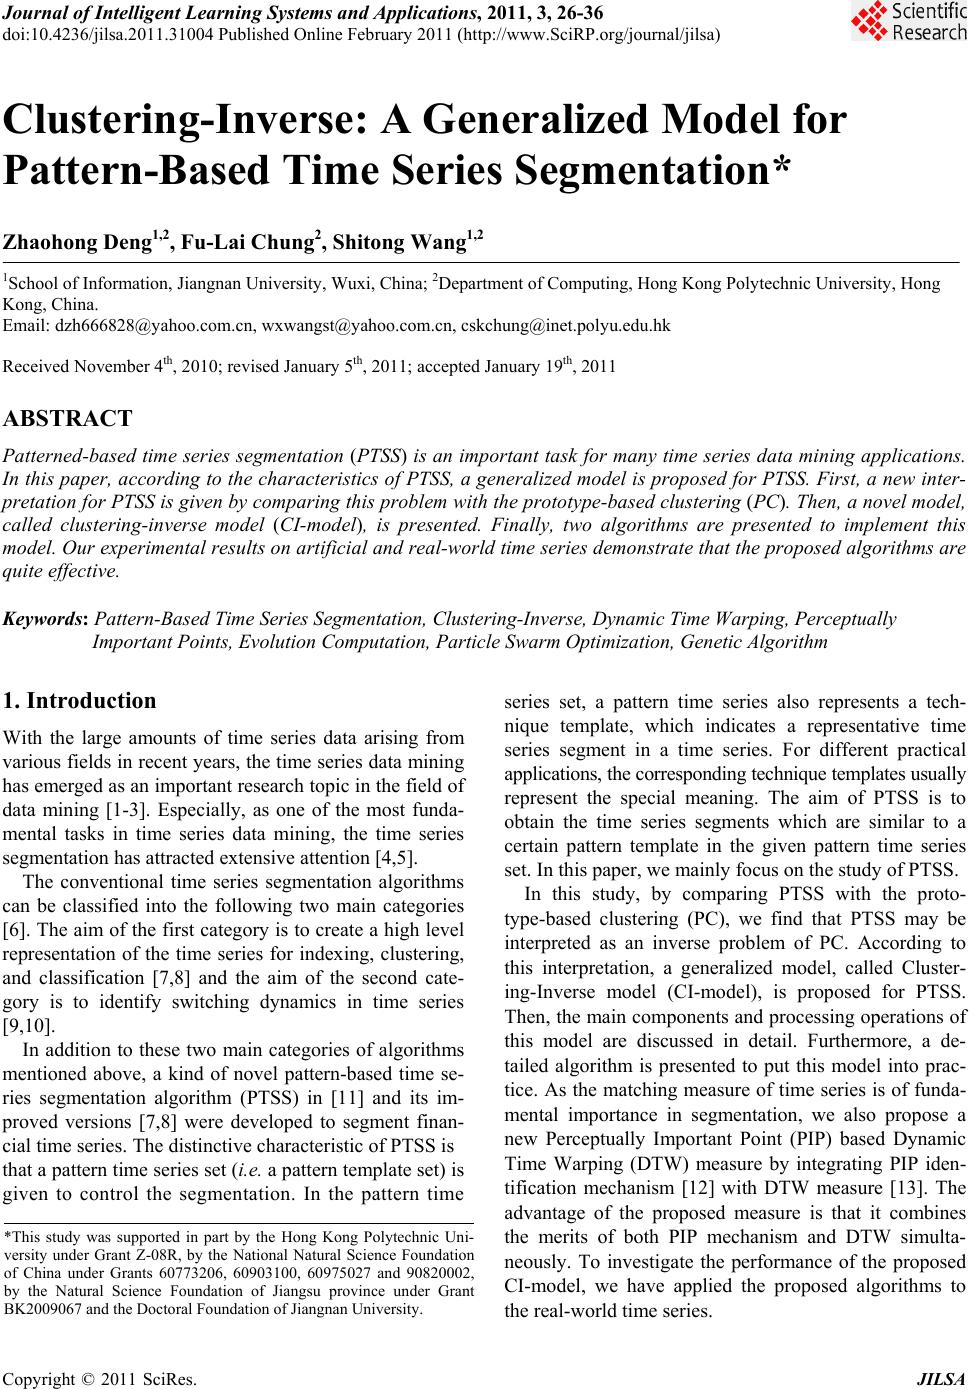 Journal of Intelligent Learning Systems and Applications, 2011, 3, 26-36 doi:10.4236/jilsa.2011.31004 Published Online February 2011 (http://www.SciRP.org/journal/jilsa) Copyright © 2011 SciRes. JILSA Clustering-Inverse: A Generalized Model for Pattern-Based Time Series Segmentation* Zhaohong Deng1,2, Fu-Lai Chung2, Shitong Wang1,2 1School of Information, Jiangnan University, Wuxi, China; 2Department of Computing, Hong Kong Polytechnic University, Hong Kong, China. Email: dzh666828@yahoo.com.cn, wxwangst@yahoo.com.cn, cskchung@inet.polyu.edu.hk Received November 4th, 2010; revised January 5th, 2011; accepted January 19th, 2011 ABSTRACT Patterned-based time series segmentation (PTSS) is an important task for many time series data mining applications. In this paper, according to the characteristics of PTSS, a generalized model is proposed for PTSS. First, a new inter- pretation for PTSS is given by comparing this problem with the prototype-based clustering (PC). Then, a novel model, called clustering-inverse model (CI-model), is presented. Finally, two algorithms are presented to implement this model. Our experimental results on artificial a nd real-world time series demonstrate that the proposed algorithms are quite effective. Keywords: Pattern-Based Time Series Segmentation, Clustering-Inverse, Dynamic Time Warping, Perceptually Important Points, Evolution Compu tation, Particle Swarm Optimization, Genetic Algorith m 1. Introduction With the large amounts of time series data arising from various fields in recent years, the time series data mining has emerged as an important research topic in the field of data mining [1-3]. Especially, as one of the most funda- mental tasks in time series data mining, the time series segmentation has attracted extensiv e attention [4,5]. The conventional time series segmentation algorithms can be classified into the following two main categories [6]. The aim of the first category is to create a high level representation of the time series for indexing, clustering, and classification [7,8] and the aim of the second cate- gory is to identify switching dynamics in time series [9,10]. In addition to these two main categories of algorithms mentioned above, a kind of novel pattern-based time se- ries segmentation algorithm (PTSS) in [11] and its im- proved versions [7,8] were developed to segment finan- cial time series. The distinctive characteristic of PTSS is that a pattern time series set (i.e. a pattern template set) is given to control the segmentation. In the pattern time series set, a pattern time series also represents a tech- nique template, which indicates a representative time series segment in a time series. For different practical applications, the corresponding technique templates usually represent the special meaning. The aim of PTSS is to obtain the time series segments which are similar to a certain pattern template in the given pattern time series set. In this paper, we mainly focus on the study of PTSS. In this study, by comparing PTSS with the proto- type-based clustering (PC), we find that PTSS may be interpreted as an inverse problem of PC. According to this interpretation, a generalized model, called Cluster- ing-Inverse model (CI-model), is proposed for PTSS. Then, the main components and processing operations of this model are discussed in detail. Furthermore, a de- tailed algorithm is presented to put this model into prac- tice. As the matching measure of time series is of funda- mental importance in segmentation, we also propose a new Perceptually Important Point (PIP) based Dynamic Time Warping (DTW) measure by integrating PIP iden- tification mechanism [12] with DTW measure [13]. The advantage of the proposed measure is that it combines the merits of both PIP mechanism and DTW simulta- neously. To investigate the performance of the proposed CI-model, we have applied the proposed algorithms to the real-world time series. *This study was supported in part by the Hong Kong Polytechnic Uni- versity under Grant Z-08R, by the National Natural Science Foundation of China under Grants 60773206, 60903100, 60975027 and 90820002, by the Natural Science Foundation of Jiangsu province under Grant BK2009067 and the Doctoral Foundation of Jiangnan University. 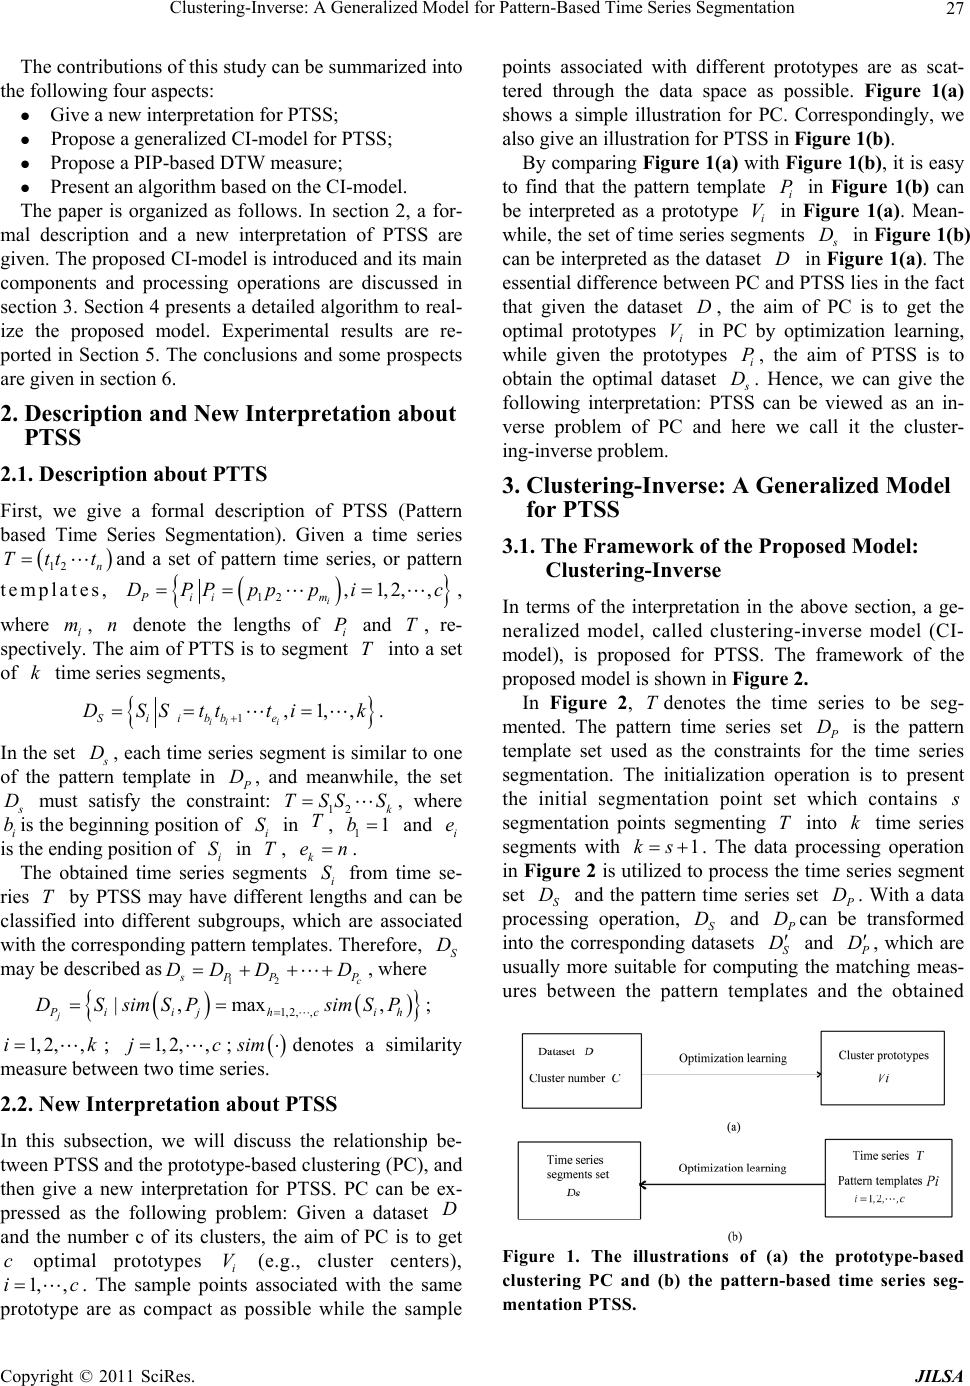 Clustering-Inverse: A Generalized Model for Pattern-Based Tim e Series Segmentation Copyright © 2011 SciRes. JILSA 27 The contributions of this study can be summarized into the following four aspects: Give a new interpretation for PTSS; Propose a generalized CI-model for PTSS; Propose a PIP-based DTW measure; Present an algorithm based on the CI-model. The paper is organized as follows. In section 2, a for- mal description and a new interpretation of PTSS are given. The proposed CI-model is introduced and its main components and processing operations are discussed in section 3. Section 4 presents a detailed algorithm to real- ize the proposed model. Experimental results are re- ported in Section 5. The conclusions and some prospects are given in section 6. 2. Description and New Interpretation about PTSS 2.1. Description about PTTS First, we give a formal description of PTSS (Pattern based Time Series Segmentation). Given a time series 12 n Ttttand a set of pattern time series, or pattern templates, 12 ,1,2,, i Pii m DPPpppi c , where i m, n denote the lengths of i P and T, re- spectively. The aim of PTTS is to segment T into a set of k time series segments, 1,1,, ii i Siibb e DSStttik . In the set s D, each time series segment is similar to one of the pattern template in P D, and meanwhile, the set s D must satisfy the constraint: 12 k TSS S, where i bis the beg inning position o f i S in T, 11b and i e is the ending position of i S in T, k en. The obtained time series segments i S from time se- ries T by PTSS may have different lengths and can be classified into different subgroups, which are associated with the corresponding pattern templates. Th erefore, S D may be described as12 c s PP P DDD D, where 1,2, , |,max , j Piijhc ih DSsimSP simSP ; 1, 2,,ik; 1, 2,,jc; sim denotes a similarity measure between two time series. 2.2. New Interpretation about PTSS In this subsection, we will discuss the relationship be- tween PTSS and the prototype-based clustering (PC), and then give a new interpretation for PTSS. PC can be ex- pressed as the following problem: Given a dataset D and the number c of its clusters, the aim of PC is to get c optimal prototypes i V (e.g., cluster centers), 1, ,ic. The sample points associated with the same prototype are as compact as possible while the sample points associated with different prototypes are as scat- tered through the data space as possible. Figure 1(a) shows a simple illustration for PC. Correspondingly, we also give an illustration for PTSS in Figure 1(b). By comparing Figure 1(a) with Figure 1(b), it is easy to find that the pattern template i P in Figure 1(b) can be interpreted as a prototype i V in Figure 1(a). Mean- while, the set of time series segments s D in Figure 1(b) can be interpreted as the dataset D in Figure 1(a). The essential difference between PC and PTSS lies in the fact that given the dataset D, the aim of PC is to get the optimal prototypes i V in PC by optimization learning, while given the prototypes i P, the aim of PTSS is to obtain the optimal dataset s D. Hence, we can give the following interpretation: PTSS can be viewed as an in- verse problem of PC and here we call it the cluster- ing-inverse problem. 3. Clustering-Inverse: A Generalized Model for PTSS 3.1. The Framework of the Proposed Model: Clustering-Inverse In terms of the interpretation in the above section, a ge- neralized model, called clustering-inverse model (CI- model), is proposed for PTSS. The framework of the proposed model is shown in Figure 2 . In Figure 2, Tdenotes the time series to be seg- mented. The pattern time series set P D is the pattern template set used as the constraints for the time series segmentation. The initialization operation is to present the initial segmentation point set which contains s segmentation points segmenting T into k time series segments with 1ks . The data processing operation in Figure 2 is utilized to process the time series segment set S D and the pattern time series set P D. With a data processing operation, S D and P Dcan be transformed into the corresponding datasets S D and P D, which are usually more suitable for computing the matching meas- ures between the pattern templates and the obtained Figure 1. The illustrations of (a) the prototype-based clustering PC and (b) the pattern-based time series seg- mentat ion PTSS . 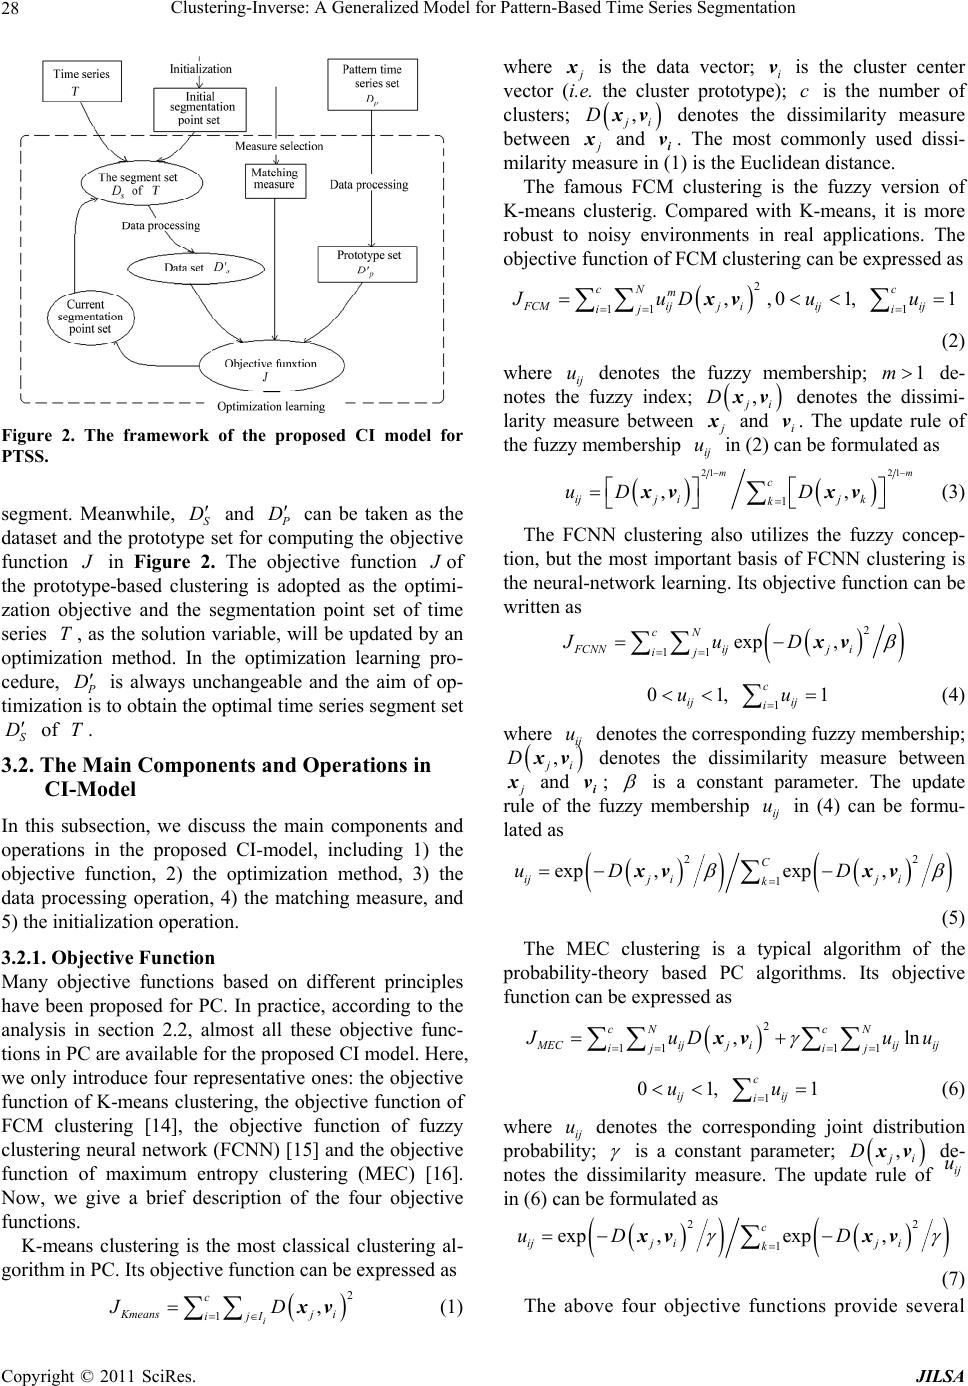 Clustering-Inverse: A Generalized Model for Pattern-Based Tim e Series Segmentation Copyright © 2011 SciRes. JILSA 28 Figure 2. The framework of the proposed CI model for PTSS. segment. Meanwhile, S D and P D can be taken as the dataset and the prototype set for computing the objective function J in Figure 2. The objective function J of the prototype-based clustering is adopted as the optimi- zation objective and the segmentation point set of time series T, as the solution variable, will be updated by an optimization method. In the optimization learning pro- cedure, P D is always unchangeable and the aim of op- timization is to obtain the optimal time series segment set S D of T. 3.2. The Main Components and Operations in CI-Model In this subsection, we discuss the main components and operations in the proposed CI-model, including 1) the objective function, 2) the optimization method, 3) the data processing operation, 4) the matching measure, and 5) the initialization operation. 3.2.1. Objective Function Many objective functions based on different principles have been proposed for PC. In practice, according to the analysis in section 2.2, almost all these objective func- tions in PC are available for the proposed CI model. Here, we only introduce four representative ones: the objective function of K-means clustering, the objective function of FCM clustering [14], the objective function of fuzzy clustering neural network (FCNN) [15] and the objective function of maximum entropy clustering (MEC) [16]. Now, we give a brief description of the four objective functions. K-means clustering is the most classical clustering al- gorithm in PC. Its objective function can be expressed as 2 1, i c Kmeansj i ijI JD xv (1) where j x is the data vector; i v is the cluster center vector (i.e. the cluster prototype); c is the number of clusters; , j i Dxv denotes the dissimilarity measure between j x and i v. The most commonly used dissi- milarity measure in (1) is the Euclidean distance. The famous FCM clustering is the fuzzy version of K-means clusterig. Compared with K-means, it is more robust to noisy environments in real applications. The objective function of FCM clustering can be expressed as 2 11 , cN m FCMijj i ij JuD xv ,1 01, 1 c ij ij i uu (2) where ij u denotes the fuzzy membership; 1m de- notes the fuzzy index; , j i Dxv denotes the dissimi- larity measure between j x and i v. The update rule of the fuzzy membership ij u in (2) can be form ulated as 21 21 1 ,, mm c ijj ij k k uD D xvxv (3) The FCNN clustering also utilizes the fuzzy concep- tion, but the most important basis of FCNN clustering is the neural-network learning. Its objective function can be written as 2 11 exp , cN FCNNijj i ij JuD xv 1 01, 1 c ij ij i uu (4) where ij u denotes the corresponding fuzzy membership; , j i Dxv denotes the dissimilarity measure between j x and i v; is a constant parameter. The update rule of the fuzzy membership ij u in (4) can be formu- lated as 22 1 exp ,exp , C ij jiji k uD D xvxv (5) The MEC clustering is a typical algorithm of the probability-theory based PC algorithms. Its objective function can be expressed as 2 11 11 ,ln cN cN M ECijj iijij ij ij J uDu u xv 1 01, 1 c ij ij i uu (6) where ij u denotes the corresponding joint distribution probability; is a constant parameter; , j i Dxv de- notes the dissimilarity measure. The update rule of ij u in (6) can be formulated as 22 1 exp ,exp , c ij jiji k uD D xvxv (7) The above four objective functions provide several  Clustering-Inverse: A Generalized Model for Pattern-Based Tim e Series Segmentation Copyright © 2011 SciRes. JILSA 29 possible schemes to implement the proposed CI-model. Note here that the objective functions in (1), (2) and (6) are expected to achieve the minimum values, while the objective functions in (4) is expected to achieve the maximum value. 3.2.2. Optimization Meth o d In the proposed CI-model, the objective function is just the clustering objective function and the solution is the segmentation point set _int 12 ,,, s eg pos Dqqq, which can be equivalently written as a vector 12 ,,, s qq qq, where 11, 2,,1 ii qqis , 11q, s qn; and n is the length of time series T. Since the objective function usually can not be written as an analytic expression of the solution 12 ,,, s qq qq directly, the traditional gradient optimization methods and some other commonly used derivative-based opti- mization methods are not suitable for this problem. Un- der these conditions, the following optimization methods can be considered. 1) Dynamic programming. It is the earliest technique utilized to solve the traditional time series segmentation problem [7]. A crucial step for dynamic programming methods is to transform the optimization problem into its corresponding dynamic programming equation. The weakness of this kind of method for time series segmen- tation is the high computational complexity. Meanwhile, it is not a trivial problem to transform the optimization process into its corresponding dynamic programming. 2) Random optimization. It is a simple method for the time series segmentation [17]. This method first gives an initial segmentation. Then, in the whole learning proce- dure, the following operation is repeated: a segmentation point is selected randomly to be replaced with an optimal point obtained by trying all other potential segmentation points. So the computational complexity is also quite high like the dynamic programming method. 3 ) Evolutionary optimization. Evolutionary optimiza- tion methods have been extensively studied and utilized in various fields in recent years and their applications in time series segmentation has been demonstrated in [11,12]. Compared with the above two optimization me- thods, the advantages of evolutionary optimization me- thods are their easy use and high intelligence. Due to the advantages of evolutionary optimization methods, in the following algorithms presented to implement the pro- posed CI-model, this kind of optimization methods is adopted. 3.2.3. Data Pro cessi ng Data processing is an important operation: 1) to trans- form the time series segments and pattern time series into easily processed data vectors; 2) to facilitate computing the matching measures between the obtained time series segments and the pattern time series. For example, the transformation of the obtained time series segments and the pattern time series into the corresponding vectors with the same dimensional number will facilitate compu- ting their matching measure using Euclidean distances; 3) to effectively reduce the computational complexity of matching measures. For example, the commonly used DTW measure for time series matching needs to solve a dynamic programming problem. With the increase of time series length, the computation time of DTW meas- ure will become very burdensome. Thereby, the data processing is needed to improve the efficiency of DTW measure. In this study, to realize the above functions we intro- duce the PIP (Perceptually Important Point) identifica- tion mechanism [11,12] as a data processing operation in CI. The PIP mechanism is to identify some perceptually important points in time series to represent the time se- ries. Thus the computational complexity is greatly de- creased because the number of PIPs is far smaller than the length of time series. Now we give a brief introduc- tion to the PIP mechanism. The idea of PIP identification is motivated by the fact that a time series can be usually characterized by a few important points. For example, the head-and-shoulder pattern time series consists of a head point, two shoulder points, and a pair of neck points. These points are per- ceptually important in the human visual identification process. Therefore, they can similarly be taken into ac- count in the pattern matching process. Given a time se- ries 12 n X xx x, its m PIPs can be obtained by the following process. The first two PIPs that are found will be the first and last points of X . The next PIP will be the point in X with the maximum distance to the first two PIPs. The fourth PIP will then be the point in X with maximum distance to its two adjacent PIPs, either between the first and second PIPs or between the second and the last PIPs. The process of locating the PIPs continues until the number is equal to m. Figure 3 shows the process of identifying 7 PIPs from the head-and-shoulder pattern time series with length 60n . 3.2.4. Matc hi n g Mea s ure The matching measure of times series is of fundamental importance in time series data mining. The most com- monly used measures are Euclidean distance and DTW measure [13]. In [11,12] the PIP-based Euclidean dis- tance was proposed, which revealed much better perfor- mance in reducing the running time. Here, we first briefly introduce the three matching measures, and then propose a PIP-based DTW measure for time series matc h i n g. Our purpose is to present a measure which can  Clustering-Inverse: A Generalized Model for Pattern-Based Tim e Series Segmentation Copyright © 2011 SciRes. JILSA 30 (a) (b) (c) (d) (e) (f) Figure 3. Identification of seven PIPs from the head-and-should pattern time series. simultaneously take advantage of these merits. Euclidean distance: Given two time series 12 n X xx x and 12 ,n Yyy y, which have the same length, the Euclidean distance of these two timeseries can be expressed as 2 21 ,n ii i DXYx y (8) The Euclidean distance measure has been extensively used in time series data mining. However, there is an increasing awareness that it is a much brittle measure in time series data mining [18]. DTW measure: To overcome the weakness of Eucli- dean distance, Berndt and Clifford introduced the Dy- namic Time Warping (DTW) measure in the database community [13]. DTW measure enables matching similar time series with different lengths. PIP-based Euclidean distance: A PIP-based Euclidean distance is presented in [11]. For two time series 12 n X xx x, 12 m Yyyy, assuming Y is a pattern time series, the PIP-based Euclidean distance between X and Y, p ip D, can be formulated as 2 21 ,, h m pippp h h DXYDXYxy (9) where 1,,m PP P X xxdenotes the new time series containing m PIPs of time series X . PIP-based DTW measure: Compared with Euclidean distance, the DTW measure has its distinctive advantages, such as robustness, elasticity. However, the DTW meas- ure has an obvious weakness of high computational complexity. To reduce this weakness, a new modified DTW measure, named as PIP-based DTW measure, p dt D, is introduced. This measure can be formulated as ,, p dtP P dtw DXYD XY (10) where P X and P Y are two new time series which are composed of the obtained PIPs from X and Y, re- spectively. In this new measure, two adjustable parame- ters, r and 2 r, are introduced to control the number of desired PIPs, where 1 mrm , 2 nrm . Here, ,mn are the lengths of X and Y, respectively; and ,mn are the lengths of P X and P Y respectively. The ranges of 1 r and 2 r are dependent on the time series to be segmented. For the time series that changes slowly, we can set much smaller values for 1 r and 2 r. When the time series changes quickly, the 1 r and 2 r should be much larger in order to maintain the segmentation per- formance. In our experiments, we find that to set 1 0.5 1r , 2 11.5r is appropriate in many cases. 3.2.5 Initialization With different initializations, the obtained clustering prototypes in PC may be different. Likewise, the solu- tions of PTSS will be influenced by the initialization. Here two heuristic initialization strategies are proposed for the proposed CI-model. 1) Initialization for a desired solution with prior  Clustering-Inverse: A Generalized Model for Pattern-Based Tim e Series Segmentation Copyright © 2011 SciRes. JILSA 31 knowledge. With his knowledge, the user can specify the approximate length dlen of the desired times series segments. For example, given a stock index time series with length 3000l taken from the daily closing price, if the user wants to get the segments about a month pe- riod or three-month period, he sets 30dlen and 90 dlen , respectively. Correspondingly, 1sldlen segmentation points can be initialized with the interval dlen r, where x denotes the minimal integer which is bigger than x and r is a random number to control the initial interval between the adjacent segmentation points. To set 0.75,1.25r is appropriate for most cases. 2) Initialization evaluated by a specific performance index. In some cases, little information can be used to set dlen for initializing the segmentation points. In this situation, we suggest to segment the time series by set- ting different values of dlen , such as setting 100dlen , 200dlen , and so on. Then, the appropriate initializa- tion can be determined by a specific performance index as the criterion. 4. CI-Model Based PTSS Algorithm 4.1. General CI-Model Based PTSS Algorithm In this subsection, the general CI-model based algorithm for PTSS is presented in Table 1.Evolutionary optimiza- tion methods have their distinctive advantages, such as much better global search ability. Among various evolu- tionary optimization methods, Particle Swarm Optimiza- tion (PSO) [20] is one of the most extensively studied methods. In the following subsection, we will present such a CI-model based PTSS algorithm using PSO. 4.2. PTSS Algorithm Based on CI-Model + SPSO In this subsection, we introduce the PSO (Particle Swarm Optimization) for CI-model to implement the PTSS. The PSO is a population-based optimization method. The PSO is motivated by the behavior of organisms such as fishing schooling and bird flock. In a PSO system, each individual is taken as a particle and a particle is taken as a candidate solution to the problem at hand. Particles of the population fly around in a multi-dimensional search space, to find out an optimal or sub-optimal solution by competition as well as by cooperation among them. For simplicity, here, we directly use the well-known Stand Particle Swarm Optimization (SPSO) as the opti- mization method for CI model. First, we describe the related important conceptions and search strategies of SPSO. Then, a PTSS algorithm based on CI-model + SPSO is presented. 4.2.1. Concept i ons about SPSO In SPSO, the population contains M particles and the thi particle can be described by two state variables: the position vector 12 ,,, iii is x xxx and the velocity vector ,, , iii s vv vv. For the PTSS, the segmentation vector 12 ,,, iii is qq qq of the time series T can be taken as the position variable of the thi particle. The velocity variable i v of the thi particle is usually in- itialized to be zero vector. In addition to these two state variables of the thi particle, another state variable ,, iiii pp pp is utilized to describe the best posi- tion the thi particle ever reached, which represents the experience of the thi particle itself. The initial best position variable ,, iiii pp pp of the thi par- ticle is commonly set to ii px and can be updated by the following rule when the aim of optimization is to obtain the minimum value of objective function. 1 111 iii i iii tifJtJt ttifJtJt pxp pxxp (11) where t denotes the number of generations and J denotes objective function. In SPSO, another very important variable is the global best position variable g p, which describes the best posi- tion among all the positions that all particles ever reached and represents the social shared information. The global best position g p is updated in every generation by the following rule. () argmin i gi t tJtp pp (12) 4.2.2. E volution ary Rules of SPSO. With the above con cepts, the evolutionar y rules of SPSO can be described as 112 2 1 11 ijijij ijgj ij ijij ij vtwvtcpt xtcptxt xtxt vt (13) where i denotes the thi particle; j denotes the thj dimension; t denotes the tht generation; w denotes the inertia weight, which often is set to be linear decrease in a interval (e.g. [0.4, 0.9]); and 12 ,cc are two acceleration constants (often set in the interval (0, 2]); 1 and 2 are two random numbers in the interval 0 , 1. When a segmentation point vector i q is taken as a position vector i x in the SPSO, the con- straint conditions 11 ij ij xt roundxt (14) 11 1 11 1 ij current current ij ijij ij ij ij x t xtifxtx andxtx xt otherwise (15)  Clustering-Inverse: A Generalized Model for Pattern-Based Tim e Series Segmentation Copyright © 2011 SciRes. JILSA 32 1, 2,, ij x n, 1 ij ij xx , 1, ,1js, 11 i x, is x n must be satisfied, where n is the length of the time series to be segmented and s is the number of segmentation points of a segmentation point vector, i.e. the dimensional number of i x. For the cons traint condi- tions in PTSS, we need to make further processing on 1 ij xtobtained by (14). where round a denotes the nearest integer to a; current ij x denotes the current value of ij x ; if current ij x has been updated in the tht generation, thencurrent ij x 1 ij xt, otherwise, current ij ij x xt, meanwhile, for simplicity, we set 01 current i x, (1) curr ent is x n . Based on the above conceptions and evolutionary rules of the SPSO, a detailed PTSS algorithm based on the CI-model +SPSO is presented in Table 2. 4.2.3. Some Disc ussi ons In the above subsection, we present a PTSS algorithm based on the CI-model. In fact, these two algorithms are only two feasible schemes and can be furthermore im- proved by different tactics. In [11], an evolutionary PTSS algorithm is proposed for financial time series segmentation and the corres- ponding improved versions are presented in [12]. Here, we give a brief discussion about the relationship between these PTSS algorithms in [11,12] and the proposed CI-model based PTSS algorithms in this study. In es- sence, the algorithm in [11,12] optimizes the fitness ob- jective function given in (16) by a GA optimizationme- thod with the segmentation point set of the time series as the solution. Table 1. General CI-model based PTSS algorithm. Step1 1) Given the time series to be segmented and the pattern time series set. 2) Select a specific optimization objective function (e.g. the objective function of FCM clustering) and the cor- responding update rules of the related variables (e.g. fuzzy membership variables in the FCM objective function). 3) Select a matching measure of time series and the cor- responding da ta processing operations. 4) Set the desired approximate segment length dlen and initialize the segmentation point set with dlen . 5) Select the optimization method. Step2 Use the selected optimization method to optimize the objective function and gain the optimal segmentation point set. Step3 Use the obtained optimal segmentation point set to get the set of time series segments. Table 2. PTSS algorithm based on CI-model + SPSO. Step1 1) Given the time series to be segmented and the pattern time series set. 2) Set the approximately desired segment lengthdlen. 3) Initialize the state variables of the populat i on. 4) Select the objective function and the corresponding update rules of the variables in this objective function. Step2 1) Select the matching measure and the corresponding data processing operation. 2) Transform the pattern time series into the correspond- ing prototype vectors by a data processing operation. 3) Set the termination conditions of the SPSO. Step3 Obtain the time series segments sets associated with different individuals, and then transform them into the corresponding data sets. Step4 Update the corresponding variables (e.g. the FCM mem- bership variables). Step5 Compute the objective function values of all individual s Step6 If the termination conditions of the SPSO are satisfied, then terminate the learning of the SPSO and go to Step 8; Otherwise, go to Step 7 Step7 Generate the next generation population with the evolu- tionary rules of the SPSO in (11)-(15); Then, go to Step 3. Step8 Obtain the optimal individual, i.e. the optimal segmenta- tion point vector. Furthermore, get the set of time series segments associated with the optimal segmentation point vector. 1 1k s j j f itness DfitnessS k (16) min , i jij P f itness SDisP S (17) where j S (1, 2,,jk ), i P (1, 2,,ic) are the obtained time series segments and the pattern time series, respectively, Dis denotes the dissimilarity distance measure. Substituting (17) into (16), (16) can be refor- mulated as 1 1, P i c s ij ijD f itnessD DisPS k (18) 1,2, , ,min , i Pj jijh hc DSDisSPDisSP ,1,2,,ic (19) By comparing (18) with (1) (i.e. the objective func tion of K-means clustering), we find that the two objective functions are very similar if the same dissimilarity meas- ure is adopted. The only difference is the coefficient 1k in (18). In fact, the variable k only fluctuates in a nar- row range by some parameter controls [11,12]. So the presented algorithm in [11] can be approximately re- garded as a special case of the proposed CI-model based PTSS algorithms when the objective function of K- means clustering and GA optimization method are adopted for CI-model. In the exiting time series segmentation algorithms, the  Clustering-Inverse: A Generalized Model for Pattern-Based Tim e Series Segmentation Copyright © 2011 SciRes. JILSA 33 Gath-Geva fuzzy clustering algorithm is a representative one that has introduced the clustering technique for time series segmentation [4]. In our work, the clustering tech- niques are also introduced for this purpose. However, the two methods are very different. For the Gath-Geva clus- tering based method, the representative time series pat- terns are unknown. By the clustering procedure the rep- resentative time series patterns and the corresponding segmentation results are obtained. However, in our work, the proposed time segmentation algorithms are specially designed for the pattern based time series segmentation (PTSS), where the representative patterns have been known and the aim of time series segmentation is to get the similar time series segments which are similar to a certain pattern time series in the given pattern template set. Especially, the Gath-Geva clustering based method is to segment the time series by clustering procedure and the clustering centers can be obtained as the representa- tive patterns simultaneously, while the proposed method can be taken as the inverse procedure of clustering and the clustering centers, i.e. the representative patterns, are given ahead. 5. Experimental Studies In this section, the experimental study of the proposed CI-model is carried out. To effectively investigate the performance of the CI-model, we present a performance index in (20) to evaluate the segmentation results. 1 1, pi c evaeva ij ijD J DPS k (20) 1,2, ,max , i Pjjihc jh DSsimSP simSP (21) where evadtw l DDp and l p is the length of the warping path in the DTW measure; c and k are the number of the pattern time series and the obtained time series segments, respectively. The purpose of setting evadtwl DDp is to effectively reduce the influence of the difference in the length of different time series seg- ments. At present, there is no performance index that can be proved to be absolutely fair in all cases for evalu ating the segmentation results. For example, given two segmented results of a time series in a practical application, the re- sult with the worse performance index may be consi- dered much better by the expert. Therefore, a more elas- tic and appropriate evaluation index deserves further- more studying in future. In this study, all the experiments were carried out with the MATLAB code in the comput- er with 1 G ROM and 1.6 6 GHz CPU. 5.1. Segmentation Results Analysis In this subsection, to demonstrate the effectiv eness of the proposed CI-model, we report segmentation results of the CI-model based PTSS algorithm on a real-world stock time series. First, thea real-world stock time series are briefly described, and then the segmentation results are reported and discussed. 5.1.1. The Real-World Stock Time Series The adopted real-world stock time series R01 is shown in Figure 4(a) and a p attern template set is given in Figure 4(b). Here the real-world stock time series is adopted from [12]. For the real-world time series the pattern tem- plate set is used due to the fact that these pattern tem- plates are the important technique templates to segment the stock/index time series for the trend analysis of stock market. 5.1.2. Analyses of Segmentation Results Here, the segmentation results obtained by the CI-model based PTSS algorithm with the FCM objective function, the p ip D measure and the SPSO optimization are adopted for analysis purpose. In Figure 5, the obtained time series segments are labeled with the corresponding patterns. Each series segment is associated with one pat- tern in Figure 4(b). With the segmentation result, the 0200 400 6008001000 1200 1400 1600 1800 20 30 40 50 60 70 80 90 100 110 120 (a) 020 40 0 0. 5 1 Pattern A020 40 0 0. 5 1 Pattern B020 40 0 0. 5 1 Pattern C 020 40 0 0. 2 0. 4 0. 6 0. 8 1 Pattern D020 40 0 0. 2 0. 4 0. 6 0. 8 1 Pattern E020 40 0 0. 2 0. 4 0. 6 0. 8 1 Pattern F (b) Figure 4. The real-world stock times series and the pattern template set. (a) Real-world stock time series R01; (b) the pattern template set.  Clustering-Inverse: A Generalized Model for Pattern-Based Tim e Series Segmentation Copyright © 2011 SciRes. JILSA 34 Figure 5. Segmentation results of the time series R01 with dlen = 180. obtained time series mainly belong to the three classes associated with the pattern template A, D and F, respec- tively. From Table 3 we can see that although some time series are classified into the same class, their membership values are different. More higher the membership value, more possible the time segment belongs to the corres- ponding class. The obtained segmentation result is also quite valuable for further analysis. For example, the ex- pert may analyze the trend of stock market by these time series segments. 5.5. Image Segmentation Application In this subsection, we give an application of the CI- model based PTSS algorithm to gray image segmentation. Image thresholding is one of the important image seg- mentation methods, which can find some thresholds in the histogram of a gray image. In fact, image threshold- ing can be taken as a PTSS problem when the histogram of a gray image is viewed as a time series. Especially, a histogram time series usually contains the following rep- resentative technique patterns: peak and valley. The peaks and valleys usually indicate the existence of the sooth areas and edges. Therefore, a relative independent region of a gray image should correspond to a histogram time series segment which appears convex and is similar to one of pattern templates in Figure 6. By taking the image thresholding as a PTSS problem, we propose a PTSS based image thresholding algorithm with the fol- lowing steps. 1) Obtain the histogram of a gray image; 2) Take the gray histogram as a time series and present some representative template patterns; 3) Segment the time series with the CI-model based PTSS algorithm; 4) Take the obtained time series segmentation points as the thresholds for image thresholding. Two gray images, as shown in the left column of Fig- ure 7 are adopted to test the proposed image segmenta- tion algorithm. All the images h ave the gray level from 0 to 255. The length of histogram time series of each image is 256, as shown in the middle column of Figure 7. In our experiment, the pattern template set in Figure 6 is adopted for PTSS. In fact, some other similar pattern template set also can be adopted for the histogram time series segmentation. By large amounts of experiments, we find that with the similar pattern template sets, the segmentation results are usually approximately equiva- lent. In this experiment, the SPSO, the objective function Table 3. Segmentation results of the time series R01 with dlen = 18. Obtained segments i S Membership function ij u Labels of clusters No. i b i e Pattern A Pattern B Pattern C Pattern D Pattern E Pattern F 1 1 217 0.1417 0.0142 0.0111 0.7518 0.0391 0.0419 D 2 218 321 0.0005 9.23e-005 3.59e-005 0.9757 0.0024 0.0210 D 3 322 514 0.0272 0.0014 0.0285 0.7967 0.1432 0.0028 D 4 515 710 0.0010 6.03e-005 0.0013 0.9148 0.0824 0.0003 D 5 711 942 0.9584 0.0409 0.0003 0.0002 1.68e-005 0.0001 A 6 943 1053 0.0003 0.0002 8.28e-006 0.0150 0.0002 0.9842 F 7 1054 1287 0.0036 0.0006 0.0008 0.9217 0.0503 0.0228 D 8 1288 1426 0.8792 0.1193 0.0003 0.0005 3.69e-005 0.0006 A 9 1427 1581 0.9647 0.0350 0.0002 4.55e-005 4.05e-006 2.25e-005 A 10 1582 1685 0.9918 0.0079 7.67e-005 2.19e-005 2.13e-006 1.03e-005 A  Clustering-Inverse: A Generalized Model for Pattern-Based Tim e Series Segmentation Copyright © 2011 SciRes. JILSA 35 12 3 4 5 0 0.1 0.2 0.3 0.4 0.5 0.6 0.7 0.8 0.9 1 1 23 45 0 0.1 0.2 0.3 0.4 0.5 0.6 0.7 0.8 0.9 1 12 3 4 5 0 0.1 0.2 0.3 0.4 0.5 0.6 0.7 0.8 0.9 1 Figure 6. Proposed pattern template set for the histogram time series segmentation. of FCNN (10 ), the p dt D measure with 12 1, 1.5rr, and 255dlen Snum are adopted for the proposed image segmentation algorithm. Using Snum to denote the desired number of different image sections, the adopted images can be segmented into two sections with 2Snum. The right column of Figure 7 shows seg- mentation results of the four imag es. We can see that the obtained segmentation results are encouraging. As a novel method for image threshoding, the proposed algo- rithm is very promising. 6. Conclusions and Future Work In this study, a new interpretation for PTSS is presented and then a generalized CI-model is proposed. A detailed 0 50 100 150 200 250 300 0 500 1000 1500 2000 2500 0 50 100 150 200 250 300 0 1000 2000 3000 4000 5000 6000 Figure 7. Segmentation results of the four gray images by the proposed CI-model based PTSS algor ithm.  Clustering-Inverse: A Generalized Model for Pattern-Based Tim e Series Segmentation Copyright © 2011 SciRes. JILSA 36 algorithm is proposed to implement this model. The proposed CI-model deserves furthermore studying on many aspects in future, such as the objective functions, the optimization methods, and so on. Moreover, it is also very attractive to apply the proposed CI-model based PTSS algorithms to other research fields. For example, by integrating CI-model with the biomedicine knowledge, the proposed algorithms can be adopted to analyze the biomedicine signal. Although the proposed CI-model for PTSS has shown a promising performance, it still has the following dis- advantage. The proposed CI-model based PTSS algo- rithms usually need more parameters to implement time series segmentation. For example, when the p dt D meas- ure is adopted two parameters for control the number of the selected PISs are required. In order to make the pro- posed CI-model based PTSS algorithms more efficient, the further study for the choices of these parameters is very valuable. REFERENCES [1] D. Gubbins, “Time Series Analysis and Inverse Theory for Geophysicists,” Cambridge University Press, New York, 2004. [2] J. Kennedy and R. C. Eberhart, “A Discrete Version of the Particle Swarm Algorithm,” Proceedings of the Con- ference on Systems, Man and Cybernetics, Orlando, 12-15 October 1997, pp. 4104-4109. [3] S. D. Kim, J. W. Lee, J. W. Lee and J. Chae, “A Two-Phase Stock Trading System Using Distributional Differences,” Lecture Notes in Computer Science, Vol. 2453, 2002, pp. 399-423. doi:10.1007/3-540-45801-8_39 [4] J. Abonyi, B. Feil, S. Nemeth and P. Arva, “Modified Gath-Geva Clustering for Fuzzy Segmentation of Multi- variate Time-Series,” Fuzzy Sets and Systems, Vol. 149, No. 1, 2005, pp.39-56. doi:10.1016/j.fss.2004.07.008 [5] S. W. Kim and B. S. Jeong, “Performance Bottleneck of Subsequence Matching in Time-Series Databases: Ob- servation, Solution, and Performance Evaluation,” Infor- mation Sciences, Vol. 177, No. 22, 2007, pp. 4841-4858. doi:10.1016/j.ins.2007.06.032 [6] E. Keogh and S. Kasetty, “On the Need for Time Series Data Mining Benchmarks: A Survey and Empirical Demonstration,” Data Mining and Knowledge Discovery, Vol. 7, No. 4, 2002, pp. 349-371. doi:10.1023/A:1024988 512476 [7] R. Bellman, “On the Approximation of Curves by Line Segments Using Dynamic Programming,” Communica- tions of the ACM, Vol. 4, No. 6, 1961, p. 284. doi:10.11 45/366573.366611 [8] J. Himberg, K. Korpiaho, H. Mannila, J. Tikanmaki and H. T. T. Toivonen, “Time-Series Segmentation for Con- text Recognition in Mobile Devices,” Proceedings of IEEE Conference on Data Mining, 2001, pp. 203-210. doi:10.1109/ICDM.2001.989520 [9] C. L. Fancoua and J. C. Principe, “A Neighborhood Map of Competing One Step Predictors for Piecewise Seg- mentation and Identification of Time Series,” Proceed- ings of IEEE International Conference on Neural Net- works, 1996, pp. 1906-1911. [10] L. Feng, K. Ju and K. H. Chon, “A Method for Segmen- tation of Switching Dynamic Modes in Time Series,” IEEE Transactions on Systems, Man and Cybernetics, Part B: Cybernetics, Vol. 35, No. 5, 2005, pp. 1058-1064. doi:10.1109/TSMCB.2005.850174 [11] T. C. Fu, F. L. Chung, V. Ng and R. Luk, “Evolutionary Segmentation of Financial Ti me Series into Subsequences,” Proceedings of 2001 Congress on Evolutionary Compu- tation, Seoul, 27-30 May 2001, pp. 426-430. [12] F. L. Chung, T. C. Fu, V. Ng and R. Luk, “An Evolutio- nary Approach to Pattern-Based Time Series Segmenta- tion,” IEEE Transactions on Evolutionary Computation, Vol. 8, No. 5, 2004, pp. 471-489. doi:10.1109/TEVC.20 04.832863 [13] D. Berndt and J. Clifford, “Using Dynamic Time Warp- ing to Find Patterns in Time Series,” Proceedings of AAAI-94 Workshop on Knowledge Discovery in Data- bases, 1994, pp. 229-248. [14] M. Sato, Y. Sato and L. C. Jain, “Fuzzy Clustering Mod- els and Applications,” Physica-Verlag, New York, 1997. [15] D. Zhang and S. K. Pal, “A Fuzzy Clustering Neural Networks System Design Methodology,” IEEE Transac- tions on Neural networks, Vol. 11, 2002, pp. 1174-1177. doi:10.1109/72.870048 [16] C. Wang and S. Wang, “Supporting Content-Based Searches on Time Series via Approximation,” Proceed- ings of the 12th International Conference on Scientific and Statistical Database Management, Berlin, 26-28 July 2002, pp. 69-81. [17] J. Himberg, K. Korpiaho, H. Mannila, J. Tikanmaki and H. T. T. Toivonen, “Time-Series Segmentation for Con- text Recognition in Mobile Devices,” Proceedings of IEEE Conference on Data Mining, 2001, pp. 203-210. doi:10.1109/ICDM.2001.989520 [18] G. Kollios, M. Vlachos and G. Gunopulos, “Discovering Similar Multidimensional Trajectories,” Proceedings of 18th International Conference on Data Engineering, 2002. |