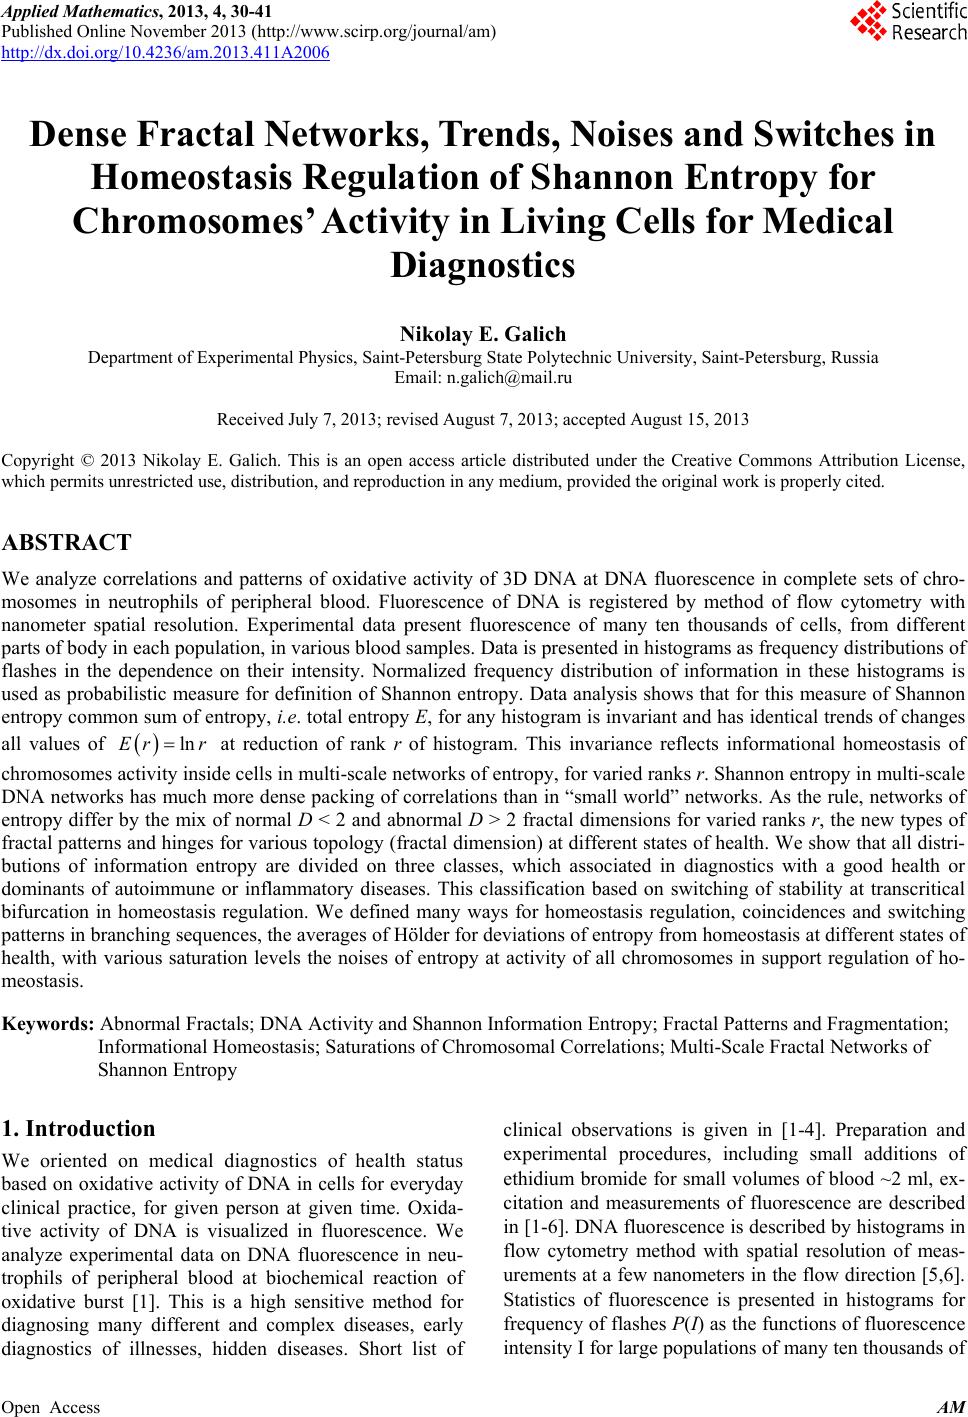
 Applied Mathematics, 2013, 4, 30-41 Published Online November 2013 (http://www.scirp.org/journal/am) http://dx.doi.org/10.4236/am.2013.411A2006 Open Access AM Dense Fractal Networks, Tr ends, Noises and Switches in Homeostasis Regulation of Shannon Entropy for Chromosomes’ Activity in Living Cells for Medical Diagnostics Nikolay E. Galich Department of Experimental Physics, Saint-Petersburg State Polytechnic University, Saint-Petersburg, Russia Email: n.galich@mail.ru Received July 7, 2013; revised August 7, 2013; accepted August 15, 2013 Copyright © 2013 Nikolay E. Galich. This is an open access article distributed under the Creative Commons Attribution License, which permits unrestricted use, distribution, and reproduction in any medium, provided the original work is properly cited. ABSTRACT We analyze correlations and patterns of oxidative activity of 3D DNA at DNA fluorescence in complete sets of chro- mosomes in neutrophils of peripheral blood. Fluorescence of DNA is registered by method of flow cytometry with nanometer spatial resolution. Experimental data present fluorescence of many ten thousands of cells, from different parts of body in each population, in various blood samples. Data is presented in histograms as frequency distributions of flashes in the dependence on their intensity. Normalized frequency distribution of information in these histograms is used as probabilistic measure for definition of Shannon entropy. Data analysis shows that for this measure of Shannon entropy common sum of entropy, i.e. total entropy E, for any histogram is invariant and has identical trends of changes all values of at reduction of rank r of histogram. This invariance reflects informational homeostasis of chromosomes activity inside cells in multi-scale networks of entropy, for varied ranks r. Shannon entropy in multi-scale DNA networks has much more dense packing of correlations than in “small world” networks. As the rule, networks of entropy differ by the mix of normal D < 2 and abnormal D > 2 fractal dimensions for varied ranks r, the new types of fractal patterns and hinges for various topology (fractal dimension) at different states of health. We show that all distri- butions of information entropy are divided on three classes, which associated in diagnostics with a good health or dominants of autoimmune or inflammatory diseases. This classification based on switching of stability at transcritical bifurcation in homeostasis regulation. We defined many ways for homeostasis regulation, coincidences and switching patterns in branching sequences, the averages of Hölder for deviations of entropy from homeostasis at different states of health, with various saturation levels the noises of entropy at activity of all chromosomes in support regulation of ho- meostasis. lnEr r Keywords: Abnormal Fractals; DNA Activity and Shannon Information Entropy; Fractal Patterns and Fragmentation; Informational Homeostasis; Saturations of Chromosomal Correlations; Multi-Scale Fractal Networks of Shannon Entropy 1. Introduction We oriented on medical diagnostics of health status based on oxidative activity of DNA in cells for everyday clinical practice, for given person at given time. Oxida- tive activity of DNA is visualized in fluorescence. We analyze experimental data on DNA fluorescence in neu- trophils of peripheral blood at biochemical reaction of oxidative burst [1]. This is a high sensitive method for diagnosing many different and complex diseases, early diagnostics of illnesses, hidden diseases. Short list of clinical observations is given in [1-4]. Preparation and experimental procedures, including small additions of ethidium bromide for small volumes of blood ~2 ml, ex- citation and measurements of fluorescence are described in [1-6]. DNA fluorescence is described by histograms in flow cytometry method with spatial resolution of meas- urements at a few nanometers in the flow direction [5,6]. Statistics of fluorescence is presented in histograms for frequency of flashes P(I) as the functions of fluorescence intensity I for large populations of many ten thousands of  N. E. GALICH 31 cells, living in different parts of human body. Chaotic Brownian motion and rotation of fluorescing cells, flow- ing through the laser beam in flow cytometry, ensured good statistics for illustration of real 3D chromosomal activity inside living cells. Accuracy and reproducibility of experimental results in histograms of fluorescence approximately equal to 2% that corresponds to the nor- mal, usual levels of inevitable and fatal errors and fluc- tuations of physical and biological nature [1-6]. Three original histograms, as the illustrations of typical exam- ples, are shown in Figure 1. The heterogeneous fluorescence of all chromosomes in the cells reflects simultaneously the genetic special, indi- vidual features and immune response to the pathogenic actions due to oxidative activity of DNA. Detailed accu- rate statistical analysis of these histograms currently is absent. Large-scale correlations for distributions of fluo- rescence flashes of DNA inside living cells differ from those that we would like to see by abnormal fractal di- mensions and non-trivial noise level at substantially non- Gaussian statistics [3-6]. These natural peculiarities of immunofluorescence are often accompanied by statis- tical instabilities of local intensity distributions [3-6], i.e. fast exponential growth of central moments of fluores- cence intensity. We need to develop a sequence of new nonlinear statistical methods for data analysis of im- munofluorescence. Standard smoothing eliminates de- stroys and removes various peculiarities of fractal net- works and correlations in the activity of DNA, changes real statistics, blurs and distorts many aspects of reality. According to tradition, now and in the latter time, dominating sciences about DNA based on various ap- proaches in biochemistry, structural biology, materials science and combinatorics for lonely DNA. In this case, (a) (b) Figure 1. Dependence of normalized frequency distribution of flashes P(I) on their intensity I (a); for clearest, only cen- tral part of histogram (b). The area under the final histo- grams of P(I) normalized to unit; rhombus points corre- spond to bronchial asthma. Total number of flashes is N0 = 76 623; quadrate points correspond to the healthy donor. Common number of flashes is N0 = 40 109; triangle points correspond to the oncology disease. Common number of flashes is N0 = 40 752. informational activities of DNA in real life inside living cell, for full set of 3D chromosomes, their overall com- munications and information flows, switches in topology and informational networks in the presence of real changeability and noises in information transfer are lost, go off, pushed back far into the background, as the basic unsolved problems. What it means for information trans- fer of DNA activity inside living cells, for diagnostics and comparative analysis of health and diseases? In Part 2 of this article we defined informational ho- meostasis of Shannon entropy as the empirical result. In Part 3 we analyze a density of packing, new types and classes of fractal networks of DNA entropy. In Part 4 we analyze deviations of entropy from homeostasis and various switches for central moments and averages of Holder at variations regulation of homeostasis for differ- ent states of health. We observe saturation for averages of Holder if the number of averages coincides with full chromosome number; all chromosomes are involved in support of regulation of informational homeostasis. The levels of saturations have various switching at changing the state of health. In Part 5 we show that this switching connected with stability change in homeostasis regula- tion. We show that all distributions of information en- tropy are divided on three classes, which associated in diagnostics with a good health or dominants of autoim- mune or inflammatory diseases. This classification based on switching of stability at transcritical bifurcation in the nonlinear dynamical system of homeostasis regulation. 2. Information on Oxidative Activity of DNA inside Cells. Shannon Entropy. Informational Homeostasis Oxidizing activity of DNA in the cells activates various (all possible) correlations with different combinations of non-coding and coding DNA fragments, both within one and the same chromosome, and between different chro- mosomes. Actual, 3D topology of chromosomal correla- tions in the nuclei of cells has quite notable changes over time, during only one month, for cells living inside given human, in the process of human life or at diseases de- velopment, during medical treatment, etc. [1-6]. Charac- teristics, changes and deviations various fractal correla- tions in networks of fluorescing DNA inside cells can be used for medical diagnostics [6]. How these results may to use for definition varied structures of informational activity of DNA? We all, all our chromosomes and all our cells are the open systems. How to estimate quality, quantity and changeability of DNA communications and DNA infor- mation transfer in life of given person? What about in- formation ln P and information entropy for DNA activity inside cells? What need for comparison various data on informational activity of DNA inside cells for Open Access AM  N. E. GALICH 32 one and the same human at various times and for differ- ent people? Here we have no clear criteria. How to de- termine the existence and level of information noise, switches, changeability and stability of information transfer inside living cells for any being? What it means for medical diagnostics from the point of view different types of oxidative metabolism of 3D DNA inside cells, for inner and inter chromosomal correlations at different states of health? The answers on these questions now are absent, that associated with deep and unsolved problems in fundamental mathematics, information theory, etc. To diagnostics features oxidizing activity of DNA in the blood cells for one and the same person at different times or in blood cells of different people need to com- pare various distributions of fluorescence, which are very diverse and changeable, as for three examples in Figure 1. A huge role here is played by the irregularity, infre- quency and brokenness of histograms, which define basic information on DNA activity [5-7]. Any artificial smooth- ing results destroy this information. For comparison various distributions of fluorescence we must under- stand the origin and function of these distributions under what conditions and parameters they need to be com- pared. For example, at Gaussian distribution of random variables is important to know only the mean and vari- ance. If the statistics is very complex, such parameters and their combinations can be very, very, many. Here observed non-trivial noises of fluorescence and the ex- ponential divergence central moments for fluctuations of intensity at increasing the number of central moments [3-5]. This is a clear sign of turbulence [3]. In this case, when comparing different distributions and moments for fluctuations of intensity the number of corresponding moments also exponentially quickly grows with increas- ing the order of diverging statistical moments. The simi- lar procedures of comparisons haven’t the sense in nature and in science, excluding examples and illustrations the growth for rate of statistical instabilities in the interpreta- tion of complexity. Reproducible results and clear analy- sis real activity various DNA inside cells produce the need of clear, stable levels and criteria for comparison different distributions of DNA fluorescence. Let us introduce frequency distribution of Shannon entropy , based on the frequency distribu- tions of information l ln li Ep i Ln l p P p Ln l (see Equations (1)-(3)). Three examples of frequency distributions of Shannon entropy i , based on the frequency distribu- tions of information l ln li Ep P in Figure 2(a), are shown in Figure 2(b). We present comparison of distri- butions of immunofluorescence based on the universal, empirical invariant of information entropy ,EJr at given rank r. Rank r is defined by the maximal number of measuring channels max ln r r. Detailed defi- nition of empirical invariant of information entropy ,lnEJr r is presented below, in Equations (4)-(7). This empirical invariant shown in Figure 2(c), as only one¸ overall numerical value of total Shannon entropy ,lnEJr r for given rank r, for DNA fluorescence inside any neutrophils, living in any people with different states of health. This invariant was observed during fluorescence of DNA in human neutrophils in different samples of blood [5,7], as in Figure 2(c). We observe only one unified value of total Shannon entropy , like the empirical invariant, as the identical sum in each given distribution of entropy, in given sample of blood, for all cells and any donor. This invariant has one and the same value of total Shannon entropy at fluo- rescence for given rank r of histograms, i.e. given scale ,lnEJr r ,lnEJr r (a) (b) (c) Figure 2. (a) Logarithmic dependence LnP(I) for frequency of flashes P(I) on their intensity I(r = 256); The area under the initial histograms of P(I) normalized to unit; Original histograms for P(I) shown in Figure 1; (b) Normalized dis- tributions of information entropy JI ,ln in the de- pendence on fluorescence intensity I(r = 256); rhombuses correspond to bronchial asthma. Total number of flashes is N0 = 76 623; squares correspond to the healthy donor, N0 = 40 109; cross correspond to the oncology disease. Common number of flashes is N0 = 40 752; (c) Dependence of total Shannon information entropy Jr r on logarithm of range r; initial histograms at range r = 256 show n in Fig- ures 1(a) and 2(b). Open Access AM  N. E. GALICH 33 of clusters in networks of DNA entropy. This invariant a very strong roughness and dif- fe defines the informational homeostasis of oxidative activ- ity of 3D DNA for full set of chromosomes inside living cells, at any biodiversity of cells for Shannon-Weaver index [5]. This invariant gives the overall zero level for countdown of information activity of DNA in cells for any person, at any state of health and for any genome of different people. In Figure 2(a) we see rences in information Ln IPI over a wide range of changing the ordeom zero up to ten; typical level of information is about J ~ 7. High level of noises instead of a smooth continuity for all local dis- tributions of information Ln r of values J(I) fr IPI reflects main natural properties of DNA provide main correlations in oxidative activity of DNA inside cells, in gene’s networks, in metabolism and cell viability. Any forced smoothing of experimental data here hampering any our attempts to adequate perception of real life DNA inside living cells and violates the homeostasis of en- tropy. Let activity, which us consider the probability density P(I). i.e. fre- quency distribution l P the number of flashes, 0l PNlN, where s the number of measuring 2,, 256; 0 Nis the total number of flashes; ber of flashes with the assignedIl; dimensionless intensity I coin- cides with the number measuring channel l, i.e. Il l i the of channel, 1,l NNl is intensity num ; 1 PI I is the mean probability value; max min symbol denotes the statistical average for number flashes oorescence in all of r = 256 channels of in- tensity measurement. The mean value of f flu P is equal to 1/256 for r = 256 channels of intensity msurement. Three examples of frequency distributions of l P for different donors with varied states of health are shon in Figure 1. Distributio ea n of information w l defined as Ln ll P (1) Let us consider the normalized m distribution of infor- ation 256 1 l ll l pJ J l (2) as the probabilistic measure for frequency distributions l E (3) Data analysis of all experiments has shown the con- se (4) Thus, total Shannon entropy E(J) is empirical invariant, fo of Shannon entropy l E ln , lll l EppEJIEJ rvation of total Shannon entropy 256i 1 const i i EJ E r all neutrophils in all donors [5,7]. Value of total en- tropy ,constEJ EJrr depends on given rank r of histod) and Equation (7)). Rank r is defined by the maximal number of measuring channels max gram (see Figure 2( r . At rank r = 256 all experimental data, for all dogive one and the same value of nors ,256 5.48EJr with standard deviation ~2% , l for flow cytometry experimental errors ~2% at 256 measuring channels [1,2]. Decreasing maximal number of channels or rank r leads to decreas- ing the value of invariant ,EJr .Three illustrations of informational homeostasistributions of informa- tion Ln il within limits of typica for dis P and entropy in Figures 2(a) and (b) are show 2(c) at different rank r. Other examples of informational homeostasis for different patients with various diseases had shown in [5]. Invariance of total entropy EJ n in Figure defines special ro ,r tropy le of distribution of Shannon en EJI , as is for all functions, associated with the conservation laws, as the main dominant variable to describe the states and dynamics of informational activity of DNA inside cells. How will be changing the information J(I) due to re- duction of rank r or the range r at definition of Shannon entropy? Here, as everywhere, are used different terms a rank r and range r for the same value of r. Range of his- togram r interconnected with the selection of multistage clusters in networks with structure of bronchial tree; here range r coincides with the number of columns in a histo- gram or with the number of channels for measurements of fluorescence intensity at given maximal value of di- mensionless intensity, i.e. max rI. In our experiments the number of channels is r ariations of range r, i.e. rank of histogram r, or variations the scale r, when max rI = 256. V , provide the changes in irregularity and broken- frequency distribution of fluorescence for histo- grams of various rank r. Various examples decreasing of histograms rank r presented in [3,5,7]. Integer r defines the total range r for distribution of entropy as maximal number of columns in reduced histogram. Each reduction of r leads to the redistribution of probability density ness of ,PIr and information , Ir. Reduced distribution bility of proba ,PIr describein [3]. Reduced distri- bution of information is ,ln, d Ir PIr . Normal- ized frequency of informreduction of range r is ation l pr during 1 ,Ln lr ll lll l prJrJr JrPr (5) Frequency distribution of entropy l Er for an arbi- trary rank r is ,ln li EJrpr pr l (6) Total entropy n is invariant 1 ,l lr ll l EJrpp Open Access AM 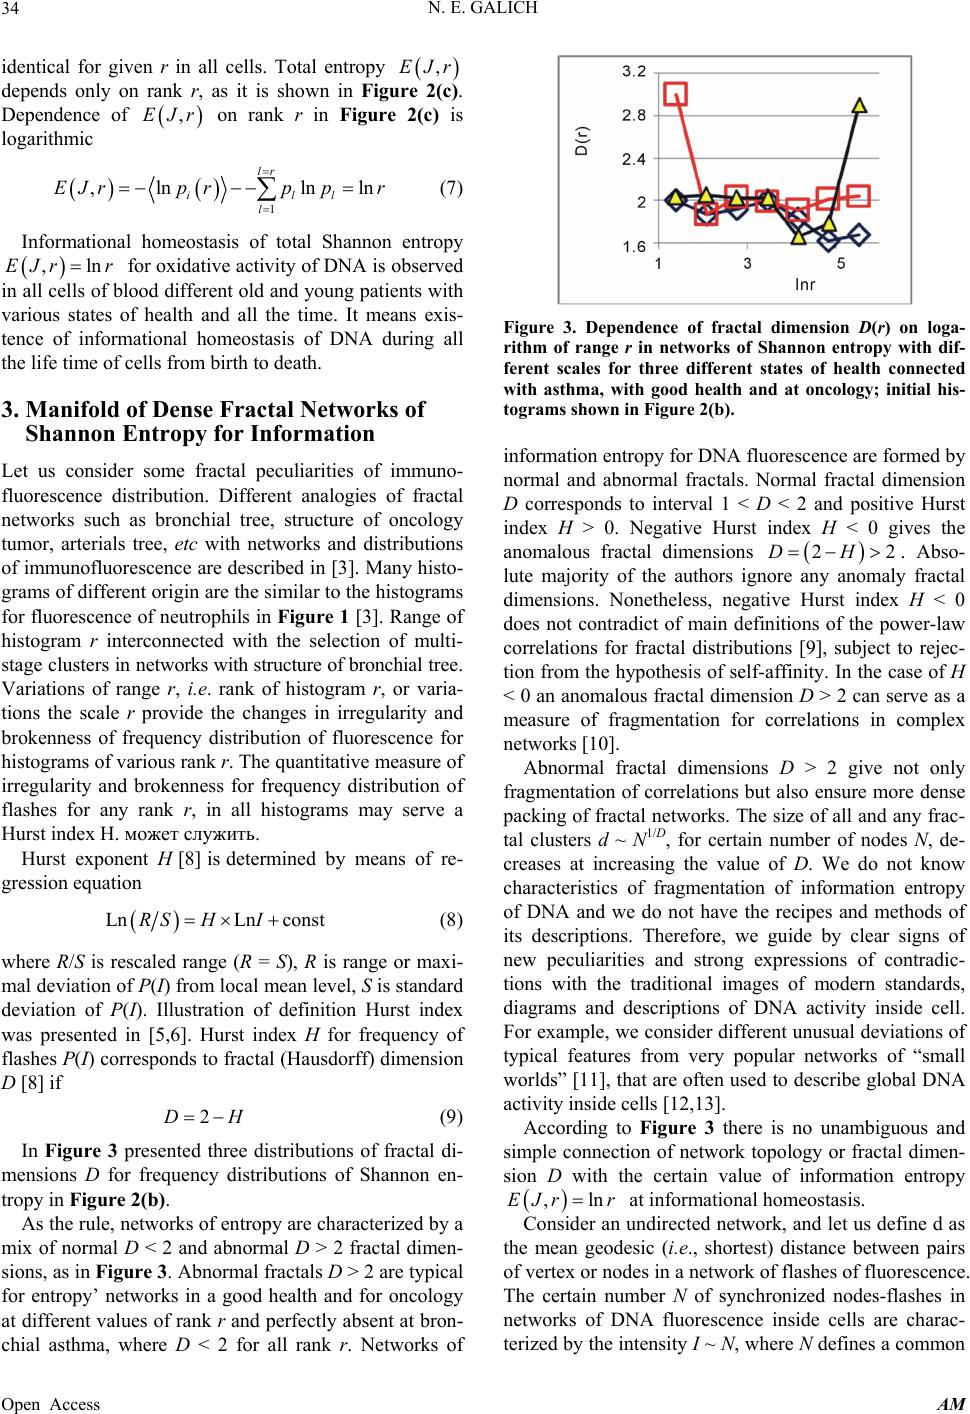 N. E. GALICH 34 id in all cells. Total enentical for given rtropy ,EJr pends only on rank n Figure 2(c). de r, as it is shown i Dependence of ,EJr on rank r in Figure logarithmic 2(c) is 1 , lnln lr EJrp pr (7) ln il l l p r Informational homeostasis of total Shannon for oxidative activity of DNA is observed various states tion no- fluof fractal entropy ,lnEJrr in all cells of blood different old and young patients with of health and all the time. It means exis- tence of informational homeostasis of DNA during all the life time of cells from birth to death. 3. Manifold of Dense Fractal Networks of Shannon Entropy for Informa Let us consider some fractal peculiarities of immu orescence distribution. Different analogies networks such as bronchial tree, structure of oncology tumor, arterials tree, etc with networks and distributions of immunofluorescence are described in [3]. Many histo- grams of different origin are the similar to the histograms for fluorescence of neutrophils in Figure 1 [3]. Range of histogram r interconnected with the selection of multi- stage clusters in networks with structure of bronchial tree. Variations of range r, i.e. rank of histogram r, or varia- tions the scale r provide the changes in irregularity and brokenness of frequency distribution of fluorescence for histograms of various rank r. The quantitative measure of irregularity and brokenness for frequency distribution of flashes for any rank r, in all histograms may serve a Hurst index H. может служить. Hurst exponent H [8] is determined by means of re- gression equation LnLn constRS HI (8) where R/S is rescaled range (R = S), R is mal deviation of P(I) from local mean le ure 3 presented three distributions of fractal di- mensions D for frequency di tro range or maxi- vel, S is standard deviation of P(I). Illustration of definition Hurst index was presented in [5,6]. Hurst index H for frequency of flashes P(I) corresponds to fractal (Hausdorff) dimension D [8] if 2DH (9) In Fig stributions of Shannon en- py in Figure 2(b). As the rule, networks of entropy are characterized by a mix of normal D < 2 and abnormal D > 2 fractal dimen- sions, as in Figure 3. Abnormal fractals D > 2 are typical for entropy’ networks in a good health and for oncology at different values of rank r and perfectly absent at bron- chial asthma, where D < 2 for all rank r. Networks of Figure 3. Dependence of fractal dimension D(r) on loga- rithm of range r in networks of Shannon entropy with dif- ferent scales for three different states of health conected . Normal fractal dimension corresponds to interval 1 < D < 2 and positive Hurst of the po orks. The size of all and any frac- ta e of information entropy n with asthma, with good health and at oncology; initial his- tograms shown in Figure 2(b). information entropy for DNA fluorescence are formed by normal and abnormal fractals D index H > 0. Negative Hurst index H < 0 gives the anomalous fractal dimensions 22DH . Abso- lute majority of the authors ignore any anomaly fractal dimensions. Nonetheless, negative Hurst index H < 0 does not contradict of main definitions wer-law correlations for fractal distributions [9], subject to rejec- tion from the hypothesis of self-affinity. In the case of H < 0 an anomalous fractal dimension D > 2 can serve as a measure of fragmentation for correlations in complex networks [10]. Abnormal fractal dimensions D > 2 give not only fragmentation of correlations but also ensure more dense packing of fractal netw l clusters d ~ N1/D, for certain number of nodes N, de- creases at increasing the value of D. We do not know characteristics of fragmentation of information entropy of DNA and we do not have the recipes and methods of its descriptions. Therefore, we guide by clear signs of new peculiarities and strong expressions of contradic- tions with the traditional images of modern standards, diagrams and descriptions of DNA activity inside cell. For example, we consider different unusual deviations of typical features from very popular networks of “small worlds” [11], that are often used to describe global DNA activity inside cells [12,13]. According to Figure 3 there is no unambiguous and simple connection of network topology or fractal dimen- sion D with the certain valu ,lnJrr at informational homeostasis. Consider an undirected network, and let us define d as the mean geodesic (i.e., shortest) distance between pairs odes in a network of flashes of fl E of vertex or nuorescence. The certain number N of synchronized nodes-flashes in networks of DNA fluorescence inside cells are charac- terized by the intensity I ~ N, where N defines a common Open Access AM 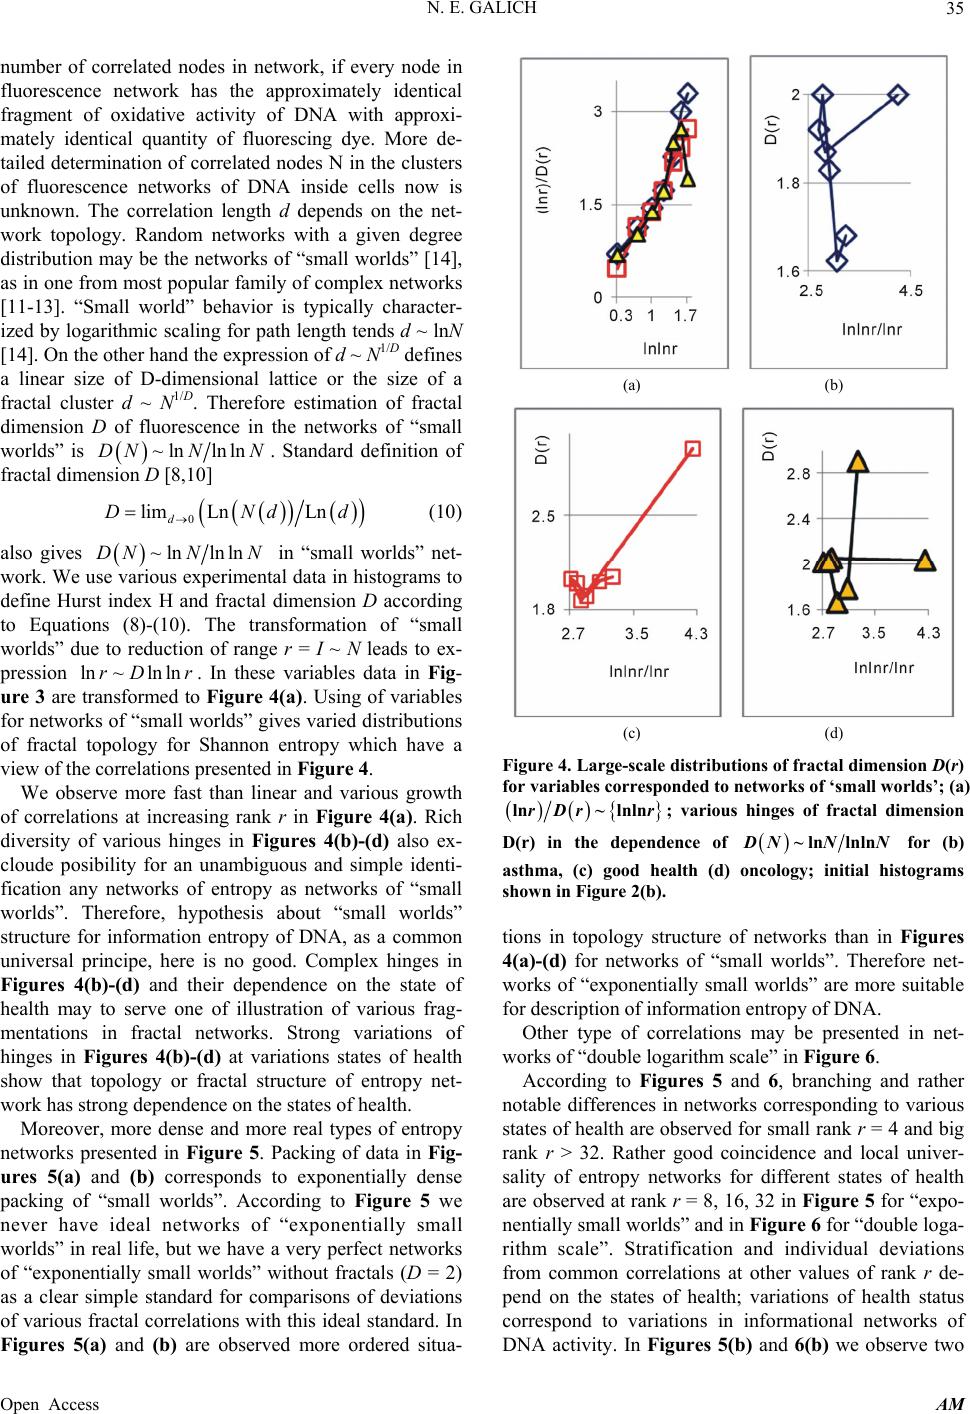 N. E. GALICH 35 number of correlated nodes in network, if every node in fluorescence network has the approximately identical fragment of oxidative activity of DNA with approxi- mately identical quantity of fluorescing dye. More de- tailed determination of correlated nodes N in the clusters of fluorescence networks of DNA inside cells now is unknown. The correlation length d depends on the net- work topology. Random networks with a given degree distribution may be the networks of “small worlds” [14], as in one from most popular family of complex networks [11-13]. “Small world” behavior is typically character- ized by logarithmic scaling for path length tends d ~ lnN [14]. On the other hand the expression of d ~ N1/D defines a linear size of D-dimensional lattice or the size of a fractal cluster d ~ N1/D. Therefore estimation of fractal dimension D of fluorescence in the networks of “small worlds” is ~lnlnlnDNN N. Standard definition of fractal dimension D [8,10] 0 lim LnLnDNdd (10) also gives d ~lnlnDNNlnN in “small worlds” net- work. We use various experimental data in h define Hurst index H and fractal dimension D (8)-(10). The tr topology for ) also ex- cl ense pa istograms to according to Equationsansformation of “small worlds” due to reduction of range r = I ~ N leads to ex- pression ln~ln lnrD r. In these variables data in Fig- ure 3 are transformed to Figure 4(a). Using of variables for networks of “small worlds” gives varied distributions of fractal Shannon entropy which have a view of the correlations presented in Figure 4. We observe more fast than linear and various growth of correlations at increasing rank r in Figure 4(a). Rich diversity of various hinges in Figures 4(b)-(d oude posibility for an unambiguous and simple identi- fication any networks of entropy as networks of “small worlds”. Therefore, hypothesis about “small worlds” structure for information entropy of DNA, as a common universal principe, here is no good. Complex hinges in Figures 4(b)-(d) and their dependence on the state of health may to serve one of illustration of various frag- mentations in fractal networks. Strong variations of hinges in Figures 4(b)-(d) at variations states of health show that topology or fractal structure of entropy net- work has strong dependence on the states of health. Moreover, more dense and more real types of entropy networks presented in Figure 5. Packing of data in Fig- ures 5(a) and (b) corresponds to exponentially d cking of “small worlds”. According to Figure 5 we never have ideal networks of “exponentially small worlds” in real life, but we have a very perfect networks of “exponentially small worlds” without fractals (D = 2) as a clear simple standard for comparisons of deviations of various fractal correlations with this ideal standard. In Figures 5(a) and (b) are observed more ordered situa- (a) (b) (c) (d) Figure 4. Large-scale distri butions of fractal dime nsion D( for variables corresponded to networks of ‘small worlds’; (a) r) ln~ lrDr tal dimension nlnr; various hinges of frac D(r) in the dependence of ~ln lnln NNN for (b) asthma, (c) good health (d) oncology; initial histograms tions in topology structure of networks than in Figures 4(a)-(d) for networks shown in Figure 2(b). of “small worlds”. Therefore net- orks of “exponentially small worlds” are more suitable nd rather no ig ra w for description of information entropy of DNA. Other type of correlations may be presented in net- works of “double logarithm scale” in Figure 6. According to Figures 5 and 6, branching a table differences in networks corresponding to various states of health are observed for small rank r = 4 and b nk r > 32. Rather good coincidence and local univer- sality of entropy networks for different states of health are observed at rank r = 8, 16, 32 in Figure 5 for “expo- nentially small worlds” and in Figure 6 for “double loga- rithm scale”. Stratification and individual deviations from common correlations at other values of rank r de- pend on the states of health; variations of health status correspond to variations in informational networks of DNA activity. In Figures 5(b) and 6(b) we observe two Open Access AM  N. E. GALICH 36 (a) (b) Figure 5. Dependences of fractal dimension D(r) on double logarithm of range r in the variables for ‘exponentiall small worlds’ y (a) lnln~ lnlnrDr r (b) lnln~ lnlnlnrDrr r in multi-scale networks of “real worlds” and in nially sm for information e of “exponentially small worlds”, without fractals (D = 2), corresponds to violet line with round dots; initial histogr ams show n in Fi gure 2(b). etworks of “exponentall worlds” ntropy of fluorescing DNA inside neutr on- phils; the ideal network (a) (b) Figure 6. Dependences of fractal dimension D(r) on double logarithm of range r in the variables for “double logarith- mic scale” (a) 2 lnln~ ln rr (b) lnln~lnlnln rr r in inside neutrophils; the ideal network ratification and branching of fractal ructures for DNA information entropy shape and define nd Switches for Holder’s Averages wh uations duof stability near homeostasis. These multiscale networks of “real worlds” and in networks of “double logarithmic scale” for for information entropy of fluorescing DNA of “double logarithmic scale”, without fractals (D = 2), corre- sponds to violet line with round dots; initial histograms shown in Figure 2(b). different branches for small and big values of rank r in the point of r = 16. St st various alternative ways of transmitting information. Dif- ferent alternative means of information communication for the global network of DNA inside cells ensure by local networks of different clusters with the same topol- ogy (identical D) at different scales of r or at varied values of entropy (E = lnr) in the dependence the states of health, as in Figure 3. The same fractal dimension D can match the clusters of different scales r with a different number of flashes. Currently we don’t now other clear details of fragmentation. We have no univer- sality in informational networks of DNA, only perfect etalon, as theoretical measure for estimations of informa- tion communications in the not existing in real life and ideal cells, which presented here as violet lines in Fig- ures 5 and 6 for an ideal case D = 2. Reality connected with variations of homeostasis regulation, i.e. with chang- ing noises of information entropy for DNA activity dur- ing life of cell. 4. Noise of Entropy in Homeostasis Support. Patterns a We have no of ideal, absolute, correct homeostasis, no- ere and never. We always observe various fluct ring regulation fluctuations also very individual and consist many in- formation on stability regulation the dynamic equilibrium in homeostasis. Let us consider various deviations, fluc- tuations or noise of entropy l er near homeostasis of total information entropy ,EJr ,1, ln lll ll erEr EJrErprpr (10) Mean characteristics for individual distributions of noises in a blood sample defined by the central mo and Holder’s averages for noises of entropy ments l er . The central moments of m er for fluctuations of entropy l er near homeostasis defined by the statis- tical averages , m erMer m, (11) where m determ , er m. ines the order of moment Here symbol ... denotes statistical tuations of entropy average for fluc- l er. The power means or averages of Hölder for deviations of entropy l er a re 1 1 1 , lr m m l l emr e r Three illustrations for distribution of central moments (12) 4, er m and of averages of Hölder 4,er m at distr rank r = 4 presented in Figure 7. These rank r = 4 for inf. Two branch ibutions are determined on the base of histograms of ormation entropy in Figure 8 es with even and odd numbers m of central Open Access AM  N. E. GALICH 37 (a) (b) Figure 7. (a) Logarithmic distributions of central statistical moments ,Mer m homeostasis for bronchial as sented in F for fluctuations of entropy thma (rhombuses), fo e(r) near r a good health (quadrates), for oncology (triangles); initial histo- grams preigure 8; lower and upper branches correspond to the even 2,4,6,m and odd 1,3,5,m; (b) Distributions for averages of Hölder ,emr with different number m at fluctuations of entropy e(r) near ho- meostasis for bronchihombuses),d health (quadrates), for oncology (triangles)histo- grams presented in Figure 8; upper and lower branches correspond to the even 2,4,6,m and odd 1,3,5,m. al asthma (r for a ; initial goo Figure 8. Dependence of normalized distributions of Shan- non entropy E(I, r = 4) on intensity I at rank r = 4. The con- tinuous lines correspond to the parabolic apps of roximation probability density distributions, three types of lines cor- respond to different types of stability for transcritical bi- furcation in homeostasis regulation, at change the states of health; initial histograms shown in Figure 2(b). moments , erm have unique universality with zero and clear exponential decreasing of , er m, as in Fi he exponential decreasing gure 7(a). T of , er mthe informational stability of DNA activity. Decreasing rate of , provides mr to growth at increasing numbers m and r. A very slow erages of Hölder have trends growth for av,emr in Figure 7(b) clearly defines individual level of ns and auto- correlations of entropy ,emr at homeostasis for central moments fluctuatio u quickgiven person, unlike ofnified and degradation of , er m, as in ure 7(a). Averages of Hölder Fig ,emr define various orders of autocorrelation, at varioers of m, for fluctua- tions of entropy near the “centre of gravity” in stability regulation the dybrium in homeostasis. us numb namic equiliAc- co all devrding to Figure 7(b)iations of entropy, for various individual distributions of ,emr from zero level, increase with increasing the number of m, with various saturations of chromosomal correlations of en- tropy at different states of health until the value of m = 46, which defines the number of mes inside cells. Therefore, the value of chromoso 46,em r is the largest among all mean. Therefore, overall level of en- tropy noise defined by the values of 46,em r , according to a well known inequality 1, ,em remr for Hes. This means, also, that all 46 chromosomes involved in support regulation of homeostasis inside cells, as ont. All distributions of older’s averag e united full se ,emr in F reasing of m. Two branches with even and odd numbers m correspond to the negative and positive values of igure 7(b) have an oscillatory behavior at inc ,emr . These oscillations with pe Figure r is define riod 1 not specified in 7(b); the mandatory be- havior doesn’t needing in comments. Average noise level of information entropy in DNA activity at given range d by the standard devia- tion 12 2 1 ,, km emr ekr 1k m ,emrof for formation transfer of DNA activity inside cells. These of m = 46. These are very important characteristics for in- levels 46,em r rages of Höld defined byf 46 for all aveer all values o m = ,emr , but not only the lower numbers of 1, 2m ; we have 46 chromosomes in the cells and many types of cross-correlations. Noise of entropy orevel for one chromosome, de- fined by the values of average noise l 46,rem , in DNA activity ensures contrast ination transfer and correlations inside cells at given scale r for any networks of DNA activity. Value of inform ,emr depends on health status. In Figure 7(b) maximal noise level 46, 418%emr corresponds to strong in- flammations at asthma. Distributions of ,emr s define stable and clear classification of noise lation of homeostasis, for given pe. itching observed for distribution of in Figure 7(b) depend on the health status. These distribution level in networks of entropy for DNA activity at regu rson at given time We observe very strong switching of branches for r = 4 in the averages of Hölder in Figure 7(b) for asthma with respect the same branches for a good health and oncology. The same sw central moments , er m in Figure 7(a). Analy- sis show that distributions of various other averages of Open Access AM 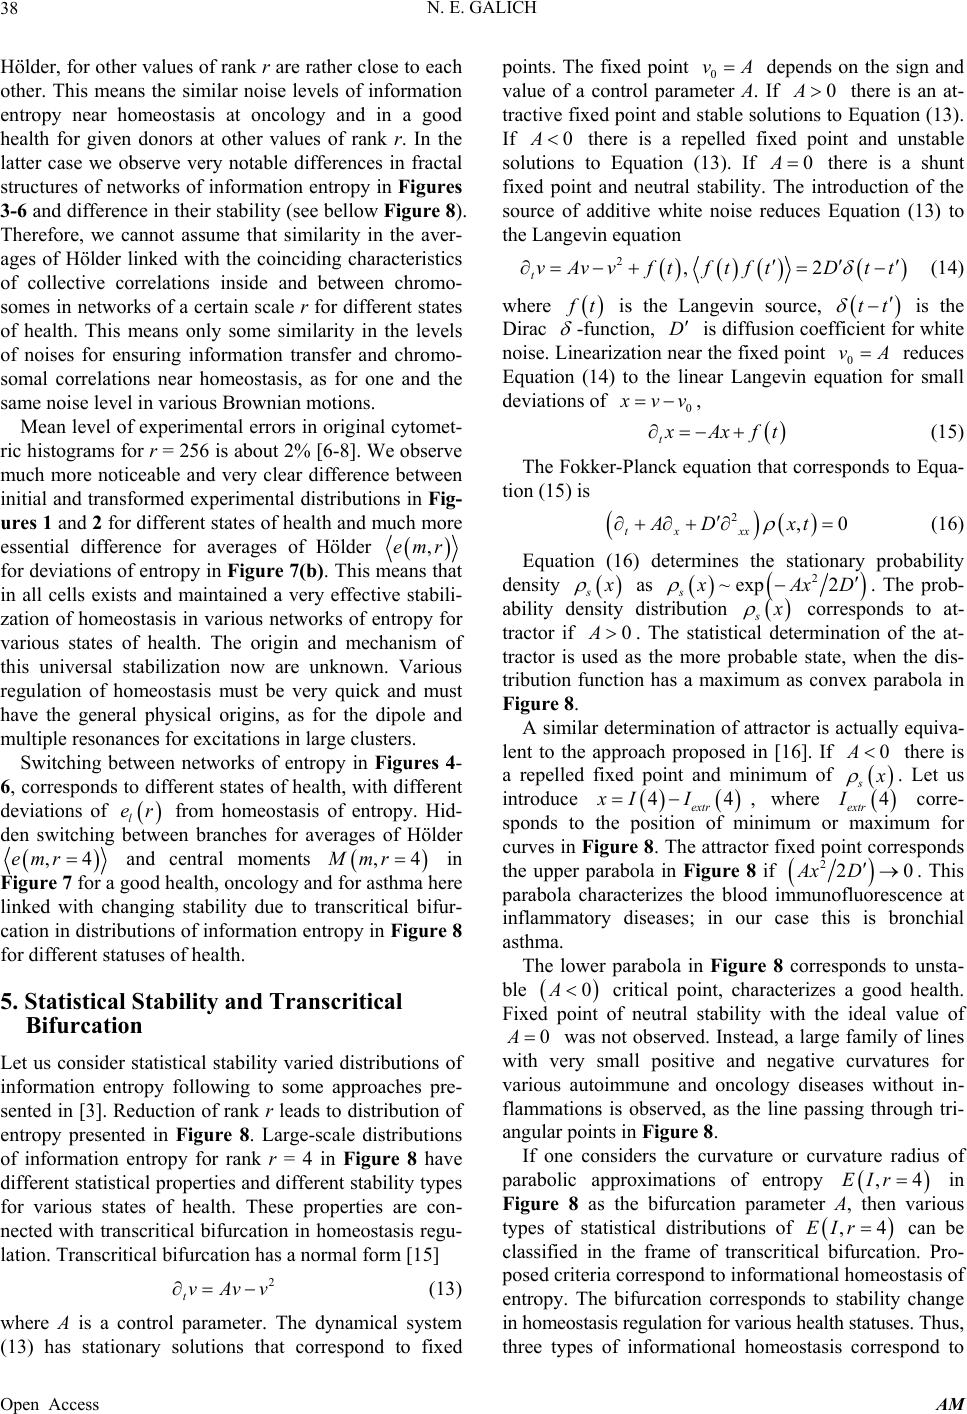 N. E. GALICH 38 Hölder, for other values of rank r are rather close to each other. This means the similar noise levels of information entropy near homeocology and in a good health for given donors at other values of rank r. In the latter case we observe very notable differences in fractal structures of networks of information entropy in Figures 3-6 and difference in their stability (see bellow Figure 8). Therefore, we cannot assume that similarity in the aver- ages of Hölder linked with the coinciding characteristics of collective correlations inside and between chromo- somes in networks of a certain scale r for different states of health. This means only some similarity in the levels of noises for ensuring information transfer and chromo- somal correlations near homeostasis, as for one and the same noise level in various Brownian motions. Mean level of experimental errors in original cytomet- ric histograms for r = 256 is about 2% [6-8]. We observe much more noticeable and very clear difference between initial and transformed experimental distribution stasis at on s in Fig- ures 1 and 2 for different states of health and much more essential difference for averages of Hölder ,emr for deviations of entropy in Figure 7(b). This means that in all cells exists and maintained a very effective stabili- zation of homeostasis in various networks of entropy for various states of health. The origin and mechf this universal stabilization now are unknown. Various regulation of homeostasis must be very quick and must have the general physical origins, as for the dipole and multiple resonances for excitations in large clusters. Switching between networks of entropy in Figures 4- 6, corresponds to different states of health, with different deviations of l er from homeostasis of entropy. Hid- den switching between branches for averages of Hö anism o lder ,4mr and central moments ,4Mmre in Figure 7 for a good health, oncology and for asthma here linked with chg stability due to transcritical bifur- cation in distributions of information entropy in Figure 8 tatuses of health. 5. Statistical Stability and Transcritical Bifurcation Let us consider statistical stabil angin for different s ity varied distributions of pre- n of en Figure 8. Large-scale distributions (13) has stationary solutions that correspond to fixed information entropy following to some approaches sented in [3]. Reduction of rank r leads to distributio tropy presented in of information entropy for rank r = 4 in Figure 8 have different statistical properties and different stability types for various states of health. These properties are con- nected with transcritical bifurcation in homeostasis regu- lation. Transcritical bifurcation has a normal form [15] 2 tvAvv (13) where A is a control parameter. The dynamical system points. The fixed point 0 vA depends on the sign and value of a control param. If tractive fixed point eter A and stable solutions 0A there is an at- to Equation (13). If 0A there is a repelled fixed point and unstable solutions to Equation (13). If 0A there is a shunt fixed point and neutral sy. The introduction of the source of additive white noise reduquation (13) to the Langevin equation tabilit ces E 2,2 tvAvvftftftDt t (14) where t is the Langevin source, tt is the Dirac -function, D is diffusion coefficient for white noise. Linearization near the fixed pointduces linear Langevin eq deviatio 0 vA re uation forEquation (14) to ns of the small 0 vv , t Axft (15) The Fokker-Planck equation that corres to Equa- tion (15) is ponds 2,0 tx xx AD xt (16) Equation (16) determines the de stationary probability nsity s as 2 ~exp 2 s Ax D . The prob- ability density distribution s corresponds to at- tractor if . The statistical determina tractor is used as the more probable state, tri . attract appro 0Ation of the at- when the dis- bution function has a maximum as convex parabola in Figure 8 A similar determination of or is actually equiva- lent to theach proposed in [16]. If 0A there is a repelled fixed point and minimum of s . Let us introduce 44 extr xI I , where 4 extr I corre- sponds to the position of minimumum for cu or maxim rves in Figure 8. The attractor fixed point corresponds the upper parabola in Figure 8 if 220Ax . This parabola characterizes the blood immunofcence at inflammato onchial asthma. The lower parabola in Figure 8 corresponds to unsta- ble D luores ry diseases; in our case this is br 0A critical point, characealth. Fixed point of neutral stability with the ideal value of 0A terizes a good h was not observed. Instead, a large family of lines with very small positive and negative curvatures for va mations If o rious autoimmune and oncology diseases without in- flam is observed, as the line passing through tri- angular points in Figure 8. ne considers the curvature or curvature radius of parabolic approximations of entropy ,4EIr in Figure 8 as the bifurcation parameter A, then various types of statistical distributions of ,4EIr can be classified in the frame of trPro- po tasis corre anscritical bifurcation. sed criteria correspond to informational homeostasis of entropy. The bifurcation corresponds to stability change in homeostasis regulation for various health statuses. Thus, three types of informational homeosspond to Open Access AM 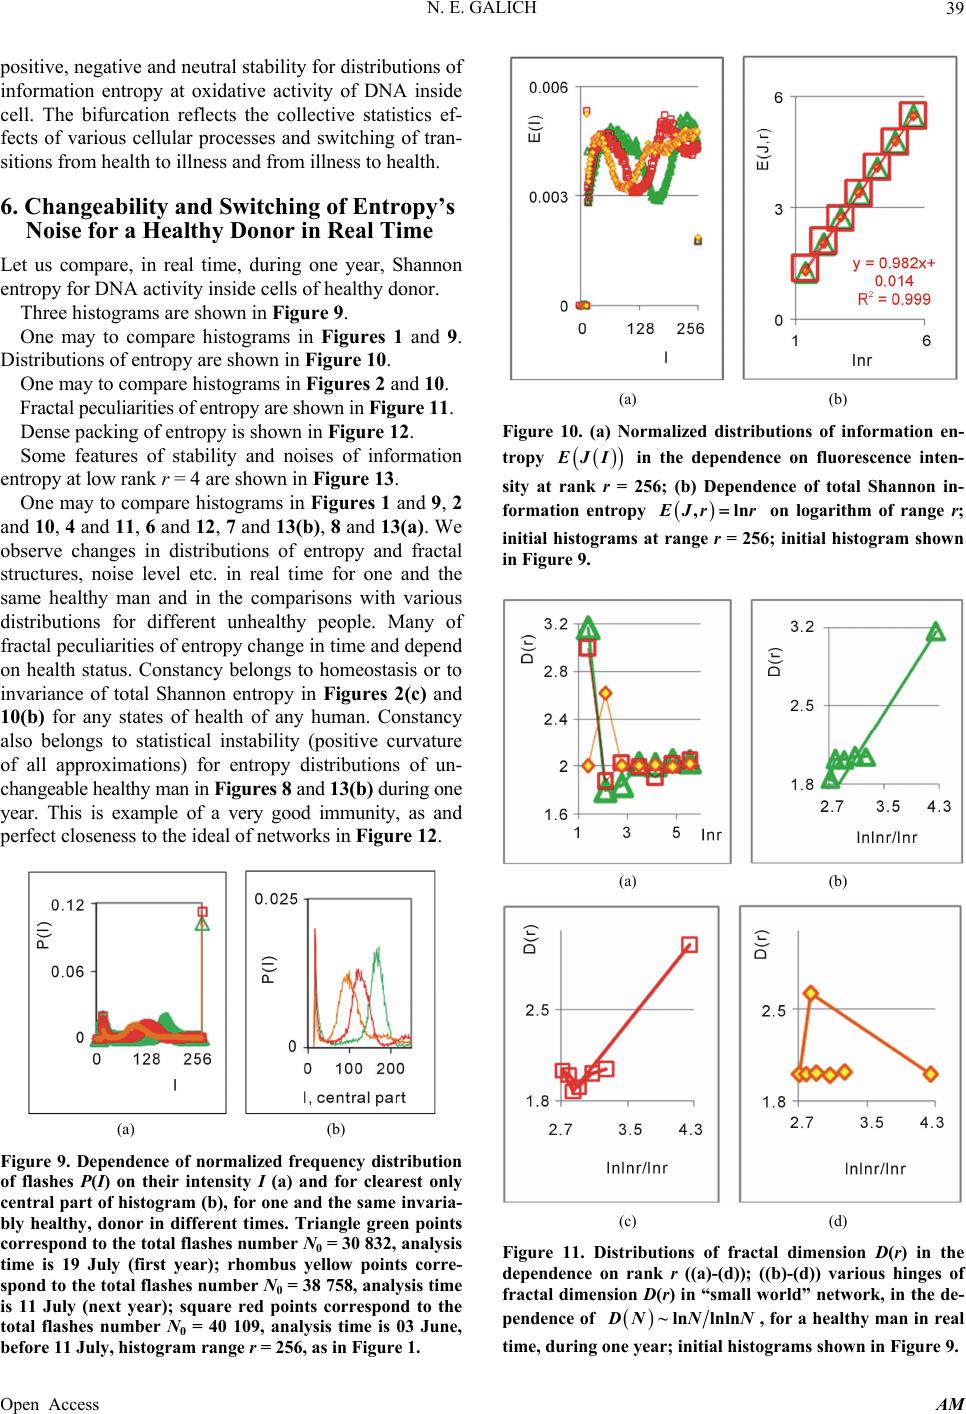 N. E. GALICH 39 positive, negative and neutral stability for distributions of information entropy at oxidative activity of DNA inside cell. The bifurcation reflects the collective statistics ef- fects of various cellular processes and switching of tran- sitions from health to illness and from illness to health. 6. Changeability and Switching of Entropy’s Noise for a Healthy Donor in Real Time Let us compare, in real time, during one year, Shannon entropy for DNA activity inside cells of healthy donor. Three histograms are shown in Figure 9. One may to compare histograms in Figures 1 and 9. stributions of entropy are shown in Figure 10. Di . re 12. an obactal st ous di One may to compare histograms in Figures 2 and 10. Fractal peculiarities of entropy are shown in Figure 11 Dense packing of entropy is shown in Figu Some features of stability and noises of information entropy at low rank r = 4 are shown in Figure 13. One may to compare histograms in Figures 1 and 9, 2 d 10, 4 and 11, 6 and 12 , 7 and 13(b), 8 and 13(a ). We serve changes in distributions of entropy and fr ructures, noise level etc. in real time for one and the same healthy man and in the comparisons with vari stributions for different unhealthy people. Many of fractal peculiarities of entropy change in time and depend on health status. Constancy belongs to homeostasis or to invariance of total Shannon entropy in Figures 2(c) and 10(b) for any states of health of any human. Constancy also belongs to statistical instability (positive curvature of all approximations) for entropy distributions of un- changeable healthy man in Figures 8 and 13(b) during one year. This is example of a very good immunity, as and perfect closeness to the ideal of networks in Figure 12. (a) (b) Figure 9. Dependence of normalized frequency distribution of flashes P(I) on their intensity I (a) and for clearest only central part of histogram (b), for one and the same invaria- bly healthy, donor in different times. Triangle green pots correspond to 832, analysis in the total flashes number N0 = 30 time is 19 July (first year); rhombus yellow points corre- spond to the total flashes number N0 = 38 758, analysis time is 11 July (next year); square red points correspond to the total flashes number N0 = 40 109, analysis time is 03 June, before 11 July, histogram range r = 256, as in Figure 1. (a) (b) Figure 10. (a) Normalized distributions of information en- tropy JI at rank r entrop in the dependence on fluorescence inten- sity = 256; (b) Dependence of total Shannon in- formationy ,ln Jr r on logarithm of range r; initial histograms at range r = 256; initial histogram shown in Figure 9. (a) (b) (c) (d) Figure 11. Distributions of fractal dimension D(r) in the dependence on rank r ((a)-(d)); ((b)-(d)) various hinges of fractal dimension D(r) in “sma ll world” network, in the de- pendence of ~ln lnln NNN, for a healthy man in rea time, during on in Figure 9. l e year; initial histograms shown Open Access AM 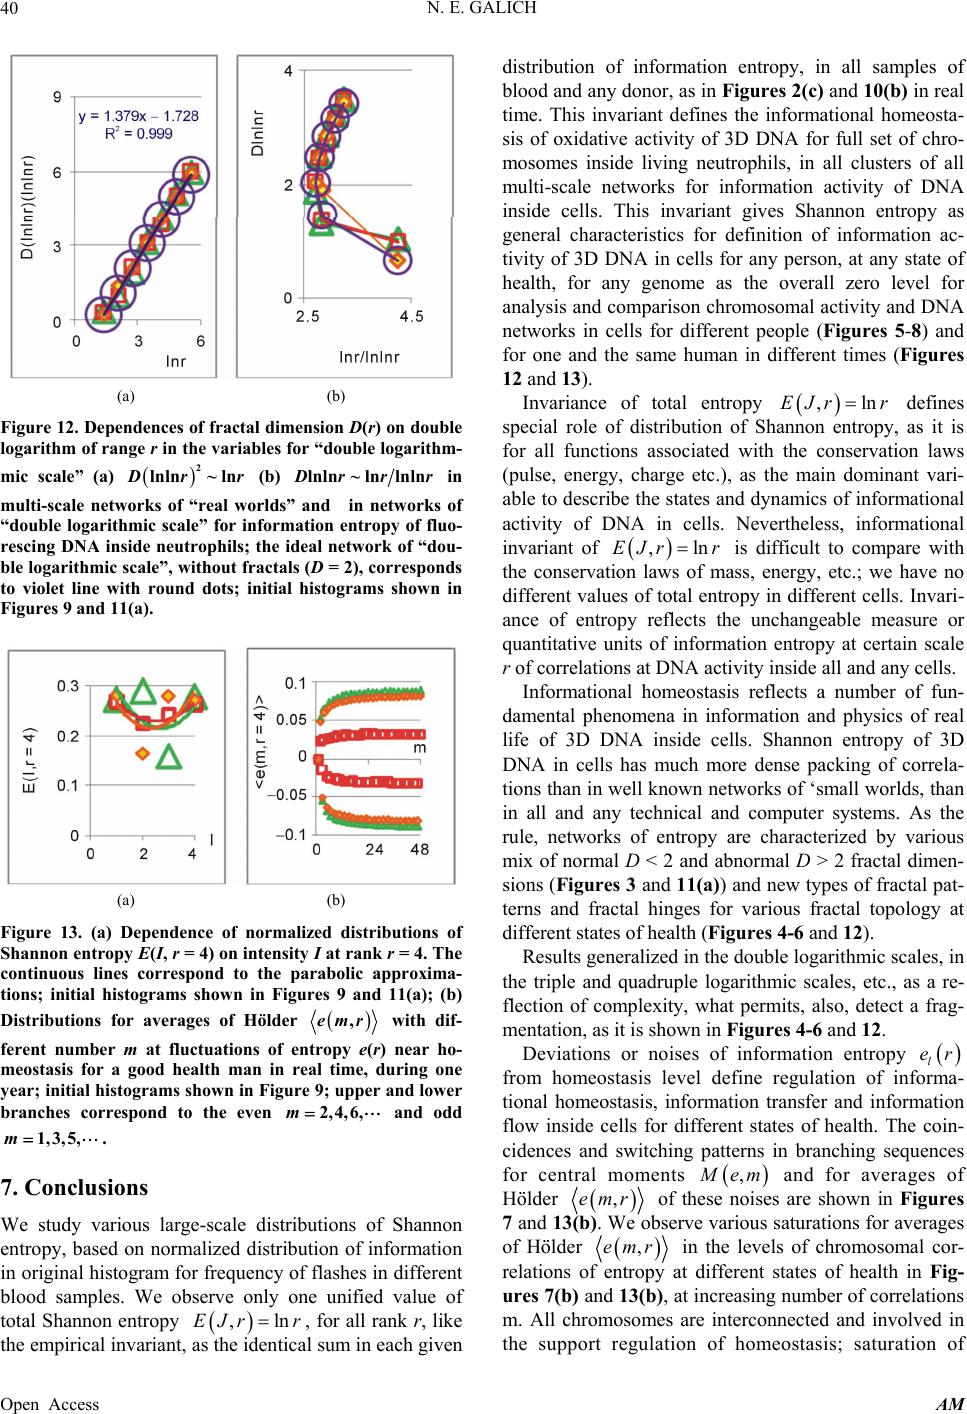 N. E. GALICH 40 (a) (b) Figure 12. Dependenc es of fractal dimension D(r) on double logarithm of range r in the variables for “double logarithm- mic scale” (a) 2 lnln~ ln rr (b) lnln~lnlnln rr r multi-scale net networks of “double logarit ound dots; ihistograms shown in works of “real worlds” and in hmic scale” for information entropy of fluo- rescing DNA inside neutrophils; the ideal network of “dou- ble logarithmic scale”, without fractals (D = 2), corre sponds to violet line with rnitial in Figures 9 and 11(a). (a) (b) Figure 13. (a) Dependence of normalized distributions of Shannon entropy E(I, r = 4) on intensity I at rank r = 4 . Th e continuous lines correspond to the parabolic approxima- tions; initial histograms shown in Figures 9 and 11(a); (b Distributions f ) or averages of Hölder ,emr with dif- ributions of entropy, based on normalized distribution of information in original histogram for frequency of flashes in different observe only one unified value of , for all rank r, like of 3D DNA ibe the states and dyrmational ac ferent number m at fluctuations of entropy e(r) near ho- meostasis for a good health man in real time, during one year; initial histograms shown in Figure 9; upper and lower branches correspond to the even 2,4,6,m and odd 1,3,5,m. 7. Conclusions We study various large-scale dist Shannon blood samples. We total Shannon entropy ,lnEJrr the empirical invariant, as the identical sum in each given distribution of information entropy, in all samples of blood and any donor, as in Figures 2(c) and 10(b) in real time. This invariant defines the informational homeosta- sis of oxidative activityfor full set of chro- mosomes inside living neutrophils, in all clusters of all multi-scale networks for information activity of DNA inside cells. This invariant gives Shannon entropy as general characteristics for definition of information ac- tivity of 3D DNA in cells for any person, at any state of health, for any genome as the overall zero level for analysis and comparison chromosomal activity and DNA networks in cells for different people (Figures 5-8) and for one and the same human in different times (Figures 12 and 13). Invariance of total entropy ,lnEJr r defines special role of distribution of Shannon entropy, as it is for all functions associated with the conservation laws (pulse, energy, charge etc.), as the main dominant vari- able to descrnamics of info tivity of DNA in cells. Nevertheless, informational invariant of ,lnEJrr is difficult to compare with the conservation laws of mass, energy, etc.; we have no different values of total entropy in different cells. Invari- ance of entropy reflects the unchangeable measure or quantitative units of information entropy at certain scale r of correlations at DNA activity inside all and any cells. Informational homeostasis reflects a number of fun- damental phenomena in information and physics of real life of 3D DNA inside cells. Shannon entropy of 3D DNA in cells has much more dense packing of correla- tions than in well known networks of ‘small worlds, than in all and any technical and computer systems. As the rule, networks of entropy are characterized by various mix of normal D < 2 and abnormal D > 2 fractal dimen- sions (Figures 3 and 11(a)) and new types of fractal pat- terns and fractal hinges for various fractal topology at different states of health (Figures 4-6 and 12). Results generalized in the double logarithmic scales, in the triple and quadruple logarithmic scales, etc., as a re- flection of complexity, what permits, also, detect a frag- mentation, as it is shown in Figures 4-6 and 12. Deviations or noises of information entropy l er quences fr fo om homeostasis level define regulation of informa- tional homeostasis, information transfer and information flow inside cells for different states of health. The coin- cidences and switching patterns in branching se r central moments , em and for average Hölder s of ,emr of these noises are shown in Figures 7 and 13(b) . We observe various saturations for averages of Hölder ,emr in the levels of chromosomal cor- relations of entropy at different states of health in Fig- ures 7(b) and 13(b), at increasing number of correlations m. All cmes are interconnected and involved in the support regulation of homeostasis; saturation of hro mo s o Open Access AM 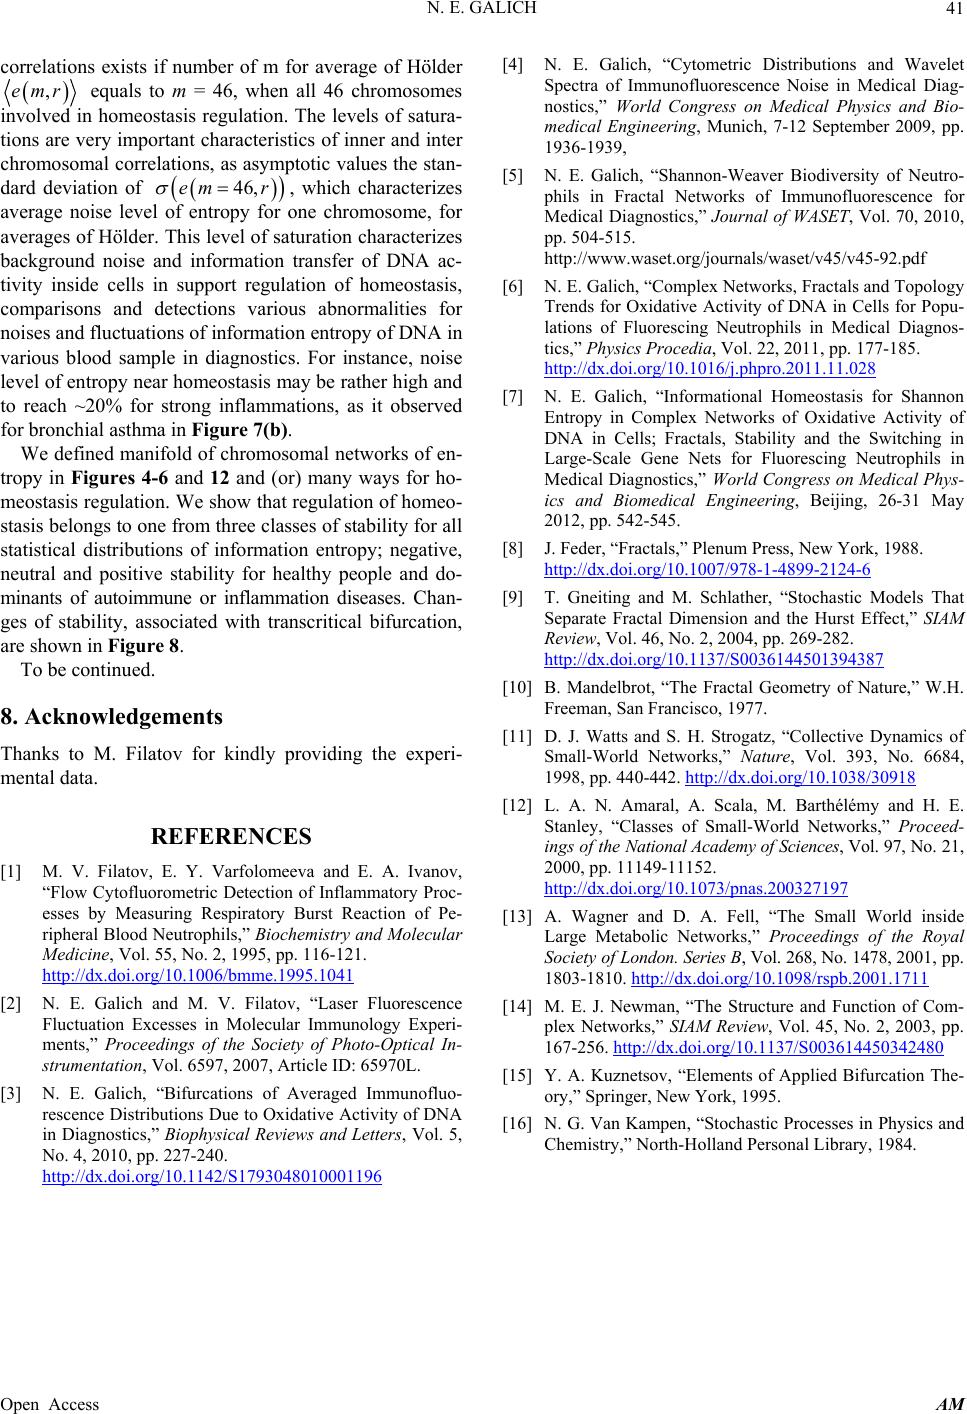 N. E. GALICH Open Access AM 41 exists if [4] N. E. Galich, “Cytometric Distributions and Wavelet Spectra of Immunofluores nostics,” World Congress on Medical Physics correlationsnumber of m for average of Hölder cence Noise in Medical Diag- and Bio- ostics,” Journal of WASET, Vol. 70, 2010, dative Activity of DNA in Cells for Popu- nos- ,emr equals to m = 46, when all 46 chromosomes involved in homeostasis regulation. The levels of satura- tions are very important characteristics of inner and inter chromosomal correlations, as asymptotic values the stan- medical Engineering, Munich, 7-12 September 2009, pp. 1936-1939, [5] N. E. Galich, “Shannon-Weaver Biodiversity of Neutro- phils in Fractal Networks of Immunofluorescence for Medical Diagn dard deviation of 46,emr , which characterizes oise level of entropy for one chromosome, for averages of Hölder. This level of saturation characterizes background noise and information transfer of DNA ac- tivity inside cells in support regulation of homeostasis, comparisons and us abnormalities for noises and fluctuations of information entropy of DNA in various blood sample in diagnostics. For instance, noise level of entropy near homeostasis may be rather high and to reach ~20% for strong inflammations, as it observed for bronchial asthma in Figure 7(b). We defined manifold of chromosomal networks of en- tropy in Figures 4-6 and 12 and (or) many ways for ho- meostasis regulation. We show that regulation of homeo- stasis belongs to one from three classes of stability for all statistical distributions of information average n detections vario entropy; negative ne NCES tofluorometric Detection of Inflammatory Proc- Measuring Respiratory Burst Reaction of Pe- ripheral Blood Neutrophils,” Biochemistry and Molecular Medicine, Vol-121. http://dx.doi.org/10.1006/bmme.1995.1041 pp. 504-515. http://www.waset.org/journals/waset/v45/v45-92.pdf [6] N. E. Galich, “Complex Networks, Fractals and Topology Trends for Oxi lations of Fluorescing Neutrophils in Medical Diag tics,” Phys i cs Procedia, Vol. 22, 2011, pp. 177-185. http://dx.doi.org/10.1016/j.phpro.2011.11.028 [7] N. E. Galich, “Informational Homeostasis for Shannon Entropy in Complex Networks of Oxidative Activit DNA in Cells; Fractals, Stability and the Sw y of itching in Large-Scale Gene Nets for Fluorescing Neutrophils in Medical Diagnostics,” World Congress on Medical Phys- ics and Biomedical Engineering, Beijing, 26-31 May 2012, pp. 542-545. [8] J. Feder, “Fractals,” Plenum Press, New York, 1988. http://dx.doi.org/10.1007/978-1-4899-2124-6 [9] T. Gneiting and M. , utral and positive stability for healthy people and do- minants of autoimmune or inflammation diseases. Chan- ges of stability, associated with transcritical bifurcation, are shown in Figure 8. To be continued. 8. Acknowledgements Thanks to M. Filatov for kindly providing the experi- me Schlather, “Stochastic Models That IAM Separate Fractal Dimension and the Hurst Effect,” S Review, Vol. 46, No. 2, 2004, pp. 269-282. http://dx.doi.org/10.1137/S0036144501394387 [10] B. Mandelbrot, “The Fractal Geometry of Nature,” W.H. Freeman, San Francisco, 1977. [11] D. J. Watts and S. H. Strogatz, “Collective Dynamics of org/10.1038/30918 Small-World Networks,” Nature, Vol. 393, No. 6684, 1998, pp. 440-442. http://dx.doi. ntal data. o. 21, [12] L. A. N. Amaral, A. Scala, M. Barthélémy and H. E. Stanley, “Classes of Small-World Networks,” Proceed- ing s o f the National Academy of Sciences, Vol. 97, N REFERE 2000, pp. 11149-11152. http://dx.doi.org/10.1073/pnas.200327197 [13] A. Wagner and D. A. Fell, “The Small World inside Large Metabolic Network Soc ie ty of L ondon. Series B, Vol. 268, No. 14 [1] M. V. Filatov, E. Y. Varfolomeeva and E. A. Ivanov, “Flow Cy esses by s,” Proceedings of the Royal 78, 2001, pp. . 55, No. 2, 1995, pp. 116 nofluo- 1803-1810. http://dx.doi.org/10.1098/rspb.2001.1711 [14] M. E. J. Newman, “The Structure and Function of Com- plex Networks,” SIAM Review, Vol. 45, No. 2, 2003, pp. 167-256. http://dx.doi.org/10.1137/S003614450342480 [2] N. E. Galich and M. V. Filatov, “Laser Fluorescence Fluctuation Excesses in Molecular Immunology Experi- ments,” Proceedings of the Society of Photo-Optical In- strumentation, Vol. 6597, 2007, Article ID: 65970L. [3] N. E. Galich, “Bifurcations of Averaged Immu d [15] Y. A. Kuznetsov, “Elements of Applied Bifurcation The- ory,” Springer, New York, 1995. [16] N. G. Van Kampen, “Stochastic Processes in Physics an rescence Distributions Due to Oxidative Activity of DNA in Diagnostics,” Biophysical Reviews and Letters, Vol. 5, No. 4, 2010, pp. 227-240. http://dx.doi.org/10.1142/S1793048010001196 Chemistry,” North-Holland Personal Library, 1984.
|