Paper Menu >>
Journal Menu >>
 Energy and Power Engineering, 2013, 5, 756-762 doi:10.4236/epe.2013.54B146 Published Online July 2013 (http://www.scirp.org/journal/epe) Analysis of Distribution Generation Influences on the Vol- tage Limit Violation Probability of Distribution Line Lu Zhang, Wei Tang, Muke Bai, Pengwei Cong College of Information and Electrical Engineering, China Agriculture University, Beijing, China Email: 602996165@qq.com Received April, 2013 ABSTRACT Considering the time-sequence characteristic and randomness of load and natural resources, this paper studies on the distributed generation (DG) impacts on voltage limit violation probability of distribution lines. The time-sequence characteristic and randomness of load, wind and photovoltaic (PV) generation are analyzed; the indices and risk levels of voltage limit violation probab ility of node and distribution line are proposed. By using probabilistic lo ad flow based on semi-invariant method, the impact degrees of voltage limit violation are calculated with different distributed power penetration levels, different seasons, different time periods, different allocation ratio between the wind power and PV power. Voltage limit violation laws of distribution line, which are concluded by IEEE33 bus system simulation, are very helpful to guide the voltage regulation of distribution line including distributed generation. Keywords: Distribution Generation; Distribution Line; Voltage Limit Violation Probability; Ti me-sequence Characteristic; Randomness 1. Introduction Renewable energy is paid more attention and application for its cleanness and environment protection in recent years, so the research of distributed generation (DG) has become focus. Effect of DG on voltage of distribution line becomes serious with the increasing DG penetration levels. As a result, the analysis o f voltage limits v iolation , which caused by DG, has important significance for en- suring economic and safe oper ation of power grid. There have been some researches on impact of voltage limit violation of DG connected to power grid. Effect of DG connected to transmission grid is analyzed by sensi- tivity analysis method [1]. A probabilistic assessment method was proposed [2], which adapt to different wind speed levels in transmission grid. Reference [3] analyzed impact of DG on voltage profiles using triangular load model. Impact of photovoltaic (PV) power on voltage was analyzed [4, 5]. Summarizing the literature [3-5], only maximum output of DG and peak load was consid- ered and the indices were calculated by certain method. But in fact, load and output of DG fluctuate with seasons significantly; daily load has large difference between peak and valley, which also has strong uncertainty. Therefore, the previous works are considered inadequately. This paper comprehensively considers randomness and time-sequence characteristic of load and DG. The organization is as follows: Time-sequence characteristic and randomness of load and DG is introduced in Section 2. Indices of distribution line voltage limit violation probability and calculation method are proposed in Sec- tion 3. Analysis of distribution line voltage limit viola- tion is presented in Section 4, followed by conclusions in Section 5. 2. Time-Sequence Characteristic and Randomness of Load and DG 2.1. Time-Sequence Characteristic and Randomness of Load Load fluctuates in timing. The variation of load is dif- ferent in four seasons a year. The differences of load are great in different periods a day in same season, but there are significant regularities. The period of peak happens nearly at the same time every day and so does the period of valley. Time-sequence characteristic of load in typical day of different season s is shown in Figure 1. On the other hand, load has randomness because of the error of load forecasting and the causal factors, which cause the load curve is not exactly the same as typical day. Load curves could be divided according to change law of load time-sequence characteristics a day, and 24 hours a day are segmented as shown in Table 1. Normal dis- tribution mean value and standard deviation could be obtained by statistical calculations of historical load data. Copyright © 2013 SciRes. EPE  L. ZHANG ET AL. 757 Figure 1. Time-sequence characteristic of load. Table 1. Load time-interval. periods Early in morning Morning Noon Afternoon Time (6-8] (8-11] (11-14] (14-17] Periods Evening Night Late at night Time (17-19] (19-23] (23-6] 2.2. Time-Sequence Characteristic and Randomness of Wind Generation Wind turbine generator (WTG) power, which changes with wind speed, has apparent randomness. Affected by natural conditions, wind speed has a very strong uncer- tainty. Waybill distribution is generally used as the sta- tistical description of the wind speed. The relationship of WTG power an d wind speed can b e shown as a curve of output characteristic. WTG power also has time-sequence characteristic. There is a big difference of wind speed between different seasons [6]. In different periods a day, speed changes also have a statistical characteristic. Wind speed timing characteristic curve of different seasons could be ob- tained by meteorological data, as shown in Figure 2. 2.3. Time-Sequence Characteristic and Randomness of PV Generation PV generator output has a direct relationship with the solar intensity. Sunlight radiation intensity depends on solar altitude and attenuation by clouds. The solar alti- tude changing with time can be expressed by a certain function. So PV generator output has time-sequence characteristic [7], as shown in Figure 3, which has little difference between different seasons. On the other hand, PV generator output is random because of the random attenuati on by clou ds. Figure 2. Time-sequence characteristic of WTG power. Figure 3. Time-sequence characteristic of PV. It can be concluded from above that: 1) All of load, WTG and PV power have time-sequence characteristic and randomness. 2) The mo men t of max i mum lo ad is n ot the same wi th maximum WTG and PV power output, and the indices calculated based on a certain value or certain levels of load and DG output have large differences with that in actual situation, so the results are not accurate. 3) Both load and DG output have randomness, certain indices can’t fully reflect the po tential risk in power grid. Therefore, it is importan t to calculate the voltage limit violation prob ability in different p eriods of the day com- prehensively considering time-sequence characteristic and randomness of the load and DG in order to really reflect the situation of voltage in power grid. 3. Indices of Distribution Line Voltage Limit Violation Probability 3.1. Voltage Limit Violation Probability Indices of Node and Distribution Line According to China national standards, the allowable deviation of node voltage in 10 kV distribution lines is Copyright © 2013 SciRes. EPE  L. ZHANG ET AL. 758 the ± 7% of rated voltage, so when the node voltage is higher than 1.07 pu or lower than 0.93 pu, voltage vio- lates limits. Voltage upper or lower limit violation prob- ability means the possibility of node voltage higher than 1.07 pu or belo w 0. 93 pu. Distribution line voltage limit violation probability is integrated statistics of node voltage. Assume that N nodes voltage limit violation probability is ( t k Pk , where t is period. The distribution line voltage limit violation probability in a period can be expressed as: 1,2... )N 1 1(1 N t k k P ) t P ) t P ) t P (1) Distribution line voltage upper limit violation prob- ability is calculated by: 1 1(1 N t up iup i P (2) where is the ith node in the distribution line volt- age upper limit violation probability in t period. Line voltage lower limit violation prob ability is calculated by: t iup P 1 1(1 N t down idown i P (3) where is the ith node in the distribution line vol- tage lower limit violation probab ility in t period. t idown P If voltage of any node is over limit, the distribution line is in risk state. According to the severity level, the state is divided into no risk, mild risk, medium risk and risk of severe, as shown in Table 2. 3.2. Calculation Method of Distribution Line Voltage Limit Violation Probability Based on Probabilistic Power Flow Considering the randomness of the load and DG, this paper uses probabilistic power flow to obtain probability value of voltage limit violatio n. Probabilistic power flow combined semi-invariant and Gram-Charlier expanding is used in order to avoid the large amount calculation of Monte Carlo method. The algorithm laniaries equations of bus injected power and line flow by Taylor series ex- panding at normal operation point: 00 00 00 00 ()( )..... ()( ).... SSfXXfXJX ZZgXXgXGX (4) where 0, 0 S X and 0 Z are expectation of bus injec- tion power, state variable and line flow, respectively; , S X and Z are their random disturbance. Assuming that loads of nodes random change is mutu- ally independent, winds speed and sunlight intensity are mutually independent, wind speed obeys distribution of Waybill and sunlight intensity obeys beta distribution in each period. Algebraic operations of semi-invariant take the place of convolution calculation, and then all older semi-invariant of unknown quantity are ob tained. Finally the probability density function of state variables is cal- culated by Gram-Charlier series expansion method. Detailed procedures are as follows: 1) Enter the basic data of the power grid, including grid structure and the basic parameters of the load and DG. 2) Obtain the load and power curve of typical day in different seasons by meteorological data or historical data; calculate the time-sequence characteristic parame- ters of load and DG in different periods and different seasons. 3) Calculate nodes voltage limit violation probability in different periods and different seasons by using prob- abilistic flow based on semi-invariant. 4) Calculate voltage limit violation probability of dis- tribution line by nodes’ in different periods and seasons. 5) Evaluate the risk level. 4. Analysis of Distribution Line Voltage Limit Violation Probability IEEE33 bus distribution system is used as example in this paper. In 14, 23, 29 nodes join WTG and PV, as shown in Figure 4, and related data are shown in Table 3, Table 4. The penetration level can be changed by accessing different numbers of DG. Load obeys the normal distri- bution with 3% variance, the bu s 0 voltage taken 1.02pu, and the line maximum load is 7430kW. 4.1. Effect of Load Rate and DG Penetration According to load rate of 20%, 50%, 80%, this paper divides distribution line into three types: light load, nor- mal load and high load. Voltage upper and lower limit violation probability of distribution lines is calculated in different penetration levels, and the results are shown in Figure 5 - Figure 7, Table 5 - Table 7. Table 5 and Figure 5 show that: the voltage of light load line without DG isn’t over limit. After joining DG, with the increase of the penetration, voltage begins to exceed upper limit, which mainly appears near DG and Table 2. Risk levels of voltage limit violation probability. limit violation probability(%) Risk level (0-0.1] No risk (0.1-20] Mild risk (20-50] Medium risk More than 50 Risk of severe Copyright © 2013 SciRes. EPE  L. ZHANG ET AL. Copyright © 2013 SciRes. EPE 759 Table 3. Characteristics of wind farms. Table 4. Characteristics of solar parks. Rated capacity/MW Cut-in speed/(m/s) Rated speed/(m/s) Cut-out speed/(m/s) k c 0.4 3 14 25 1.7415.612 Square total area/m2Photoelectrical conversion efficiency/% Highest irradiance/(W/m2)α β 800 14 600 0.850.85 Figure 4. IEEE33 bus system including DG. the small load nodes. If DG is installed near bus 0, nodes voltage in front may be over upper limit. When penetra- tion is more than 30%, the probability of voltage upper limit violation is higher than 20%, which is medium risk. When penetration level increases to 40%, the probability of voltage upper limit violation reaches 55%, which is risk of severe. Table 5. Voltage limit violation probability of light load line. Light load line(1634 kW) Penetration rate of DG(%) Probability of lower limit(%) Probability of upper limit(%) Total over-limit probability(%) 0 0 0 0 10 0 0 0 15 0 0.16 0.16 20 0 0.52 0.52 25 0 9.23 9.23 30 0 18.9 18.9 35 0 34.4 23.41 40 0 55.0 55.01 Figure 5. Voltage limit violation probability of light load line. Figure 6. Voltage limit violation probability of normal load line. 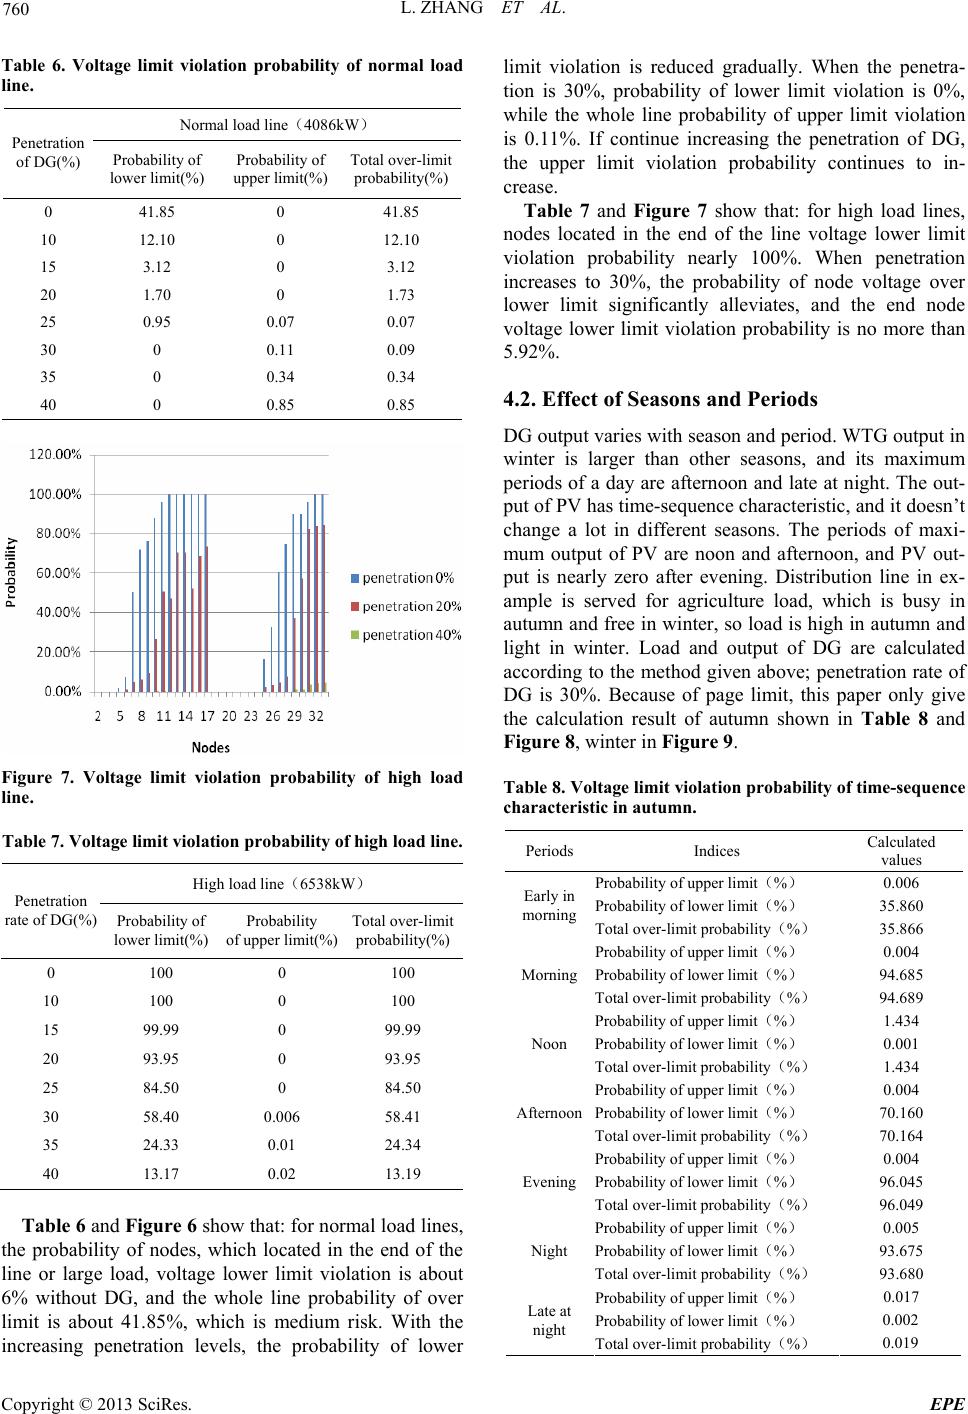 L. ZHANG ET AL. 760 Table 6. Voltage limit violation probability of normal load line. Normal load line(4086kW) Penetration of DG(%) Probability of lower limit(%) Probability of upper limit(%) Total over-limit probability(%) 0 41.85 0 41.85 10 12.10 0 12.10 15 3.12 0 3.12 20 1.70 0 1.73 25 0.95 0.07 0.07 30 0 0.11 0.09 35 0 0.34 0.34 40 0 0.85 0.85 Figure 7. Voltage limit violation probability of high load line. Table 7. Voltage limit violation probability of high load line. High load line(6538kW) Penetration rate of DG(%) Probability of lower limit(%) Probability of upper limit(%) Total over-limit probability(%) 0 100 0 100 10 100 0 100 15 99.99 0 99.99 20 93.95 0 93.95 25 84.50 0 84.50 30 58.40 0.006 58.41 35 24.33 0.01 24.34 40 13.17 0.02 13.19 Table 6 and Figure 6 show that: for normal load lines, the probability of nodes, which located in the end of the line or large load, voltage lower limit violation is about 6% without DG, and the whole line probability of over limit is about 41.85%, which is medium risk. With the increasing penetration levels, the probability of lower limit violation is reduced gradually. When the penetra- tion is 30%, probability of lower limit violation is 0%, while the whole line probability of upper limit violation is 0.11%. If continue increasing the penetration of DG, the upper limit violation probability continues to in- crease. Table 7 and Figure 7 show that: for high load lines, nodes located in the end of the line voltage lower limit violation probability nearly 100%. When penetration increases to 30%, the probability of node voltage over lower limit significantly alleviates, and the end node voltage lower limit violation probability is no more than 5.92%. 4.2. Effect of Seasons and Periods DG output v aries with season an d period . WTG ou tput in winter is larger than other seasons, and its maximum periods of a day are afternoon and late at night. The out- put of PV has time-sequence characteristic, and it doesn’t change a lot in different seasons. The periods of maxi- mum output of PV are noon and afternoon, and PV out- put is nearly zero after evening. Distribution line in ex- ample is served for agriculture load, which is busy in autumn and free in winter, so load is high in autumn and light in winter. Load and output of DG are calculated according to the method given above; penetration rate of DG is 30%. Because of page limit, this paper only give the calculation result of autumn shown in Table 8 and Figure 8, winter in Figure 9. Table 8. Voltage limit violation probability of time-sequence characteristic in autumn. Periods Indices Calculated values Probability of upper limit(%) 0.006 Probability of lower limit(%) 35.860 Early in morning Total over-limit probability(%) 35.866 Probability of upper limit(%) 0.004 Probability of lower limit(%) 94.685 Morning Total over-limit probability(%) 94.689 Probability of upper limit(%) 1.434 Probability of lower limit(%) 0.001 Noon Total over-limit probability(%) 1.434 Probability of upper limit(%) 0.004 Probability of lower limit(%) 70.160 Afternoon Total over-limit probability(%) 70.164 Probability of upper limit(%) 0.004 Probability of lower limit(%) 96.045 Evening Total over-limit probability(%) 96.049 Probability of upper limit(%) 0.005 Probability of lower limit(%) 93.675 Night Total over-limit probability(%) 93.680 Probability of upper limit(%) 0.017 Probability of lower limit(%) 0.002 Late at night Total over-limit probability(%) 0.019 Copyright © 2013 SciRes. EPE 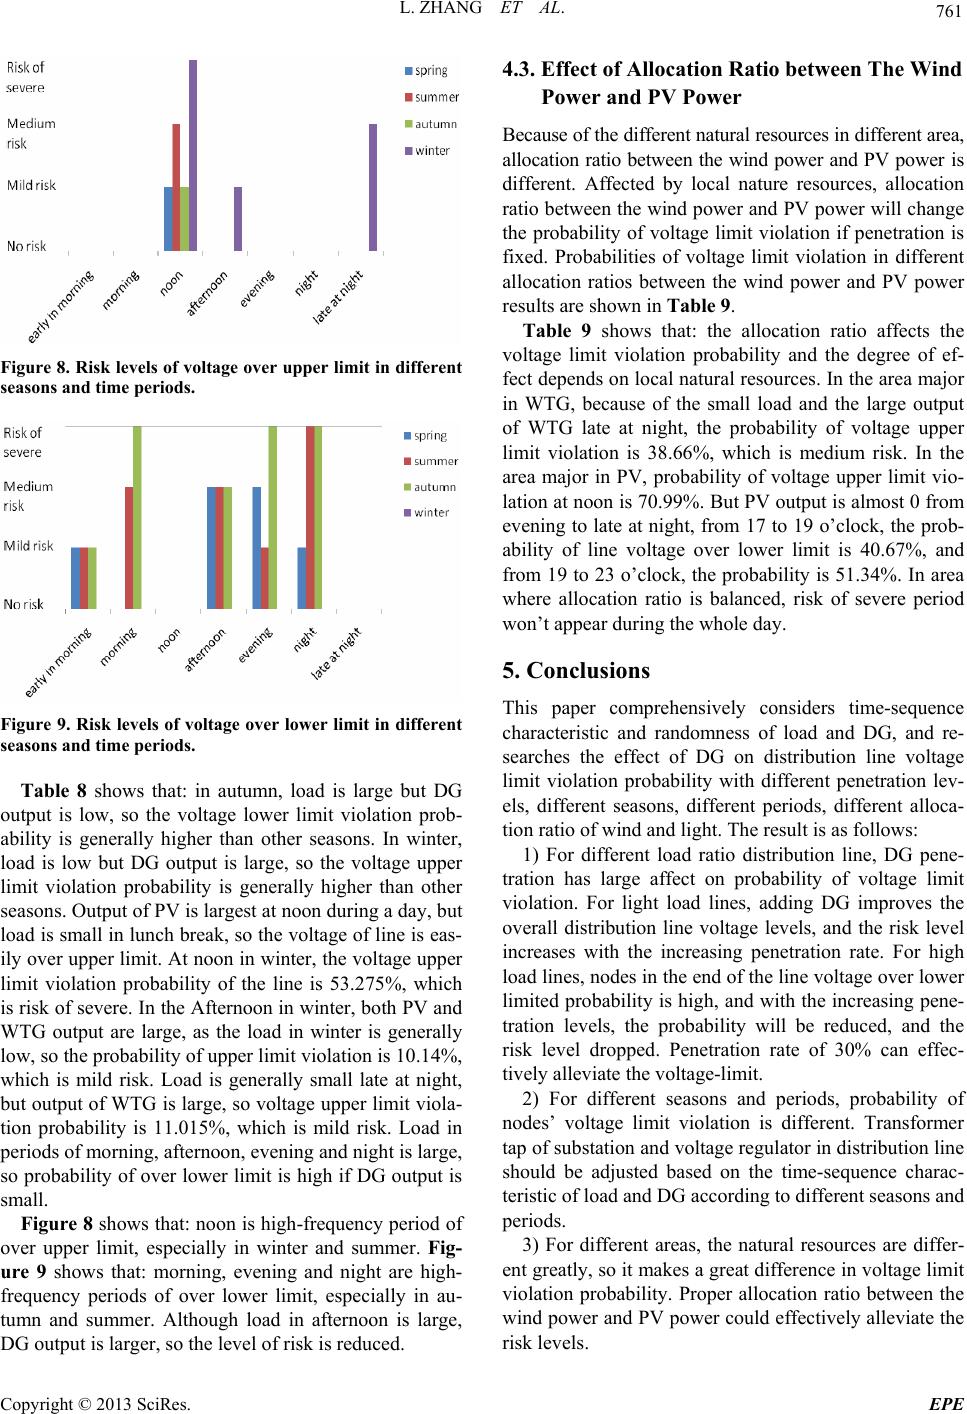 L. ZHANG ET AL. 761 Figure 8. Risk levels of voltage over upper limit in different seasons and time periods. Figure 9. Risk levels of voltage over lower limit in different seasons and time periods. Table 8 shows that: in autumn, load is large but DG output is low, so the voltage lower limit violation prob- ability is generally higher than other seasons. In winter, load is low but DG output is large, so the voltage upper limit violation probability is generally higher than other seasons. Output of PV is largest at noon during a day, but load is small in lunch break, so the voltage of line is eas- ily over upper limit. At noon in winter, the voltage upper limit violation probability of the line is 53.275%, which is risk of severe. In the Aftern oon in winter, bo th PV and WTG output are large, as the load in winter is generally low, so the probability of upper limit violatio n is 10.14 %, which is mild risk. Load is generally small late at night, but output of WTG is large, so voltage upper limit viola- tion probability is 11.015%, which is mild risk. Load in periods of morning, afternoon, evening and night is large, so probability of over lower limit is high if DG output is small. Figure 8 shows that: noon is high-fr equency period of over upper limit, especially in winter and summer. Fig- ure 9 shows that: morning, evening and night are high- frequency periods of over lower limit, especially in au- tumn and summer. Although load in afternoon is large, DG output is larger, so the level of risk is reduced. 4.3. Effect of Allocation Ratio between The Wind Power and PV Power Because of the different natural resources in different area, allocation ratio between the wind power and PV power is different. Affected by local nature resources, allocation ratio between the wind power and PV power will chan ge the probability of voltage limit violation if penetration is fixed. Probabilities of voltage limit violation in different allocation ratios between the wind power and PV power results are shown in Table 9. Table 9 shows that: the allocation ratio affects the voltage limit violation probability and the degree of ef- fect depends on local natural resources. In the area major in WTG, because of the small load and the large output of WTG late at night, the probability of voltage upper limit violation is 38.66%, which is medium risk. In the area major in PV, probability of voltage upper limit vio- lation at noon is 70.99%. But PV output is almost 0 from evening to late at night, from 17 to 19 o’clock, the prob- ability of line voltage over lower limit is 40.67%, and from 19 to 23 o’clock, the probability is 51.34%. In area where allocation ratio is balanced, risk of severe period won’t appear during the whole day. 5. Conclusions This paper comprehensively considers time-sequence characteristic and randomness of load and DG, and re- searches the effect of DG on distribution line voltage limit violation probability with different penetration lev- els, different seasons, different periods, different alloca- tion ratio of wind and light. The result is as follows: 1) For different load ratio distribution line, DG pene- tration has large affect on probability of voltage limit violation. For light load lines, adding DG improves the overall distribution line voltage levels, and the risk level increases with the increasing penetration rate. For high load lines, nodes in th e end of th e line voltag e over lo wer limited probabilit y is high, and with the increasing pene- tration levels, the probability will be reduced, and the risk level dropped. Penetration rate of 30% can effec- tively alleviate the vo ltage-limit. 2) For different seasons and periods, probability of nodes’ voltage limit violation is different. Transformer tap of substation and vo ltage regulator in distribu tion line should be adjusted based on the time-sequence charac- teristic of load and DG according to different seasons and periods. 3) For different areas, the natural resources are differ- ent greatly, so it makes a great difference in voltage limit violation probability. Proper allocation ratio between the wind power and PV power could effectively alleviate the risk levels. Copyright © 2013 SciRes. EPE  L. ZHANG ET AL. Copyright © 2013 SciRes. EPE 762 Table 9. Voltage limit violation probability of time-sequence characteristics in different allocation ratios between the wind power and PV power. Periods Indices ration between wind power and PV pow- er(%) 0/100 ration between wind power and PV power(%) 30/70 ration between wind power and PV power(%) 50/50 ration between wind power and PV power(%) 70/30 ration between wind power and PV power(%) 100/0 Probability of upper limit(%) 0.01 0.01 0.01 0.02 0.02 Probability of lower limit(%) 0.25 0.15 0.1 0.06 0.02 Early in morning Total over-limit probability(%) 0.26 0.16 0.11 0.07 0.04 Probability of upper limit(%) 0.26 0.07 0.04 0.03 0.01 Probability of lower limit(%) 0 0 0 0 0.2 Morning Total over-limit probability(%) 0.26 0.07 0.04 0.03 0.21 Probability of upper limit(%) 70.99 39.34 22.87 4.67 0.11 Probability of lower limit(%) 0 0 0 0 0 Noon Total over-limit probability(%) 70.99 39.34 22.87 4.67 0.11 Probability of upper limit(%) 0.05 0.05 0.04 0.07 0.03 Probability of lower limit(%) 0.07 0.06 0.05 0.09 0.16 After- noon Total over-limit probability(%) 0.12 0.11 0.09 0.17 0.19 Probability of upper limit(%) 0 0 0.01 0.02 0.03 Probability of lower limit(%) 40.67 15.36 1.94 0.38 0.03 Evening Total over-limit probability(%) 40.67 15.36 1.95 0.40 0.06 Probability of upper limit(%) 0 0.02 0.01 0.01 0.03 Probability of lower limit(%) 51.34 10.02 0.24 0.06 0 Night Total over-limit probability(%) 51.34 10.03 0.25 0.06 0.03 Probability of upper limit(%) 0.01 0.02 0.03 9.17 38.66 Probability of lower limit(%) 0.21 0.02 0 0 0 Late at night Total over-limit probability(%) 0.22 0.04 0.03 9.17 38.66 4) The laws of voltage limit violation of distribution line could be obtained by using the proposed calculation method comprehensively considering time-sequence characteristic and randomness, and the potential risks of the distribution lines could be found. REFERENCES [1] B. Li, T. Q. Liu and X. Y. Li, “Impact of Distributed Gen- eration on Power System Voltage Stability,” Power Sys- tem Technology, Vol. 33, No. 3, 2009, pp. 84-88 [2] H. N. Niu, X. Q. Huang, Z. Cai and M. G. Yang, “Prob- abilistic Evaluation of Voltage Limit Violation of Power System with Wind Power Generators Integrated,” Power System Protection and Control, Vol. 40, No. 18, 2012, pp. 1-6 [3] F. Chen, W. Wang, L. J. Xu, et a1., “Analyzing the Volt- age Variation of Distribution Network Including Distrib- uted Generation,” Proceedings of the CSU-EPSA, , Vol. 24, No. 4, 2012, pp. 145-149 [4] X. Y. Xu, Y. H. Huang, C. Liu, et a1., “Influence of Dis- tributed Photovoltaic Generation on Voltage in Distribu- tion Network and Solution of Voltage Beyond Limits,” Power System Technology, Vol. 34, No. 10, 2010, pp. 140-146 [5] S. Conti, S. Raiti, G. Tina, et al., “Study of the Impact of PV Generationon Voltage Profile in LV Distribution Networks,” 2001 IEEE Porto Power Technology Confer- ence. [6] J. Xiao, T. Q. Liu and P. Su, “Time-Interval Based Reac- tive Power Optimization Algorithm Using Dou- ble-Population Particle Swarm Optimization,” Power System Technology, Vol. 38, No. 8, 2009, pp. 72-77 [7] H. S. Liang, L. Cheng and S. Liu, “Monte Carlo Simula- tion Based Reliability Evaluation of Distribution System Containing Microgrids,” Power System Technology, Vol. 10, 2011, pp. 76-81. |