Y. H. WANG ET AL.
Copyright © 2013 SciRes. MSCE
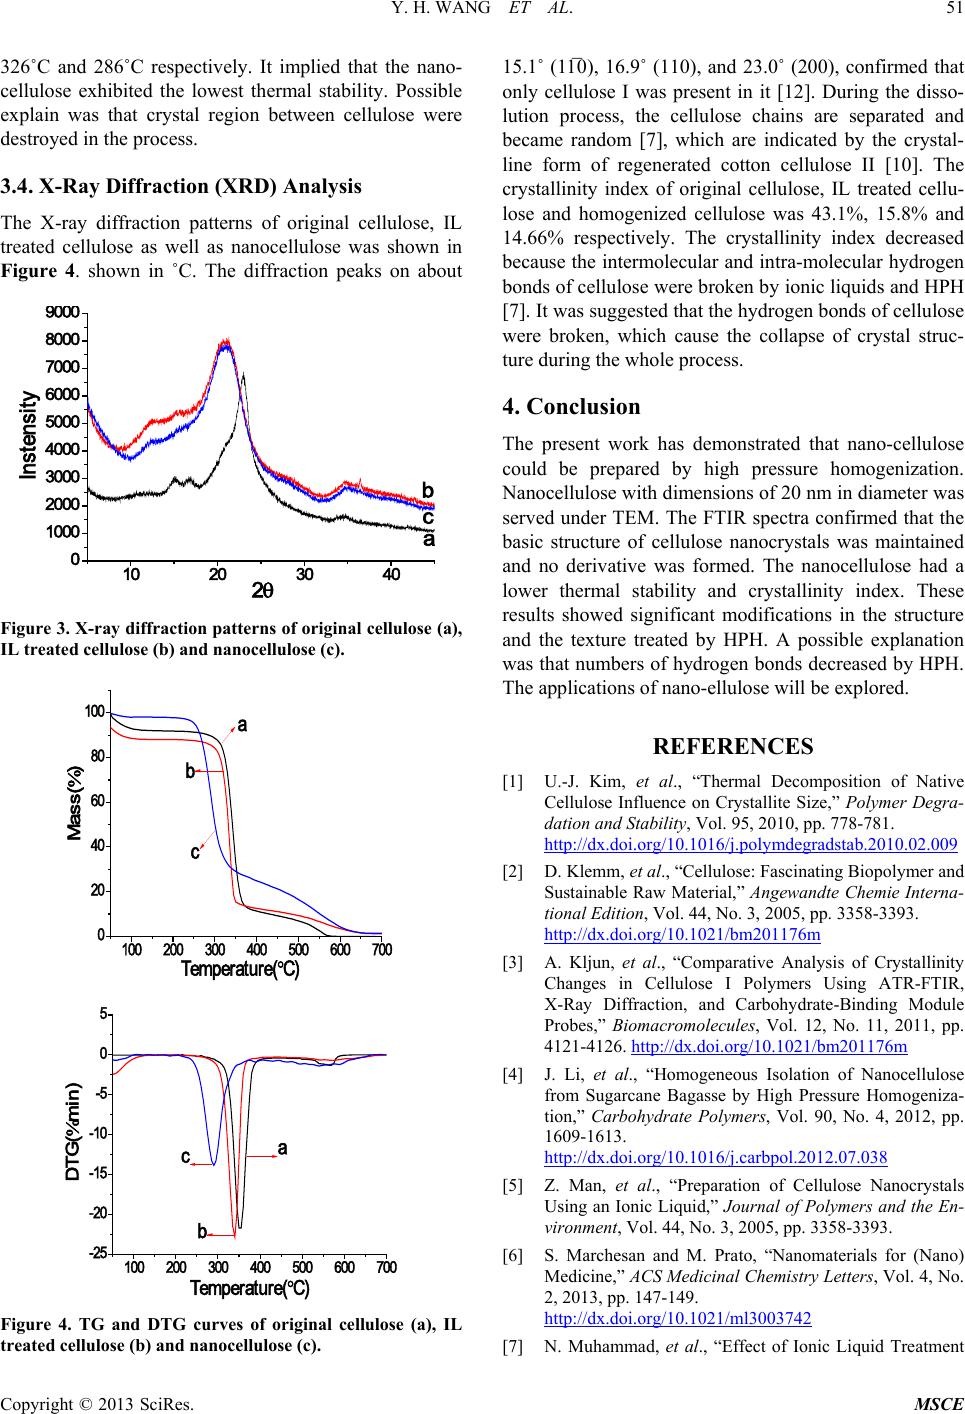
326˚C and 286˚C respectively. It implied that the nano-
cellulose exhibited the lowest thermal stability. Possible
explain was that crystal region between cellulose were
destroyed in the process.
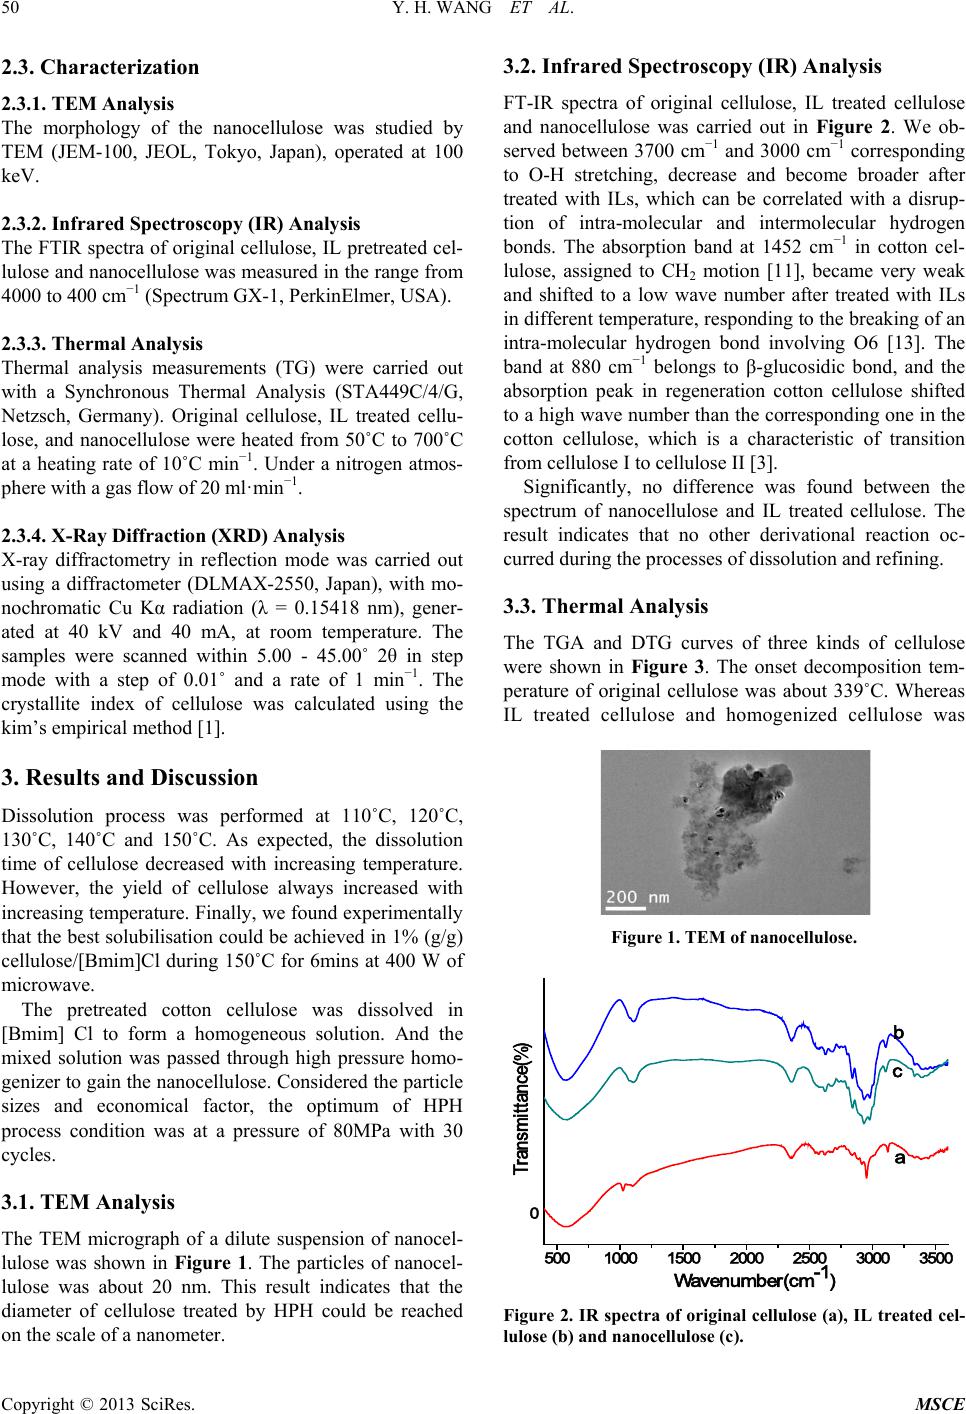
3.4. X-Ray Diffraction (XRD) Analysis
The X-ray diffraction patterns of original cellulose, IL
treated cellulose as well as nanocellulose was shown in
Figure 4. shown in ˚C. The diffraction peaks on about
10 20 30 40
0
1000
2000
3000
4000
5000
6000
7000
8000
9000
c
b
Inst ensi ty
2θ
a
Figure 3. X-ray diffraction patterns of original cellulose (a),
IL treated cellulose (b) and nanocellulose (c).
100 200 300 400 500 600 700
0
20
40
60
80
100
c
b
Ma ss(%)
Temperature(°C)
a
100 200 300 400 500 600 700
- 25
- 20
- 15
- 10
-5
0
5
c
b
DTG(%min )
Temperature(°C)
a
Figure 4. TG and DTG curves of original cellulose (a), IL
treated cellulose (b) and nanocellulose (c).
15.1˚ (11̅0), 16.9˚ (110), and 23.0˚ (200), confirmed that
only cellulose I was present in it [12]. During the disso-
lution process, the cellulose chains are separated and
became random [7], which are indicated by the crystal-
line form of regenerated cotton cellulose II [10]. The
crystallinity index of original cellulose, IL treated cellu-
lose and homogenized cellulose was 4 3.1%, 15 .8% and
14.66% respectively. The crystallinity index decreased
because the intermolecular and intra-molecular h ydrogen
bonds of cellulose were broken by ionic liquids and HPH
[7]. It was suggested that the hydrogen bonds of cellulose
were broken, which cause the collapse of crystal struc-
ture duri n g the whole process .
4. Conclusion
The present work has demonstrated that nano-cellulose
could be prepared by high pressure homogenization.
Nanocellulose with dimension s o f 20 nm in diameter was
served under TEM. The FTIR spectra confirmed that the
basic structure of cellulose nanocrystals was maintained
and no derivative was formed. The nanocellulose had a
lower thermal stability and crystallinity index. These
results showed significant modifications in the structure
and the texture treated by HPH. A possible explanation
was that numbers of hydrogen bonds decreased by HPH.
The applications of n ano -ellulose will be explored .
REFERENCES
[1] U.-J. Kim, et al., “Thermal Decomposition of Native
Cellulose Influence on Crystallite Size,” Polymer Degra-
dation and Stability, Vol. 95, 2010, pp. 778-781.
http://dx.doi.org/10.1016/j.polymdegradstab.2010.02.009
[2] D. Klemm, et al., “Cellulose: Fascinating Biopolymer and
Sustainable Raw Material,” Angewandte Chemie Interna-
tional Edition, Vol. 44, No. 3, 2005, pp. 3358-3393.
http://dx.doi.org/10.1021/bm201176m
[3] A. Kljun, et al., “Comparative Analysis of Crystallinity
Changes in Cellulose I Polymers Using ATR-FTIR,
X-Ray Diffraction, and Carbohydrate-Binding Module
Probes,” Biomacromolecules, Vol. 12, No. 11, 2011, pp.
4121-4126. http://dx.doi.org/10.1021/bm201176m
[4] J. Li, et al., “Homogeneous Isolation of Nanocellulose
from Sugarcane Bagasse by High Pressure Homogeniza-
tion,” Carbohydrate Polymers, Vol. 90, No. 4, 2012, pp.
1609-1613.
http://dx.doi.org/10.1016/j.carbpol.2012.07.038
[5] Z. Man, et al., “Preparation of Cellulose Nanocrystals
Using an Ionic Liquid,” Journal of Polymers and the En-
vironment, Vol. 44, No. 3, 2005, pp. 3358-3393.
[6] S. Marchesan and M. Prato, “Nanomaterials for (Nano)
Medicine,” ACS Medicinal Chemistry Letters, Vol. 4, No.
2, 2013, pp. 147-149.
http://dx.doi.org/10.1021/ml3003742
[7] N. Muhammad, et al., “Effect of Ionic Liquid Treatment