 Journal of Materials Science and Chemical Engineering, 2013, 1, 33-38 http://dx.doi.org/10.4236/msce.2013.15007 Published Online October 2013 (http://www.scirp.org/journal/msce) Copyright © 2013 SciRes. MSCE Discoloration on Methylene Blue Solutions by Direct and Catal ytic Ozon a t io n Antonio D. Rodriguez-Lopez1*, Jose Garcia-Garr ido 1*, Cynthia Perez-Ramiro1, Esperanza M. Garcia-Castello2 1Grupo de Tecnologías de Control de Aguas y Residuos (TECAR), Universitat Politècnica de València, Camino de Vera, Valencia, Spain 2Institute of Food Engineering for Development, Universitat Politècnica de València, Camino de Vera, Valencia, Spain Email: *anrodlo@iqn.upv.es, *jgarciag@iqn.upv.es Received August 2013 ABSTRACT During textile manufacturing, huge amounts of wastewaters characterized by removed impurities and high concentra- tions of dye are produced. These wastewaters cause several problems when they are discharged to the environment. The use of ozone in wastewater treatment results of interest. In this work we propose to assess the discoloration rate of dif- ferent synthetic wastewaters as a function of pH, dye concentration (methylene blue (MB)) and reaction time. A com- parison of discoloration rate between conventional ozonation and catalytic ozonation salts of copper, zinc, silver and nickel was also performed. For the optimization of the ozonation process of colored solutions, it was used a central composite experimental design with five replicates of the center point resulting to evaluate the influence of the inde- pendent variables at different ranges of pH, [MB] and time. In the catalyst-assisted ozonation, [MB], pH and the reac- tion time were fixed to 100 mg/L, 5.5 and 15 min, respectively. The optimized experimental conditions to provide maximum discoloration were pH = 3.3; [MB] = 8.6 mg/L and time = 74.3 min. Regarding the catalyst-assisted ozona- tion, it was found that CuSO4 catalyst gave better color reduction if compared with other catalysts assayed. Keywords: Textile Wastewater; Methylene Blue; Discoloration; Ozonation; Catalytic 1. Introduction Textile industry is one of the most common and essential sectors in the world [1]. It is considered one of the long- est and most complex manufacturing industrial chains, covering the entire production cycle from raw materials to semi-processed products (yarns, woven and knitted fabrics with their finishing process), and final products (carpets, home textiles, clothing and industrial use tex- tiles) [2,3]. At the EU, the over the 80% of the textile production are headed by Italy, Germany, UK, France and Spain [2]. During the textile manufacturing, huge amounts of water as well as chemical products are consumed [4]. Hence, wastewaters are characterized by their high vo- lume, removed impurities and high concentrations of dye. In this sense, from 30% [5] to 50% [6] of the dye used in the textile processing are present mainly as hydrolyzed in wastewaters. Textile wastewaters cause several problems when they are discharged to the environment due to color provided by dyes. There are esthetic problems [2,3,5,6] as well as toxic problems to aquatic life since colored wastewaters avoid the light penetration and in addition, dyes or their derivat ives present harmful properties [1,5,7]. Therefore, color removal must be one of the targets to treat both textile dyeing and dye manufacture wastewa- ters [8,9]. Physicochemical and biological treatments of these wastewaters have been proposed. Conventional physicochemical processes are effective to remove dyes [10,11], but are expensive [3,12]. Another drawback is that physicochemical treatments transf er the pollutants to other phase but not eliminate the problem [13]. The ac- cumulation of toxic compounds in the sludge can create disposal problems that might also lead to a secondary pollution [3,11 ,12]. Biological treatments are considered not to be com- pletely adequate. In textile wastewater, there are resistant pollutants to biological degradation, and so, color is re- duced but not up to levels that allow direct discharge [3,6,7,11,13,14]. Other alternatives for the textile wastewater color re- moval are anaerobic treatments [5], activated carbon [11], *Corresponding a uthors.  A. D. RODRIGUEZ-LOPEZ ET AL. Copyright © 2013 SciRes. MSCE combined processes as fluidized biofilm process-chemi- cal coagulation-electrochemical oxidation [15] or acti- vated carbon and sequencing batch reactor (SBR) [12]. However studies and investigations on other options of wastewater treatments such as ozonation or advanced oxidation processes (AOPs) are necessary to remove the color completely [3]. The use of ozone in wastewater treatment results of interest because there is no sludge production; the per- formance is very easy; the required space is small and residual ozone can be easily decomposed to oxygen and water [13]. Regarding the AOPs, they are based on the generation of hydroxyl radicals in water. These radicals are highly reactive and nonselective oxidants that can oxidize different organic compounds [13]. Most studies about AOPs are focalized in photocata- lytic oxidation, Fenton (FO), photo-Fenton and ozone oxidation have been attempted individually or combined with UV, TiO2 or H2O2 oxidants to decolorize the textile wastewater [1,13,16-19] but there are no many studies to treat to decolorate with ozone and other catalyst as cop- per, zinc , si l ver or nicke l [ 20]. In this work we propose to assess the discoloration rate of different synthetic wastewaters as a function of pH, dye concentration (methylene blue (MB) [9]) and reac- tion time. A comparison of discoloration rate between conventional ozonation and catalytic ozonation salts of copper, zinc, silver and nickel was also performed. 2. Introduction 2.1. Chemicals The substrate of the reaction, methylene blue (C16H18ClN3S·(2-3)·H2O; MW 319.9 g/mol (d.b.)), was purchased from Prolabo (VWR Prolabo, Fontenay-sous- Bois, France), was employed without further purification. Zinc oxide (ZnO), copper (II) sulfate pentahydrate (Cu- SO4·5H2O), potassium iodide (KI), sodium hydroxide (NaOH) and sulfuric acid (H2SO4) were obtained from Prolabo too. Other reagents, as Zinc sulfate heptahydrate (ZnSO4·7H2O), titanium dioxide (TiO2), nickel (II) sul- fate hexahydrate (NiSO4·6H2O), copper (II) sulfate an- hydrous (CuSO4) and silver sulfate (AgSO4) were pur- chased from Merck (Darm st adt , Ge rmany). 2.2. Ozonation System The laboratory system used is depicted in Figure 1. It consisted in two columns: the first column (ozonation reactor) was a PVC pipe with a diameter of 3.5 cm and a height of 1 m. The experimental volume was fixed at 500 mL and presented an outlet at the bottom for the sample extraction, as well as an upper connection to the second column for the outflow of ozone in excess. Figure 1. Schematic diagram of reactor system. This second reactor, with the same dimensions and volume than the first one contained a solution of 2% IK. Ozone was generated directly from oxygen in air by a G300 Hidro device (ZonoSistem, Cádiz, Spain). The average gas flow generated was 0.76 L/min, with an av- erage generation rate of 0.86 mg O3/min, thus, the O3 concentration in the inlet of the first reactor inlet was 1.14 mg/L. 2.3. Experimental Design 2.3.1. Direct Ozonation Process For the optimization of the ozonation process of colored solutions, it was used a central composite (CCD) expe- rimental design with five replicates of the center point resulting in a 19 runs to evaluate the influence of the in- dependent variables at different ranges: pH (3.3 - 11.7), methylene blue concentration (7.9 - 92.0 mg/L) and reac- tion time (9.5 - 110.4 min). Natural and coded variables are shown in Table 1. The response considered was the final absorbance in order to calculate the color reduction. The effect of these three independent variables on col- or reduction was studied trough a Response Surface Me- thodology (RSM). The use of RSM is useful for model- ing and analysing when a response is influenced by sev- eral variables and the objective is to optimize this re- sponse [21]. 2.3.2. Catalyst-Assisted Oz o nation Process In the catalyst-assisted ozonation, the laboratory system, the MB solution volume and the ozone concentration were the same than used in the direct ozonation. The MB concentration, pH and the reaction time were fixed to 100 mg/L, 5.5 and 15 min, respectively.  A. D. RODRIGUEZ-LOPEZ ET AL. Copyright © 2013 SciRes. MSCE Table 1. Natural and coded (in brackets) variables for the experimental factors pH, Methylene Blue concentration and reaction time in the central composite design for the direct ozonation of organic dye solutions. Run pH (X1) [MB] (mg/L) (X2) t (min) (X3) 1 10 (+1) 25 ( −1) 90 (+1) 2 5 (−1) 75 (+1) 90 (+1) 3 7.5 (0) 50 (0) 60 (0) 4 7.5 (0) 50 (0) 110.4 (+ 1 .68) 5 7.5 (0) 50 (0) 9.5 (−1.68) 6 5 (−1) 25 (−1) 30 (−1) 7 11.7 (+1.68) 50 (0) 60 (0) 8 7.5 (0) 92 (+1.68) 60 ( 0 ) 9 7.5 (0) 50 (0) 60 (0) 10 5 (−1) 75 (+1) 30 (−1) 11 7.5 (0) 8 (−1.68) 60 ( 0 ) 12 3.3 (-1.68) 50 (0) 60 (0) 13 7.5 (0) 5 0 (0) 60 (0) 14 5 (−1) 25 (−1) 90 (+1) 15 10 (+1) 75 (+1) 30 (−1) 16 7.5 (0) 5 0 (0) 60 (0) 17 10 (+1) 75 (+1) 90 (+ 1 ) 18 10 (+1) 25 (−1) 30 (−1) 19 7.5 (0) 5 0 (0) 60 (0) Several catalyst were assessed (ZnO, CuSO4·5H2O, CuSO4, AgSO4, NiSO4·6H2O, TiO2 and ZnSO4·7H2O). Different doses of catalyst were evaluated (0, 2, 20 and 200 mg/L). To study the evolution of the discoloration rate with time, samples were taken each 5 min. 2.4. Analytical Determinations 2.4.1. Ozone Measurement The ozone concentration was determined by bubbling the gas generated in a solution of IK, Na2HPO4 and KH2PO4 to 2%, 0.73% and 0.35%, respectively, and subsequent titration with sodium thiosulfate 0.002 M daily prepared [22,23]. 2.4.2. Discoloration Rate The discoloration rate or color reduction was determined as expressed in Equation (1). The absorbance was meas- ured in a Genesys 5 spectrophotometer (Spectronic In- struments, USA) at the maximum wavelength for the Methylene Blue (665 nm) [6,7]. ( ) 0 % 100% f o Abs Abs Rcolor x Abs − = (1) where Absf is the absorbance at requested time and Abs0 is the initial absorbance of each solution. 2.4.3. pH Measurement The pH of the different solutions was measured by a pH-meter (pH & ION meter GLP 22, Crison, Spain). The pH of the feed solutions shown in Table 1, were adjusted by using 0.1 M NaOH and 0.1 M H2SO4. All the analyses were done in triplicate. Data used in the statistical analysis were the average of these three values. Results were analyzed using the software “Stat- graphics” version Centurion XVI, from StatPoint Tech- nologies, Inc, USA. Linear and quadratic effects of the three variables considered, as well as their interactions on the response variables studied were calculated. Their significance was evaluated by analysis of variance (ANOVA). The proposed model, to which the experi- mental data were fitted, was a second-order polynomial model (Equation (2)). 2 011 1 nn n i iii iij ij i iji YX XXX ββ ββ === + =++ + ∑∑ ∑ (2) where Y is the response var iable; β0, βi (i = 1, 2, 3), βij (I = 1, 2, 3; j = 1, 2, 3) and βii(i = 1, 2, 3) are the coeffi- cients for independent, linear, interaction and quadratic terms, respectively. 3. Results and Discussion 3.1. Direct Ozonation Process Experimental results shown that the color reduction pre- sented values higher than 95% in all runs excepting for the run 5 in which the reaction time was the lowest as- sayed (9.5 min). Thus, it seems that at times considered in the experimental design proposed, the color reduction evolution has been missed. From reaction time higher than 60 min, the reduction color presented an asymptotic trend close to 100% ( Figure 2). Results obtained in terms of color reduction by direct ozonation were fitted to a second-order polynomial mod- el (Table 2). For a confidence level of 95%, the p-value of the sig- nificant effects must be lower than 0.05. It was found that the significant terms were linear and quadratic terms corresponding to the time reaction (positive and negative effect, respectively). The RSM plot for the color reduc- tion is depicted in Figure 2. There is a reduction of the color reduction as th e MB concentration increases.  A. D. RODRIGUEZ-LOPEZ ET AL. Copyright © 2013 SciRes. MSCE Figure 2. Response surfase plot for the color reduction as a function of the Methylene blue concentration and time. The pH was fixed at 7.5. Table 2. Second-order model equation for the response surface fitted to the experimental data points obtained in the direct ozonation of organic dye solutions as a function of pH (1), NaCl concentration (2) and time (3). Coefficient Rcolor Independent β0 82.06410 Linear β1 −2.47667 β2 −0.22735 β3 0.89928 Quadratic β12 −0.00102 β13 −0.00405 β23 0.00078 Crossproduct β11 0.18457 β22 0.00177 β33 −0.00604 R2 67.5 It was found that for experimental conditions of MB concentration 50 mg/L and reaction time 60 min, the color reduction reaches values close to 100%, regardless the pH assayed. Thus, pH is the experimental variable that presents less influence on the color reduction. Ac- cording to the obtained model, it was possible to optim- ize the experimental conditions that should provide maximum values of color reduction. These experimental conditions were: pH = 3.3, MB concentration = 8.6 mg/L and reaction time = 74.3 min. The expected color reduc- tion would be 107%. Under a physical point of view, this mathematical value implies a total color reduction. In order to validate the optimization proposed, an extra ex- periment was done under the optimum conditions. The color reduction obtained was 99.4%, what means a devi- ation of the optimum expected value of 0.6%. 3.2. Catalyst-Assisted Ozonation Process Figure 3 shows the absorbance evolution with the time reaction course for all the catalysts assayed as well as for an experiment without any catalyst to make the proper comparison. Initial absorbances at 665 nm for all expe- riments are in a range of (12.57 - 13.27), this small dis- persion was expected since at t = 0, the absorbance should be the absorbance that presents the MB feed solu- tion of 100 mg/L. Evolution with all catalysts follows the same decreasing trends but with different slopes. The r eduction color of th e MB feed solution with time is depicted in Figure 4. Catalyst that sh owed lowest col- or reduction response after 15 min was CuSO4·5H2O, whilst the best catalyst at the end of the treatment is by far, the CuSO4. When no catalyst was used, the color reduction is lo- cated among values obtained by catalysts until a reaction time of 10 min, afterwards, the color reduction shown is clearly l ower exce pt by the experim e nt wit h CuSO4·5H2O. Once the experiment was over, the highest color re- duction was shown by the CuSO4 reaching values up to 68.5%. Regarding the color reduction shown by the ex- periment without catalyst (only with ozone) the maxi- mum values were 41.0%. Comparing both maximum color reduction with CuSO4 catalyst and without catalyst, it was found differences of color reduction of about 67.1% for the CuSO4 catalyst. Catalyst doses assayed had a de- terminant effect on the color reduction after 15 min of reaction time (Figure 5). Figure 3. Absorbance variation with the reaction time course with differents catalysts and without catalyst. Cata- lyst dose fixed at 200 mg/L. [MB] (mg/L) Color removal (%) Time (min) 020406080100 020 40 60 80 100 120 50 60 70 80 90 100 110 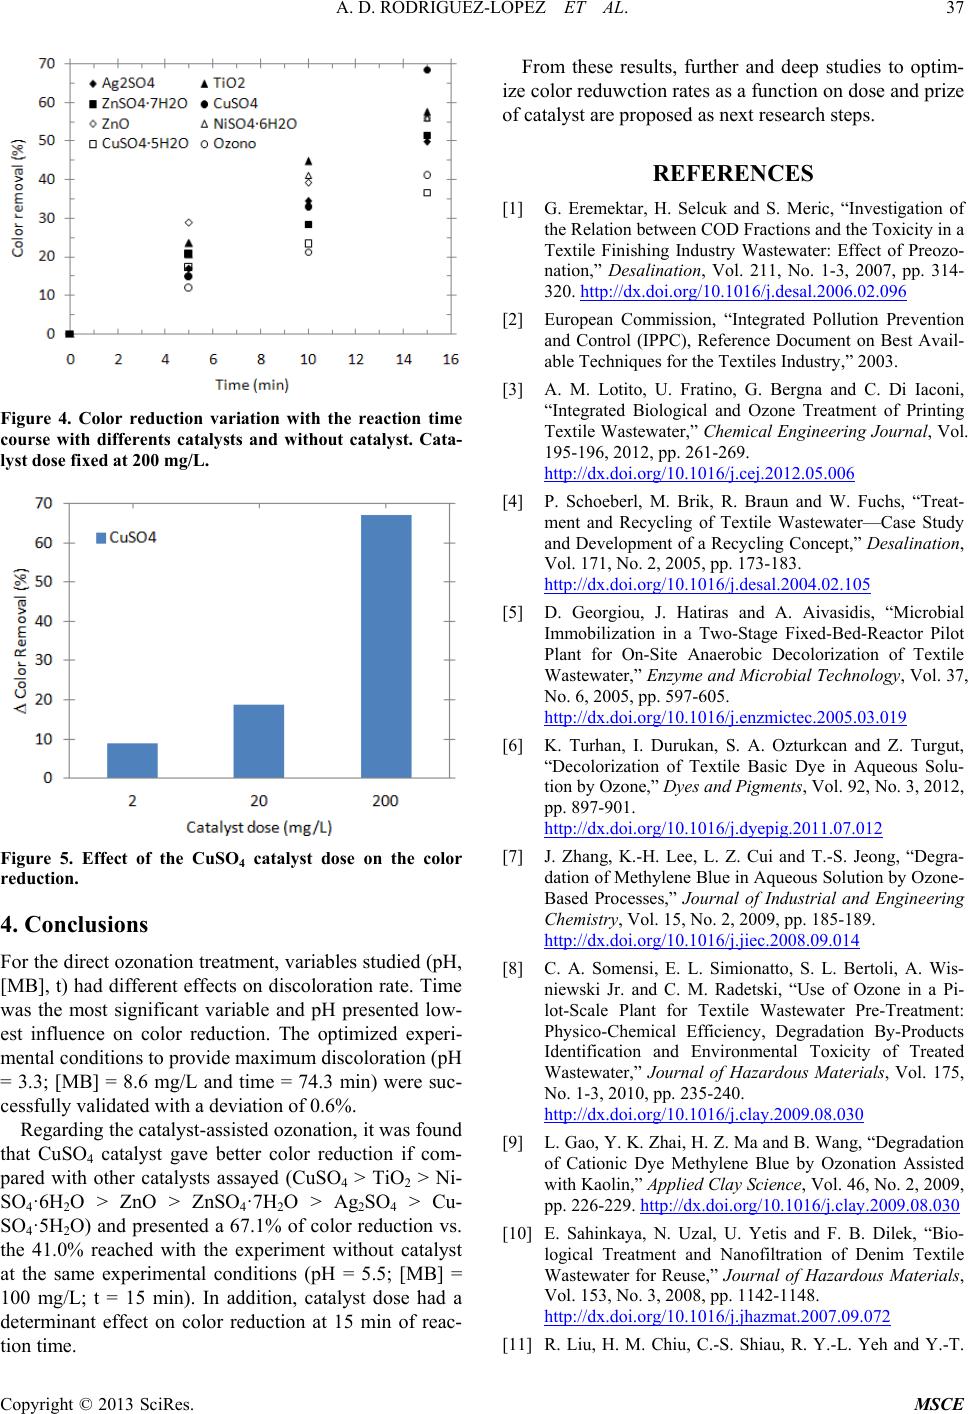 A. D. RODRIGUEZ-LOPEZ ET AL. Copyright © 2013 SciRes. MSCE Figure 4. Color reduction variation with the reaction time course with differents catalysts and without catalyst. Cata- lyst dose fixed at 200 mg/L. Figure 5. Effect of the CuSO4 catalyst dose on the color reduction. 4. Conclusions For the direct ozonation treatment, variables studied (pH, [MB], t) had different effects on discoloration rate. Time was the most significant variable and pH presented low- est influence on color reduction. The optimized experi- mental conditions to provide maximum discoloration (pH = 3.3; [MB] = 8.6 mg/L and time = 74.3 min) were suc- cessfully validated with a deviation of 0.6%. Regarding the catalyst-as siste d o zon ation , it wa s f ound that CuSO4 catalyst gave better color reduction if com- pared with other catalysts assayed (CuSO4 > TiO2 > Ni- SO4·6H2O > ZnO > ZnSO4·7H2O > Ag2SO4 > Cu- SO4·5H2O) and presented a 67.1% of color reduction vs. the 41.0% reached with the experiment without catalyst at the same experimental conditions (pH = 5.5; [MB] = 100 mg/L; t = 15 min). In addition, catalyst dose had a determinant effect on color reduction at 15 min of reac- tion time. From these results, further and deep studies to optim- ize color reduwction rates as a function on dose and prize of catalyst are proposed as next research steps. REFERENCES [1] G. Eremektar, H. Selcuk and S. Meric, “Investigation of the Relation between COD Fractions and the Toxicity in a Textile Finishing Industry Wastewater: Effect of Preozo- nation,” Desalination, Vol. 211, No. 1-3, 2007, pp. 314- 320. http://dx.doi.org/10.1016/j.desal.2006.02.096 [2] European Commission, “Integrated Pollution Prevention and Control (IPPC), Reference Document on Best Avail- able Techniques for the Textiles Industry,” 2003. [3] A. M. Lotito, U. Fratino, G. Bergna and C. Di Iaconi, “Integrated Biological and Ozone Treatment of Printing Textile Wastewater,” Chemical Engineering Journal, Vol. 195-196, 2012, pp. 261-269. http://dx.doi.org/10.1016/j.cej.2012.05.006 [4] P. Schoeberl, M. Brik, R. Braun and W. Fuchs, “Treat- ment and Recycling of Textile Wastewater—Case Study and Development of a Recycling Concept,” Desalination, Vol. 171, No. 2, 2005, pp. 173-183. http://dx.doi.org/10.1016/j.desal.2004.02.105 [5] D. Georgiou, J. Hatiras and A. Aivasidis, “Microbial Immobilization in a Two-Stage Fixed-Bed-Reactor Pilot Plant for On-Site Anaerobic Decolorization of Textile Wastewater,” Enzyme and Microbial Technology, Vol. 37, No. 6, 2005, pp. 597-605. http://dx.doi.org/10.1016/j.enzmictec.2005.03.019 [6] K. Turhan, I. Durukan, S. A. Ozturkcan and Z. Turgut, “Decolorization of Textile Basic Dye in Aqueous Solu- tion by Ozone,” Dye s and Pigments, Vol. 92, No. 3, 2012, pp. 897-901. http://dx.doi.org/10.1016/j.dyepig.2011.07.012 [7] J. Zhang, K.-H. Lee, L. Z. Cui and T.-S. Jeong, “Degra- dation of Methylene Blue in Aqueous Solution by Ozone- Based Processes,” Journal of Industrial and Engineering Chemistry, Vol. 15, No. 2, 2009, pp. 185-189. http://dx.doi.org/10.1016/j.jiec.2008.09.014 [8] C. A. Somensi, E. L. Simionatto, S. L. Bertoli, A. Wis- niewski Jr. and C. M. Radetski, “Use of Ozone in a Pi- lot-Scale Plant for Textile Wastewater Pre-Treatment: Physico-Chemical Efficiency, Degradation By-Products Identification and Environmental Toxicity of Treated Wastewater,” Journal of Hazardous Materials, Vol. 175, No. 1-3, 2010, pp. 235-240. http://dx.doi.org/10.1016/j.clay.2009.08.030 [9] L. Gao, Y. K. Zhai, H. Z. Ma and B. Wang, “Degradation of Cationic Dye Methylene Blue by Ozonation Assisted with Kaolin,” Applied Clay Science, Vol. 46, No. 2, 2009, pp. 226-229. http://dx.doi.org/10.1016/j.clay.2009.08.030 [10] E. Sahinkaya, N. Uzal, U. Yetis and F. B. Dilek, “Bio- logical Treatment and Nanofiltration of Denim Textile Wastewater for Reuse,” Journal of Hazardous Materials, Vol. 153, No. 3, 2008, pp. 1142-1148. http://dx.doi.org/10.1016/j.jhazmat.2007.09.072 [11] R. Liu, H. M. Chiu, C.-S. Shiau, R. Y.-L. Yeh and Y.-T. 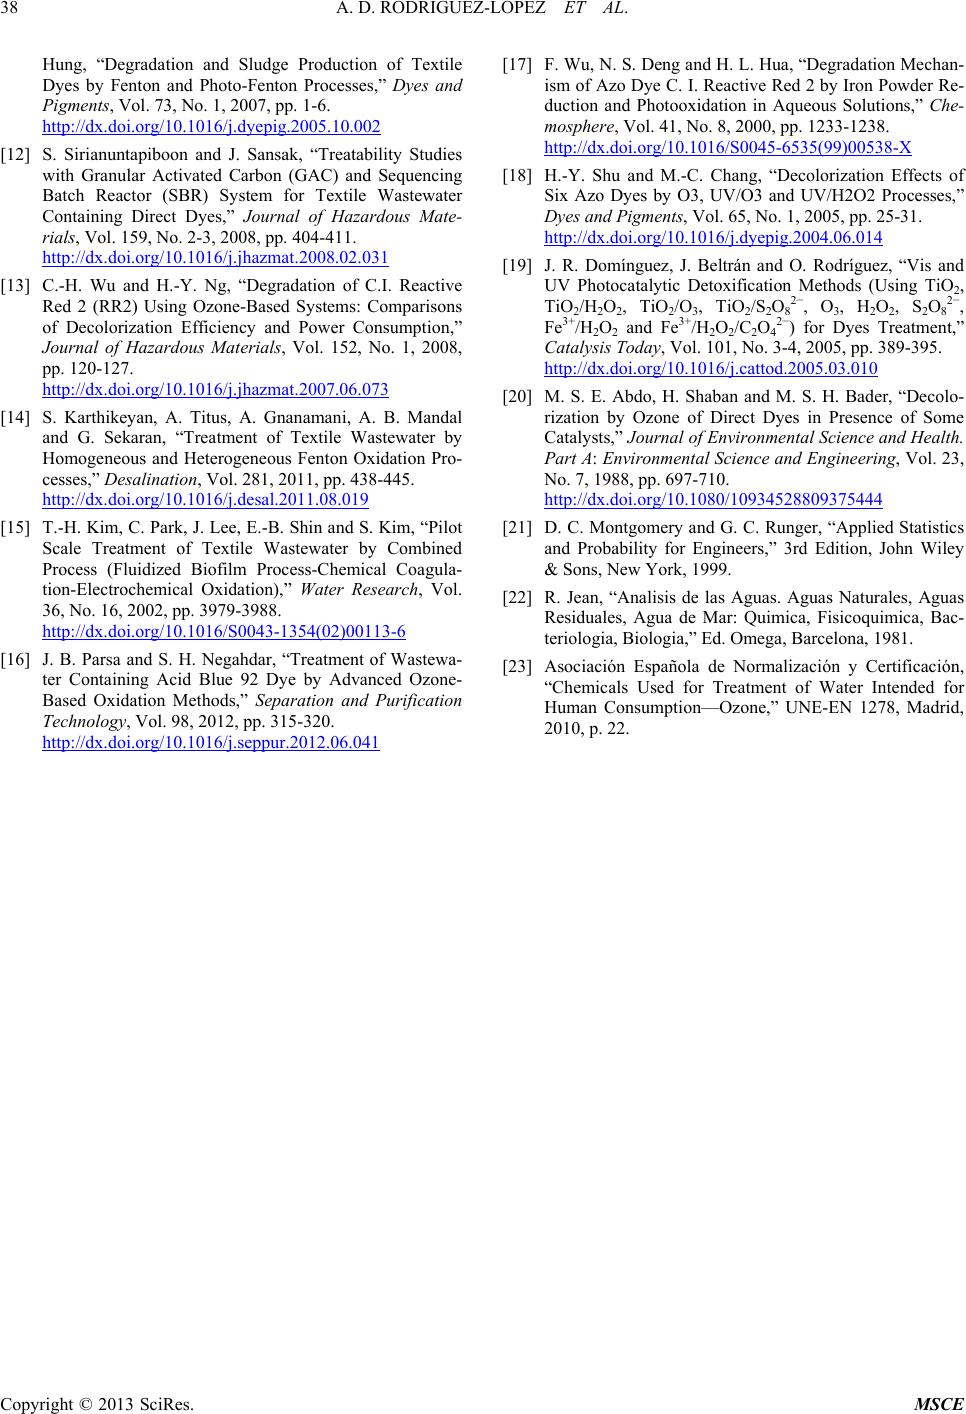 A. D. RODRIGUEZ-LOPEZ ET AL. Copyright © 2013 SciRes. MSCE Hung, “Degradation and Sludge Production of Textile Dyes by Fenton and Photo-Fenton Processes,” Dyes and Pigments, Vol. 73, No. 1, 2007, pp. 1-6. http://dx.doi.org/10.1016/j.dyepig.2005.10.002 [12] S. Sirianuntapiboon and J. Sansak, “Treatability Studies with Granular Activated Carbon (GAC) and Sequencing Batch Reactor (SBR) System for Textile Wastewater Containing Direct Dyes,” Journal of Hazardous Mate- rials, Vol. 159, No. 2-3, 2008, pp. 404-411. http://dx.doi.org/10.1016/j.jhazmat.2008.02.031 [13] C.-H. Wu and H.-Y. Ng, “Degradation of C.I. Reactive Red 2 (RR2) Using Ozone-Based Systems: Comparisons of Decolorization Efficiency and Power Consumption,” Journal of Hazardous Materials, Vol. 152, No. 1, 2008, pp. 120-127. http://dx.doi.org/10.1016/j.jhazmat.2007.06.073 [14] S. Karthikeyan, A. Titus, A. Gnanamani, A. B. Mandal and G. Sekaran, “Treatment of Textile Wastewater by Homogeneous and Heterogeneous Fenton Oxidation Pro- cesses,” Desalination, Vol. 281, 2011, pp. 438-445. http://dx.doi.org/10.1016/j.desal.2011.08.019 [15] T.-H. Kim, C. Park, J. Lee, E.-B. Shin and S. Kim, “Pilot Scale Treatment of Textile Wastewater by Combined Process (Fluidized Biofilm Process-Chemical Coagula- tion-Electrochemical Oxidation),” Water Research, Vol. 36, No. 16, 2002, pp. 3979-3988. http://dx.doi.org/10.1016/S0043-1354(02)00113-6 [16] J. B. Parsa and S. H. Negahdar, “Treatment of Wastewa- ter Containing Acid Blue 92 Dye by Advanced Ozone- Based Oxidation Methods,” Separation and Purification Technology, Vol. 98, 2012, pp. 315-320. http://dx.doi.org/10.1016/j.seppur.2012.06.041 [17] F. Wu, N. S. Deng and H. L. Hua, “Degradation Mechan- ism of A zo Dye C. I. Reactive Red 2 by Iron Powder Re- duction and Photooxidation in Aqueous Solutions,” Che- mosphere, Vol. 41, No. 8, 2000, pp. 1233-1238. http://dx.doi.org/10.1016/S0045-6535(99)00538-X [18] H.-Y. Shu and M.-C. Chang, “Decolorization Effects of Six Azo Dyes by O3, UV/O3 and UV/H2O2 Processes,” Dyes and Pigments, Vol. 65, No. 1, 2005, pp. 25-31. http://dx.doi.org/10.1016/j.dyepig.2004.06.014 [19] J. R. Domínguez, J. Beltrán and O. Rodríguez, “Vis and UV Photocatalytic Detoxification Methods (Using TiO2, TiO2/H2O2, TiO2/O3, TiO2/S2O82−, O3, H2O2, S2O82−, Fe3+/H2O2 and Fe3+/H2O2/C2O42−) for Dyes Treatment,” Catalysis Today, Vol. 101, No. 3-4, 2005, pp. 389-395. http://dx.doi.org/10.1016/j.cattod.2005.03.010 [20] M. S. E. Abdo, H. Shaban and M. S. H. Bader, “Decolo- rization by Ozone of Direct Dyes in Presence of Some Catalysts,” Journal of Environmental Science and Health. Part A: Environmental Science and Engineering, Vol. 23, No. 7, 1988, pp. 697-710. http://dx.doi.org/10.1080/10934528809375444 [21] D. C. Montgomery and G. C. Runger, “Applied Statistics and Probability for Engineers,” 3rd Edition, John Wiley & Sons, New York, 1999. [22] R. Jean, “Analisis de las Aguas. Aguas Naturales, Aguas Residuales, Agua de Mar: Quimica, Fisicoquimica, Bac- teriologia, Biologia,” Ed. Omega, Barcelona, 1981. [23] Asociación Española de Normalización y Certificación, “Chemicals Used for Treatment of Water Intended for Human Consumption—Ozone,” UNE-EN 1278, Madrid, 2010, p. 22.
|