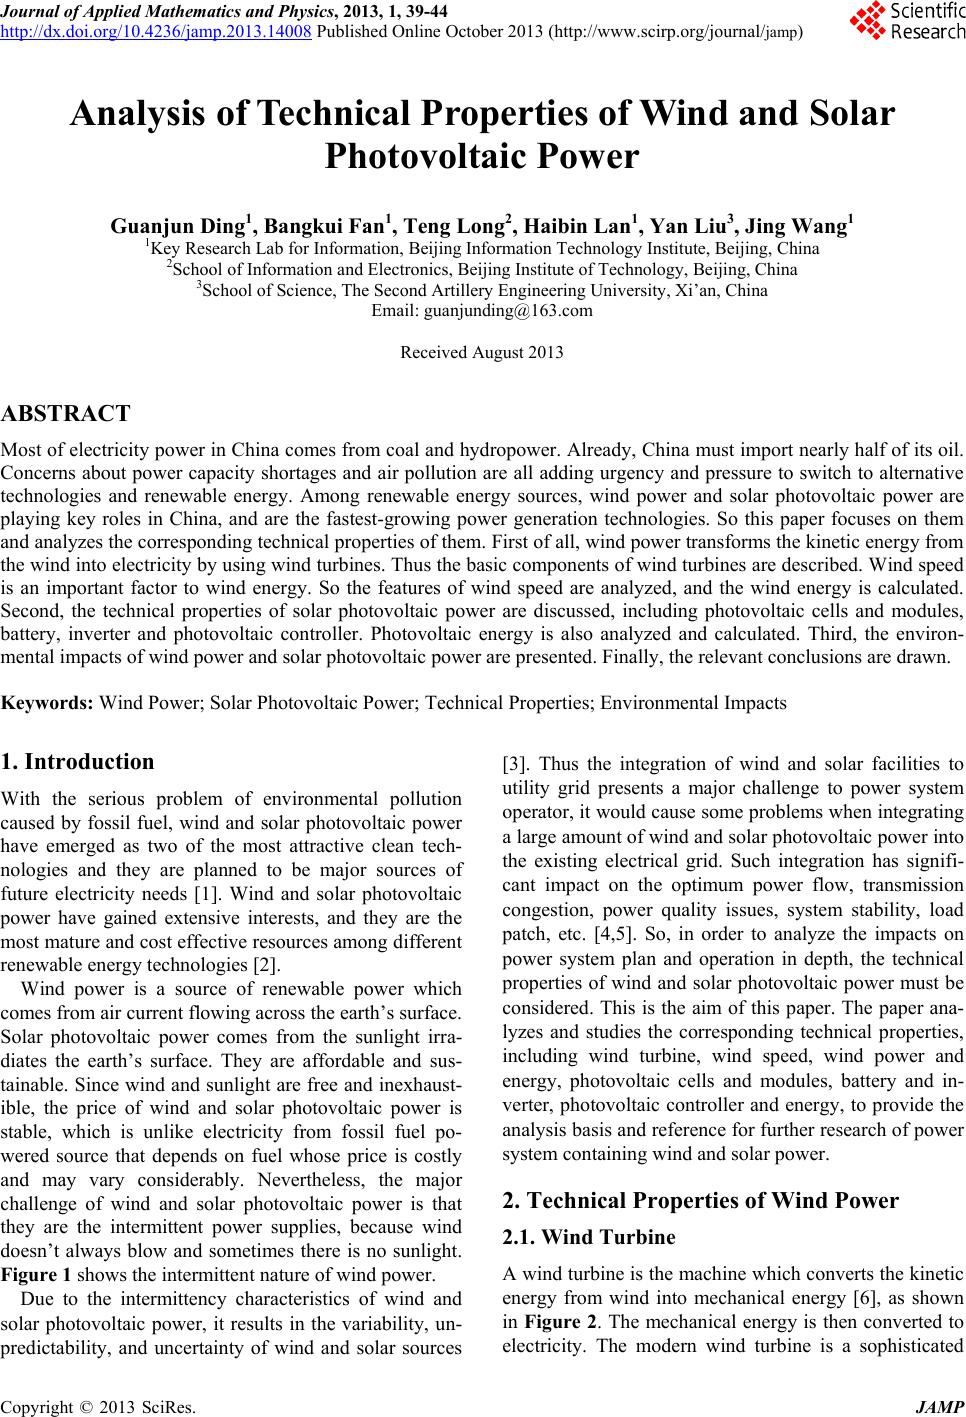
Journal of Applied Mathematics and Physics, 2013, 1, 39-44
http://dx.doi.org/10.4236/jamp.2013.14008 Published Online October 2013 (http://www.scirp.org/journal/jamp)
Copyright © 2013 SciRes. JAMP
Analysis of Technical Properties of Wind and Solar
Photovoltaic Power
Guanjun Ding1, Bangkui Fan1, Teng Long2, Haibin Lan1, Yan Liu3, Jing Wang1
1Key Research Lab for Information, Beijing Information Technology Institute, Beijing, China
2School of Information and Electronics, Beijing Institute of Technology, Beijing, China
3School of Science, The Second Artillery Engineering University, Xi’an, China
Email: guanjunding@163.com
Received August 2013
ABSTRACT
Most of electricity power in China comes from coal and hydropower. Already, China must import near ly half of its oil.
Concerns about power capacity shortages and air pollution are all adding urgency and pressure to switch to alternative
technologies and renewable energy. Among renewable energy sources, wind power and solar photovoltaic power are
playing key roles in China, and are the fastest-growing power generation technologies. So this paper focuses on them
and analyzes the corresponding technical properties of them. First of all, wind power transforms the kinetic energy from
the w ind into electricity by using wind turbines. Thus the basic components of wind turbines are described. Wind speed
is an important factor to wind energy. So the features of wind speed are analyzed, and the wind energy is calculated.
Second, the technical properties of solar photovoltaic power are discussed, including photovoltaic cells and modules,
battery, inverter and photovoltaic controller. Photovoltaic energy is also analyzed and calculated. Third, the environ-
mental impacts of wind power and solar photovoltaic power are presented. Finally, the relevant conclusions are drawn.
Keywords: Wind Power; Solar P hotovolt a ic Power; Technical Properties; Environmental Impacts
1. Introduction
With the serious problem of environmental pollution
caused by fossil fuel, wind and solar photovoltaic power
have emerged as two of the most attractive clean tech-
nologies and they are planned to be major sources of
future electricity needs [1]. Wind and solar photovoltaic
power have gained extensive interests, and they are the
most mature and cost effective resources among different
renewable energy technologies [2].
Wind power is a source of renewable power which
comes from air current flowing across the earth’s surface.
Solar photovoltaic power comes from the sunlight irra-
diates the earth’s surface. They are affordable and sus-
tainable. Since wind and sunlight are free and inexhaust-
ible, the price of wind and solar photovoltaic power is
stable, which is unlike electricity from fossil fuel po-
wered source that depends on fuel whose price is costly
and may vary considerably. Nevertheless, the major
challenge of wind and solar photovoltaic power is that
they are the intermittent power supplies, because wind
doesn’t always blow and sometimes there is no sunlight.
Figure 1 shows the intermittent nature of wind power.
Due to the intermittency characteristics of wind and
solar photovoltaic power, it results in the variability, un-
predictability, and uncertainty of wind and solar sources
[3]. Thus the integration of wind and solar facilities to
utility grid presents a major challenge to power system
operator, it would c ause some problems whe n integrating
a large amount of wind and solar photovoltaic power into
the existing electrical grid. Such integration has signifi-
cant impact on the optimum power flow, transmission
congestion, power quality issues, system stability, load
patch, etc. [4,5]. So, in order to analyze the impacts on
power system plan and operation in depth, the technical
properties of wind and solar photovoltaic power must be
considered. This is the aim of this paper. The paper ana-
lyzes and studies the corresponding technical properties,
including wind turbine, wind speed, wind power and
energy, photovoltaic cells and modules, battery and in-
verter, photovoltaic controller and energy, to provide the
analysis basis and reference for further research of power
system containing wind and solar power.
2. Technical Properties of Wind Power
2.1. Wind Turbine
A wind turbine is the machine which converts the kinetic
energy from wind into mechanical energy [6], as shown
in Figure 2. The mechanical energy is then converted to
electricity. The modern wind turbine is a sophisticated
G. J. DING ET AL.
Copyright © 2013 SciRes. JAMP
40
0
100
200
300
400
500
600
700
800
Power
(kW)
1st day2nd day3rd day
Figure 1. Diagram of the intermittent nature of wind power.
Figure 2. Schematic diagram of a wind turbine.
piece of machinery with aerodynamically designed rotor
and efficient power generation, transmission and regula-
tion components [7,8]. Its size ranges from a few Watts
to several Million Watts. Most of today’s commercial
machines are horizontal axis wind turbine with three
bladed rotors. The followings introduce briefly some of
the main components of wind turbine.
Rotor/Blades: The blades together with the hub are
called the rotor. The rotor drives the generator by
harnessing the kinetic energy in the wind. The blades
are aerodynamically shaped to best capture the wind.
The amount of energy wind turbine can capture is
proportional to the rotor sweep area.
Generator/Alternator: It is the part which produces
electricity from the kinetic energy captured by the
rotor. A generator produces DC power and an alter-
nator produces AC power, depending on the applica-
tion for the turbine.
Nacelle: It is the housing which protects the essential
motorized parts of a turbine.
Gearbox: It is used for most turbines above 10kW to
match the rotor speed to the generator speed.
The power curve of a wind turbine is a graph that
represents the turbine output power at different wind
speed [9]. It is usually provided by the turbine’s manu-
facture. Figure 3 shows an example of a wind turbine
power curve. It is notable that the output power is zero at
speed from 0 to 2.5 m/s. This happens due to there is not
sufficient kinetic energy in the wind to move the wind
turbine rotor. Normally the manufactures provide tech-
nical data sheets where the start up wind speed of the
turbine is given. Generally lower start up wind speeds
result in higher energy coming from the turbine. Some-
times the power curve information may be shown in a
table format. Some manufactures offer the exact power
values at different wind speed and present this in a table.
The power curve is then obtained by plotting the table
values.
2.2. Wind Speed
No other factor is more important to the amount of wind
power available to a wind turbine than wind speed. Be-
cause the power in wind is cubic function of wind speed,
changes in speed produce a remarkable effect on power.
Doubling the wind speed does not double the power
available it increases a whopping eight times.
Wind speed varies over time. Wind speed varies by the
minute, hour, day, season, and even by year. It is influ-
enced by weather system, the local land terrain and its
height above the ground surface. The average speed is
composed of winds above and below the average. The
cube of the average wind speed is always less than the
average of the cube of wind speed. Using the average
annual wind speed alone in the power equation would not
give the right results. It’s the wind speed abov e the aver-
age that contributes most of the power.
Since wind speed varies, it is necessary to capture this
variation in the model used to predict the energy produc-
tion. It is usually done using probability functions to de-
scribe wind speed over a period of time. The variation in
wind speed is best described by a probably density func-
tion (PDF) [10], as shown in Equation (1). A PDF is used
to model the wind velocity variation. It provides the
0
1
2
3
4
Output Power (kW)
48121620 24
Wind Speed (m/s)
Figure 3. Schematic diagram of the power curve of a wind
turbine.
G. J. DING ET AL.
Copyright © 2013 SciRes. JAMP
41
probability that an event occurs between two end points.
The area under the curve between any two speeds greater
than zero will equal the probability that wind will blow
somewhere between those two speeds.
(1)
where v represents in this case the wind speed, α is the
shape factor and θ is the scale factor. For a given average
wind speed, a smaller shape factor indicates a relatively
wide distribution of wind speeds around the average,
while a larger shaper factor indicates a relatively narrow
distribution of wind speeds around the average.
Wind speed calculated includes two types, i.e., the
arithmetic mean wind speed and the cubic root cube wind
speed [11].
The arithmetic mean wind speed is what normally
known as the average wind speed. It is given by:
( )
max
min
v
ave v
vfvv dv= ⋅⋅
(2)
where f (v) is the Weibull PDF, v is the data vector of
measured wind speed, vmin is the minimum measured
wind speed and vmax is the maximum measured wind
speed.
The use of arithmetic mean wind speed tends to unde-
restimate the electric power production. The cubic root
cube wind speed produces a better estimate of actual
power production. To find the cubic root cube average
speed, the data vector of wind speed is elevated to the
cube and multiplied by the PDF. The function is inte-
grated between vmin and vmax. Then it is elevated to cubic
root. The result is the cubic root cube average speed,
which is defined as:
( )
max
min
3
3v
crc v
vf vvdv= ⋅⋅
(3)
Likewise, where f (v) is the Weibull PDF, v is the data
vector of measured wind speed, vmin is the minimum
measured wind speed and vmax is the maximum measured
wind speed.
2.3. Wind Power and Energy
Wind power is a function of air density, the area inter-
cepting the wind and the wind speed [12]. It is calculated
as below:
3
1
2
P Sv
ε
= ⋅⋅
(4)
where P is the output power in watts, ε is the air density
in kg/m3, S is the area in m2 where wind is passing and v
is the wind speed in m/s.
Wind energy is power over some unit of time. The
energy production can be calculated substituting the av-
erage wind speed value in power Equation (4). Then
multiplying the Equation (4) by the hours of the period,
the energy is obtained as shown below:
3
1
2
ESv HD
ε
=⋅⋅ ⋅ ⋅
(5)
where E is the total energy in Wh, H is hours, D is days ,
and the variable v can be either the arithmetic mean wind
speed or the cubic root cube wind speed, but using the
cubic root cube wind speed is better estimation of the
average wind speed than the arithmetic mean wind speed.
3. Technical Properties of Solar Photovoltaic
Power
3.1. Photovoltaic Cells and Modules
Photovoltaic cells consist of semiconductor material, i.e.,
silicon, which is at present the most often utilized [13].
Photovoltaic cells have electric fields which can force
electrons to flow in a certain direction. The flowing of
electrons is a current and it can be used externally. Be-
cause of depending on the behavior of the solar resource,
the electricity produced by photovoltaic cells is intermit-
tent. The technology used is modular, since it could be
connected to pre-existing installations of photovoltaic
panel, as shown in Figure 4, and r eplaced i ndividual l y.
The efficiency of photovoltaic cells decreases with in-
creases in temperature. Photovoltaic panel reacts directly
to sunlight. The chances of change in weather could
block sunlight, such as clouds, rain and sandstorms.
Photovoltaic modules are made up of interconnected
photovoltaic cells. The cells in the modules are con-
nected together in a designed configuration to deliver
useful current and voltage. The cells connected in paral-
lel increase the current output, while the cells connected
in series increase the voltage output. Groups of several
photovoltaic modules connected together are called solar
array.
3.2. Battery
Batter y is a devic e which s tores D C electr ical ene rgy in
electrochemical form for later use [14]. Due to not all
Figure 4. Schematic diagram of photovoltaic panel.
G. J. DING ET AL.
Copyright © 2013 SciRes. JAMP
42
batteries rechargeable, they are divided in two catego-
ries. The first category can’t be recharged and only
converts chemical energy to electrical energy. The
second can be recharged. Because energy is lost in the
chemical reaction during charging or recharging, the
conversion efficiency of battery is not perfect. The
internal components include positive and negative
electrodes plates [15]. The life of battery is directly
related to how deep the battery is cycled. Discharge
depth refers to how much capacity could be used from
the battery. Most systems are designed for regular dis-
charges up to 40 - 80 percent.
Temperature can affect the performance of battery.
The capacity of battery will increase at higher tempera-
ture and decrease at lower temperature. The life of bat-
tery will increase at lower temperature and decrease at
higher temperature.
Equation (6) describes how to calculate the number of
batteries connected in series to reach the voltage required
by the system. Where VDC is the DC system voltage
(Volt), VB is the battery voltage (Volt).
DC
SB
V
NV
=
(6)
Equation (7) describes how to calculate the number of
batteries connected in parallel to reach the Amp hours
required by the system. Where CR is the required battery
bank capacity (Ah), CS is the capacity of selected battery
(Ah).
R
PS
C
NC
=
(7)
The total number of batteries needed can be obtained
by multiplying the number in series and the number in
parallel as shown in equation (8).
SP
NNN= ⋅
(8)
3.3. Inverter
The inverter converts the DC electrical energy to AC
electrical energy, which can then be used to operate AC
devices like the ones plugged in to most household elec-
trical outlets [16]. The normal output AC waveform of
inverter is sine wave with frequency of 50/60 Hz.
Inverters are available including three different cate-
gories, i.e., grid tied battery less, grid tied with battery
back-up and stand alone. The most popular inverters are
grid tied battery less. These inverters directly connect to
the public utility, using the utility power as storage bat-
tery. When the sun shines, the electricity comes from the
photovoltaic via the inverter. If the photovoltaic array
produces more power than used, the excess is sold to
utility power company through the electric meter.
Inverter sizing contains calculating the number of in-
verters needed for the photovoltaic system. When select-
ing an inverter must have a DC voltage equal to inverter
DC voltage and have an AC voltage and frequency equal
to home and utility values.
L
II
P
NP
=
(9)
Equation (9) describes how to calculate the number of
inverters needed. Where PL represents the maximum
continuous power loading home consumes, PI is the
maximum power supplied by the inverter.
3.4. Photovoltaic Controller
The photovoltaic controller operates as a voltage regula-
tor. Its primary function is to prevent the battery from
overcharged. When the batteries are fully charged, the
controller will stop or decrease the amount of current
flowing into the battery. The average efficiency of the
controller ranges from 95% to 98%.
If high current is required, two or more controllers can
be used. When more than one controller used, it is ne-
cessary to divide the array into sub-arrays. Each sub-
array is wired into the same battery bank. The photovol-
taic controller con tains the five different types, i.e., shun t
controller, single stage series controller, diversion con-
troller, pulse width modulation controller and maximum
power point tracking controller. The maximum power
point tracking controller is the best for photovoltaic sys-
tem at present. It allows the controller to track the maxi-
mum power point of the array throughout the day to de-
livery the maximum available solar energy to system.
Before maximum power point tracking controller was
available, the array voltage would be pulled down
slightly above the battery voltage while charging.
When selecting a controller must be sure → ensured it
has an output voltage rating equal to the nominal battery
voltage, also the maximum photovoltaic voltage should
be less than the ma ximum cont rol ler voltage rating.
3.5. Photovoltaic Energy
Hourly average solar radiation values are usually used to
calculate the photovoltaic energy (kWh) generated for
one year at a specific site, as shown in Equation (10).
( )( )
365
YPM AVEPM AVE
EPR TR= ⋅⋅
(10 )
where EY is the yearly expected photovoltaic energy
production at a given site (kWh), PPM (RAVE) is the pho-
tovoltaic module output power at an average hourly solar
irradiation (RAVE), TPM (RAVE) is the time of the sun hit the
photovoltaic module at RAVE, the product of 365 is to
change daily to yearly quantities.
G. J. DING ET AL.
Copyright © 2013 SciRes. JAMP
43
3.6. Environmental Impacts of Wind and Solar
Photovoltaic Pow e r
The impacts of wind power on environment are relatively
small. The impacts on wildlife in operation stage are re-
lated to the noise of wind turbines. Due to the power
lines associated with wind farms, it may cause electro-
magnetic radiation or possible forest fire. For offshore
wind farms, the impacts are those with regard to fishing,
navigation and effects on marine life. The power lines
buried under the seabed could have an impact on breaka-
ble ecosystems. If the offshore wind farms close to shore,
they may have an impact on birds.
The first aspect of the environmental impacts of solar
photovoltaic power is about aesthetics when its compo-
nents installed. Photovoltaic panels may occupy some
spaces, e.g., building roofs, road and railroad margins.
The second aspect of the impacts is associated with the
photovoltaic cells production. During the production
process and the arrangement stage, it uses some poison-
ous materials, which are harmful to environment.
4. Conclusions
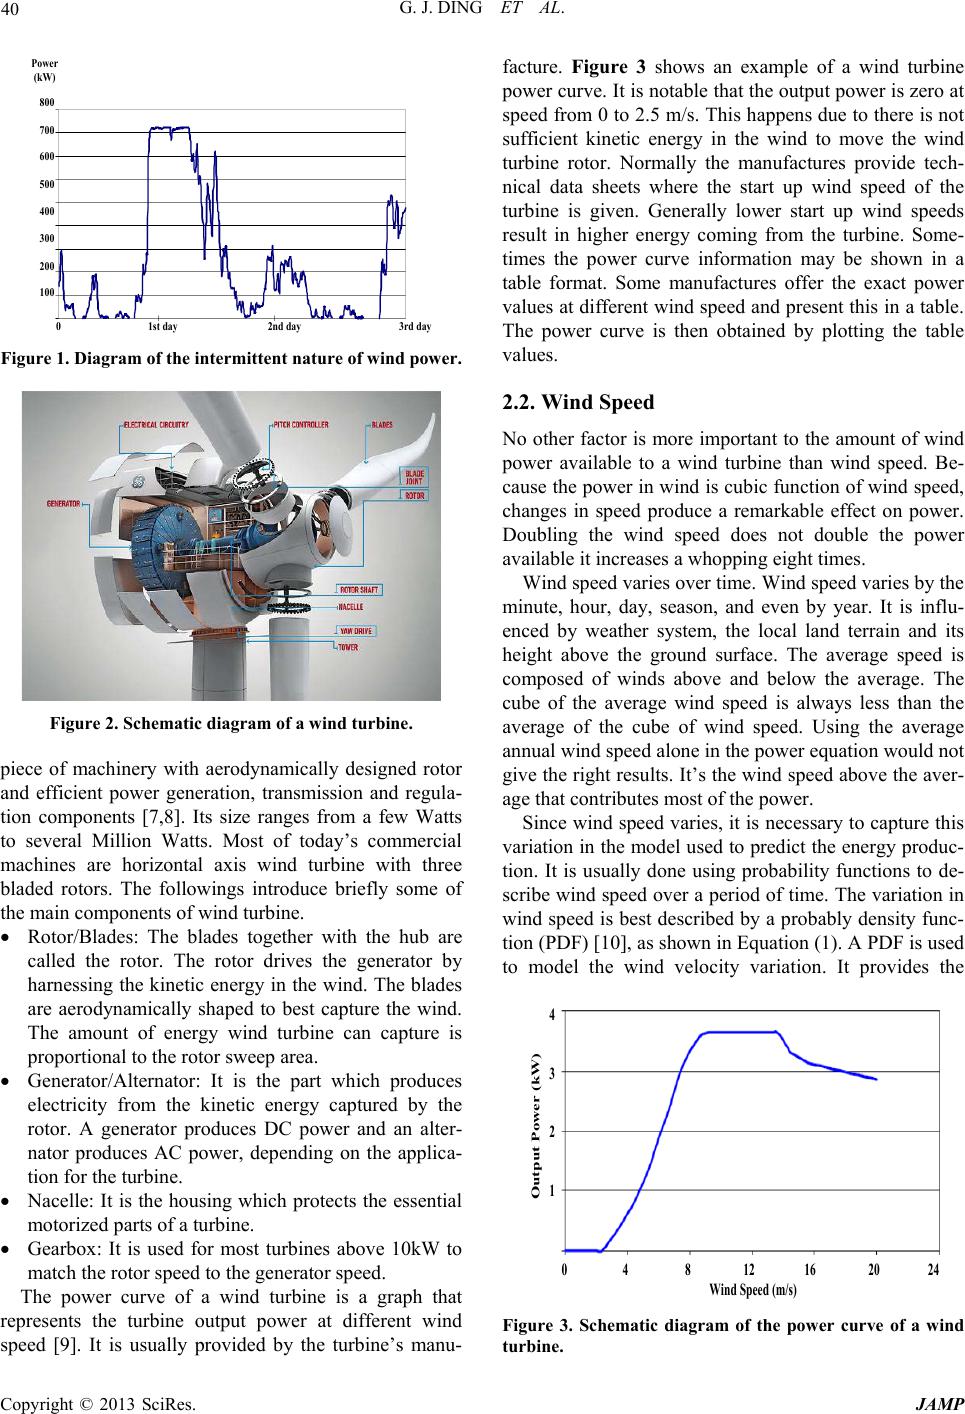
Wind energy transforms the kinetic energy from the wind
into usable electricity by utilizing wind turbine. Wind
turbine is composed basically of a tower base, three
blades and a generator at the middle hub where the mo-
tion of the blades is transfor med into electricity by means
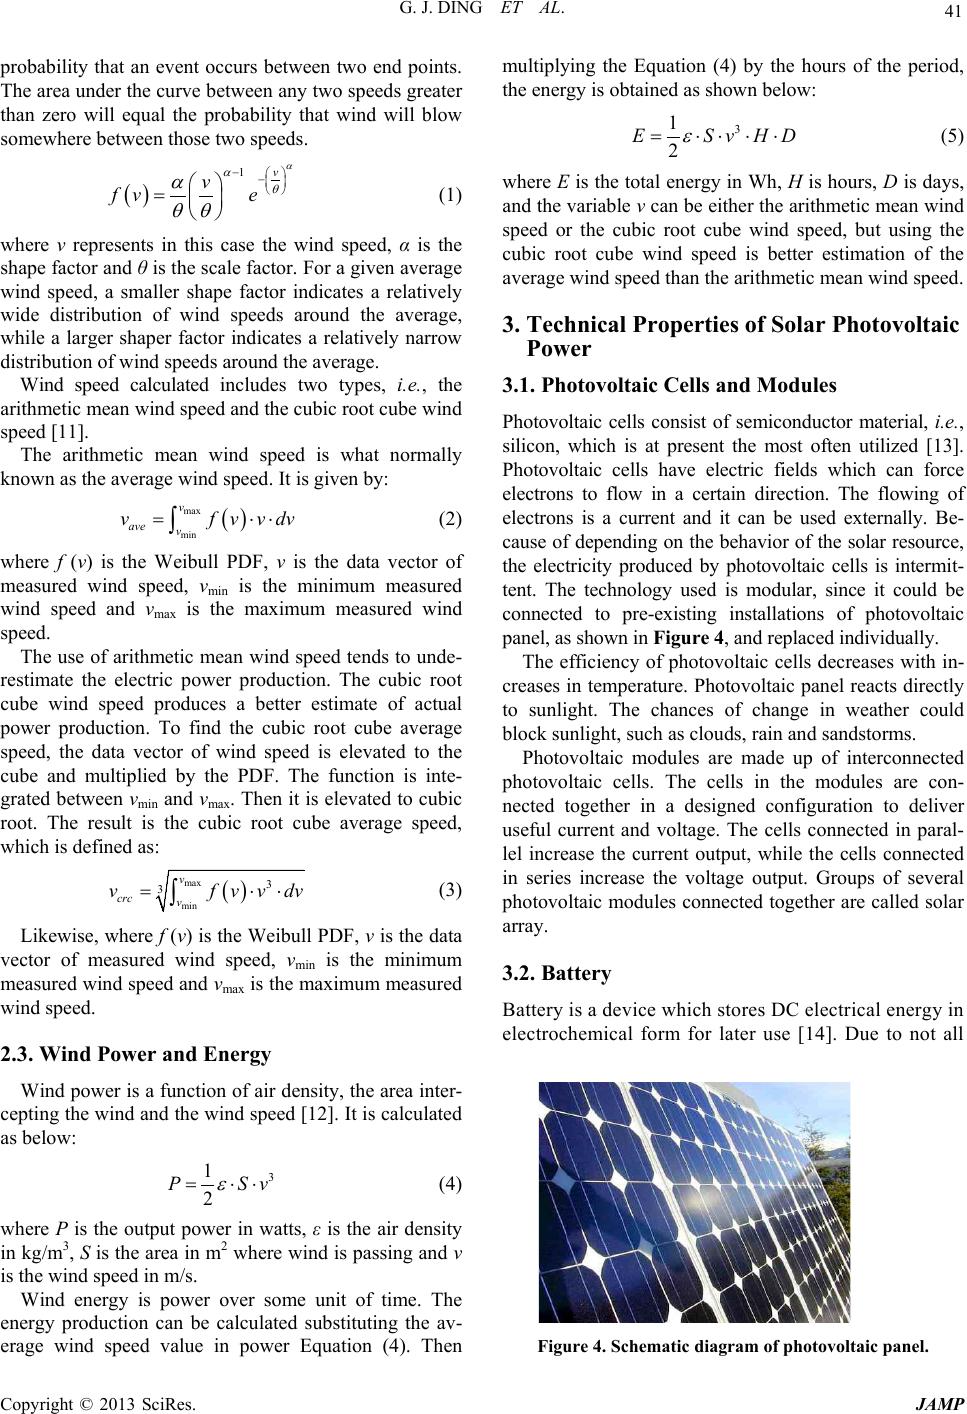
of inductance. The advantage of power curve is that it
includes the wind turbine efficiency. Wind speed is a
quite important element to wind energy. By the Weibull
probably density function (PDF), the wind velocity vari-
ation can be described accurately. Combined with the
Weibull PDF, the arithmetic mean wind speed and the
cubic root cube wind speed can be derived and calculated.
Based on the obtained wind speed, wind power and
energy can be calculated.
Solar photovoltaic power generates electricity from the
sunlight radiation. When sunlight strikes photovoltaic
cells, the direct current is generated. Photovoltaic mod-
ules consist of interconnected photovoltaic cells. To in-
crease the voltage and current output, photovoltaic cells
are connected in series and parallel respectively. For
storing DC electrical energy for later use, battery is ne-
cessary. The features of battery could be influenced by
temperature. The life of battery is directly relevant to
how deep it is cycled. To convert DC electrical energy to
AC electrical energy for AC devices running, the inverter
must be provided. The type of grid tied battery is less
commonly used in some inverters types. The photovol-
taic controller serves as a role of voltage regulator to
prevent battery from overcharged. To calculate the pho-
tovoltaic energy at a given site, hourly average solar rad-
iation values are used.
From these derived technical properties, the analysis
basis and reference can be provided for further study on
the power system including wind and solar photovoltaic
power.
5. Acknowledgements
This work was fin ancially sup ported by the 52nd General
Program of China Postdoctoral Science Foundation
(2012M521837)
REFERENCES
[1] G. Jose, “The Case for Renewable Energies,” Thematic
Background Paper at the International Conference for
Renewable Energies, Bonn, Germany, 2004.
http://www.renewables2004.de
[2] J. Martin, “Learning in Renewable Energy Technology
Development,” Ph.D. Thesis, Utrecht University, Utrecht,
2005.
[3] M. Patel, “Wind and Solar Power Systems,” 2nd Edition,
Taylor & Fr ancis, 2006.
[4] M. S. Lu, C. L. Chang and W. J. Le e, Impact of Wind
Generation on a Transmission System,” Proceedings of
Power Symposium, NAPS, 2007.
[5] C. I. Chai, W. J. Lee, P. Fuangfoo, M. Williams and J.
Liao, “System Impact Study for the Interconnection of
Wind Generation and Utility System,” Proceedings of
IEEE I&CPS Conference, Clearwater Beach, Florida,
2005.
[6] J. F. Manwell, J. G. Mcgowan and A. L. Rogers, “Wind
Energy Explained,” Wiley Press, New York, 2002.
http://dx.doi.org/10.1002/0470846127
[7] F. Bianchi, H. D. Battista and R. Mantz, “Wind Turbine
Control Systems,” Springer-Verlag Press, London, UK,
2007.
[8] K. Tan and S. Islam, “Optimum Control Strategies in
Energy Conversion of pmsg Wind Turbine System with-
out Mechanical Sensors,” IEEE Transactions on Energy
Conversion, Vol. 19, No. 2, 2004, pp. 392-399.
http://dx.doi.org/10.1109/TEC.2004.827038
[9] G. Ramtharan, N. Jenkins and L. Anaya, Modelling and
Control of Synchronous Generators for Wide Range Va-
riable Speed Wind Turbines,” Wind Energy, Vol. 10, No.
3, 2007, pp. 231-246. http://dx.doi.org/10.1002/we.219
[10] E. G. Pavia and J. J. Brien, “Weibull Statistics of Wind
Speed over the Ocean,” Journal of Climate and Applied
Meteorology, Vol. 25, No. 10, 1986, pp. 1324-1332.
http://dx.doi.org/10.1175/1520-0450(1986)025<1324:WS
OWSO>2.0.CO;2
[11] G. J. Herbert, S. Iniyan, E. Sreevalsan and S. Rajapandian,
A Review of Wind Energy Technologies,” Renewable
and Sustainable Energy Reviews, Vol. 11, No. 6, 2007, pp.
1117-1145. http://dx.doi.org/10.1016/j.rser.2005.08.004
[12] The Wind Indicator, “Wind Energy Facts and Figures
from Wind Power Monthly,” Windpower Monthly News
Magazine, Denmark, USA, 2005.
[13] B. S. Borowy and Z. M. Salameh, “Optimum Photovol-
G. J. DING ET AL.
Copyright © 2013 SciRes. JAMP
44
taic Array Size for a Hybrid Wind/PV System ,” IEEE
Transactions on Energy Conversion, Vol. 9, No. 3, 2004,
pp. 482-488. http://dx.doi.org/10.1109/60.326466
[14] B. S. Borowy and Z. M. Salameh, “Methodology for Op-
timally Sizing the Combination of a Battery Bank and PV
array in a Wind/PV Hybrid System,” IEEE Transactions
on Energy Conversion, Vol. 11, No. 2, 2006, pp. 367-375.
http://dx.doi.org/10.1109/60.507648
[15] A. Smeets, “Investiga tion of the Solar Production of Sili-
con Nitride by Carbothermic Reduction of Silicon Dio-
xide,” Diplomarbeit ETH-Swiss Federal Institute of Te-
chnology, Swiss, 2003.
[16] PVDI, “Solar Energy International (Photovoltaic Design
and Installation Manual),” New Society Press, New York,
2007.