Paper Menu >>
Journal Menu >>
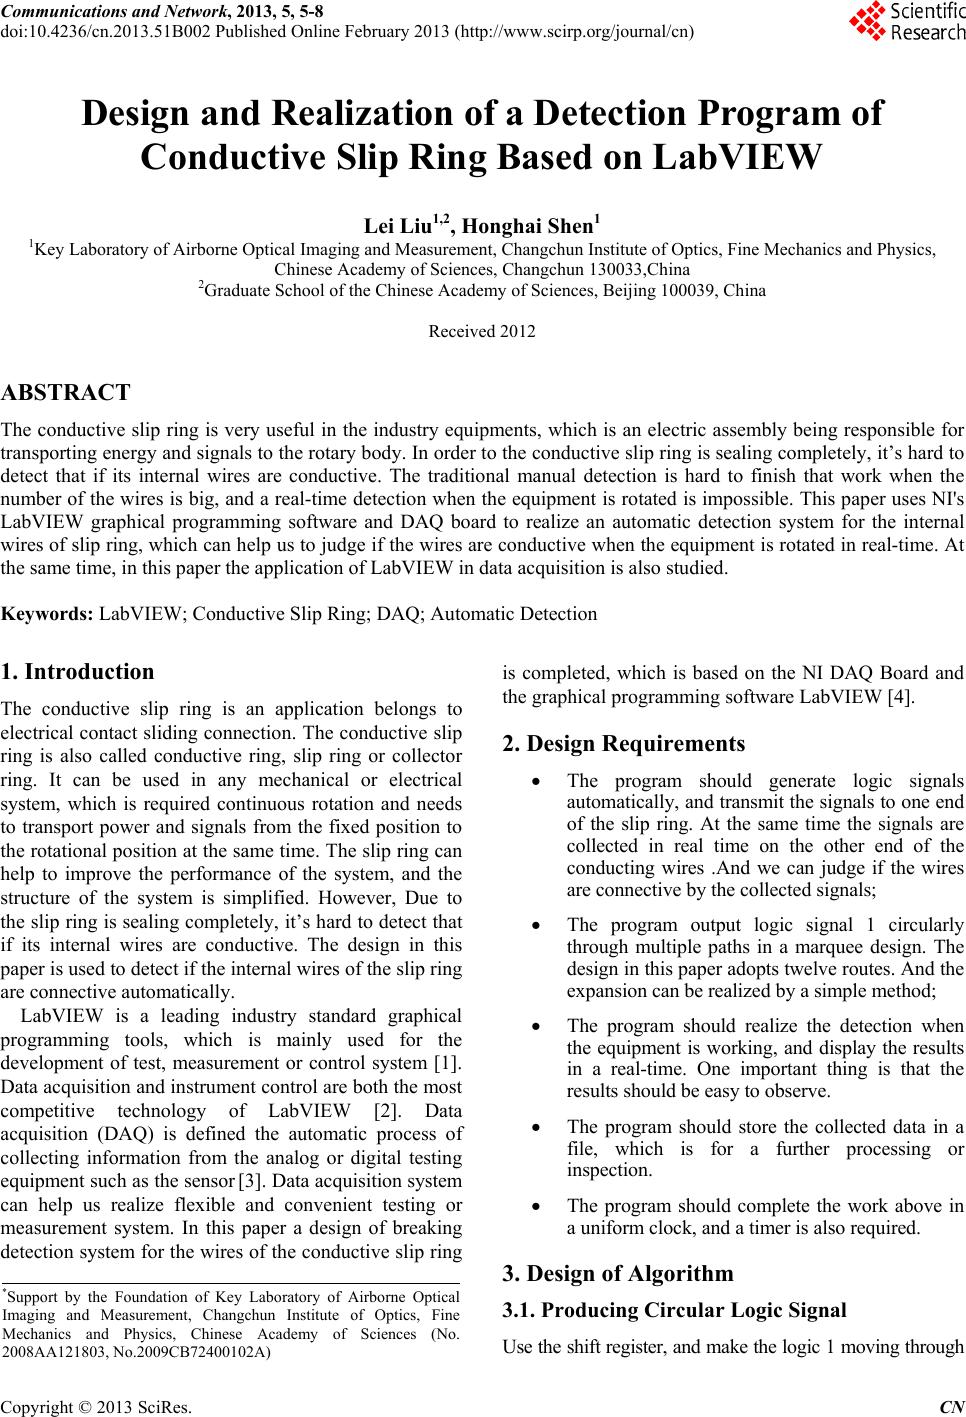 Communications and Network, 2013, 5, 5-8 doi:10.4236/cn.2013.51B002 Published Online February 2013 (http://www.scirp.org/journal/cn) Design and Realization of a Detection Program of Conductive Slip Ring Based on LabVIEW Lei Liu1,2, Honghai Shen1 1Key Laboratory of Airborne Optical Imaging and Measurement, Changchun Institute of Optics, Fine Mechanics and Physics, Chinese Academy of Sciences, Changchun 130033,China 2Graduate School of the Chinese Academy of Sciences, Beijing 100039, China Received 2012 ABSTRACT The conductive slip ring is very useful in the industry equipments, which is an electric assembly being responsible for transporting energy and sign als to the rotary body. In order to the conductiv e slip ring is sealing co mpletely, it’s hard to detect that if its internal wires are conductive. The traditional manual detection is hard to finish that work when the number of the wires is big, and a real-time detection when the equipment is rotated is impossible. This paper uses NI's LabVIEW graphical programming software and DAQ board to realize an automatic detection system for the internal wires of slip ring, which can help us to judge if the wires are conductive when the equipment is rotated in real-time. At the same time, in this paper the application of LabVIEW in data acquisition is also studied. Keywords: LabVIEW; Conductive Slip Ring; DAQ; Au tomatic Detection 1. Introduction The conductive slip ring is an application belongs to electrical contact sliding connection. The conductive slip ring is also called conductive ring, slip ring or collector ring. It can be used in any mechanical or electrical system, which is required continuous rotation and needs to transport power and signals from the fixed position to the rotational positio n at the same time. The slip ring can help to improve the performance of the system, and the structure of the system is simplified. However, Due to the slip ring is sealing completely, it’s hard to detect that if its internal wires are conductive. The design in this paper is used to detect if the internal wires of the slip ring are connective automatically. LabVIEW is a leading industry standard graphical programming tools, which is mainly used for the development of test, measurement or control system [1]. Data acquisition and instru ment contro l are both the most competitive technology of LabVIEW [2]. Data acquisition (DAQ) is defined the automatic process of collecting information from the analog or digital testing equipment such as the sensor [3]. Data acquisition system can help us realize flexible and convenient testing or measurement system. In this paper a design of breaking detection system for the wires of th e conductive slip ring is completed, which is based on the NI DAQ Board and the graphical programming software LabVIEW [4]. 2. Design Requirements The program should generate logic signals automatically, an d transmit the signals to one end of the slip ring. At the same time the signals are collected in real time on the other end of the conducting wires .And we can judge if the wires are connective by the collected signals; The program output logic signal 1 circularly through multiple paths in a marquee design. The design in this paper adopts twelve routes. And the expansion can be realized by a simple method; The program should realize the detection when the equipment is working, and display the results in a real-time. One important thing is that the results should be easy t o obse rve. The program should store the collected data in a file, which is for a further processing or inspection. The program should complete the work above in a uniform cl ock, an d a t imer is also required. 3. Design of Algorithm *Support by the Foundation of Key Laboratory of Airborne Optical Imaging and Measurement, Changchun Institute of Optics, Fine Mechanics and Physics, Chinese Academy of Sciences (No. 2008AA121803, No.2009CB72400102A) 3.1. Producing Circular Logic Signal Use the shift register, and make the logic 1 moving through Copyright © 2013 SciRes. CN  L. LIU, H. H. SHEN 6 the bits of the register. By this way the program can generate and output logic signal 1 circularly through multiple paths (as shown in Figure 1). 3.2. Output and Acquisition of the Signals The output and acquisition of the signals on the ends of the wires are the keys of this design. This design uses NI’s DAQ board for the output and the acqu isition of the signals (as shown in Figure 2). The output and acquisition use sequence structure, and there should be a certain delay between the output and the acquisition. To ensure the collected data is right, it’s best to set th e delay time to be the half of the cycle. 3.3. Observe the Results in Real-time The output and collected signals are connected to some LED lamps at the same time [5]. By this way the results can be observe easily. If the wires are conducted, the signal lamps on the both en ds will be lighted; however if the wires are breaking, the lamps on the acquisition side will not be lighted. By this way the observation in real-time is realized (as shown in Figure 3). Figure 1. Achieve a shift register function in LabVIEW. Figure 2. Output and acquire the signals by DAQ board. 3.4. Save the Data to a File The program will save the data to a file by using the sequence structure. First it will open a file and insert a header to the file (as shown in Figure 4); then, the data will be saved to the file in a one-dimensional array [6]. Saving data and inserting the header need use two different VIs (A function module in LabVIEW is called a VI, VI is a short for Virtual instrument). The collected logic signals cannot be saved to the file directly, so a data type conversion is required (as shown in Figure 5). For a further analysis of the data, the program will save an additional data to another file, which is combined with a data Figure 3. Display the detection results in real time by connecting the signals to LED lamps. Figure 4. Save the data and Insert the header. Copyright © 2013 SciRes. CN 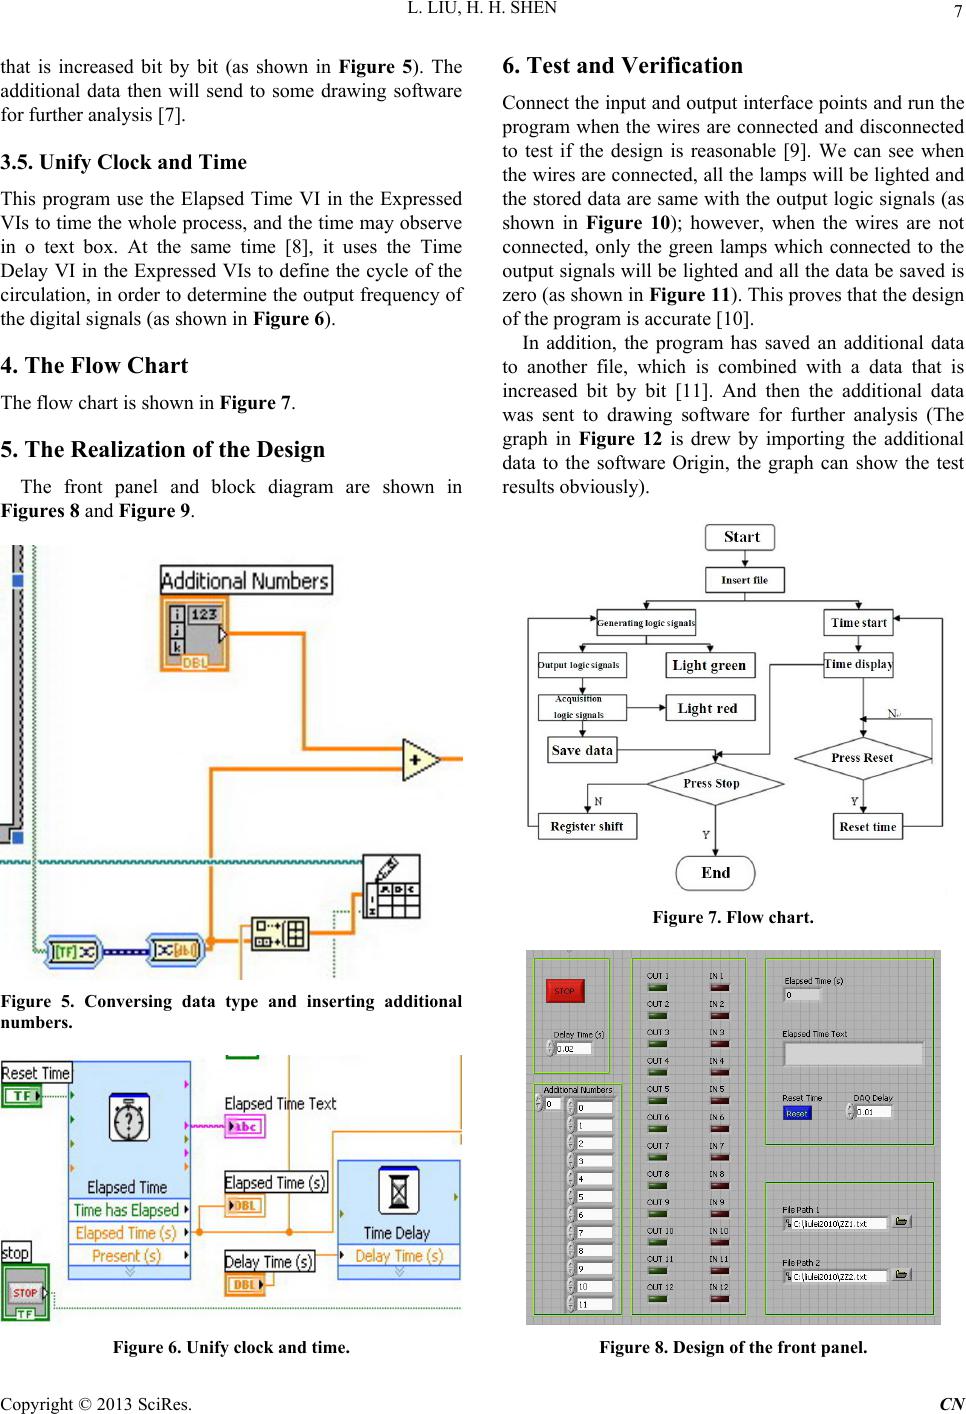 L. LIU, H. H. SHEN 7 that is increased bit by bit (as shown in Figure 5). The additional data then will send to some drawing software for further analysis [7]. 3.5. Unify Clock and Time This program use the Elapsed Time VI in the Expressed VIs to time the whole process, and the time may obs erve in o text box. At the same time [8], it uses the Time Delay VI in the Expressed VIs to define the cycle of the circulation, in order to determin e the output frequency of the digital signals (as shown in Figure 6). 4. The Flow Chart The flow chart is shown in Figure 7. 5. The Realization of the Design The front panel and block diagram are shown in Figures 8 and Figure 9. Figure 5. Conversing data type and inserting additional numbers. Figure 6. Unify clock and time. 6. Test and Verification Connect the input and output interface points and run the program when the wires are connected and disconnected to test if the design is reasonable [9]. We can see when the wires are connected, all the lamps will be lighted and the stored data are same with the output logic sig nals (as shown in Figure 10); however, when the wires are not connected, only the green lamps which connected to the output signals will be lighted and all the data be saved is zero (as shown in Figure 11). This proves that th e design of the program is accurate [10]. In addition, the program has saved an additional data to another file, which is combined with a data that is increased bit by bit [11]. And then the additional data was sent to drawing software for further analysis (The graph in Figure 12 is drew by importing the additional data to the software Origin, the graph can show the test results obviously ) . Figure 7. Flow chart. Figure 8. Design of the front panel. Copyright © 2013 SciRes. CN 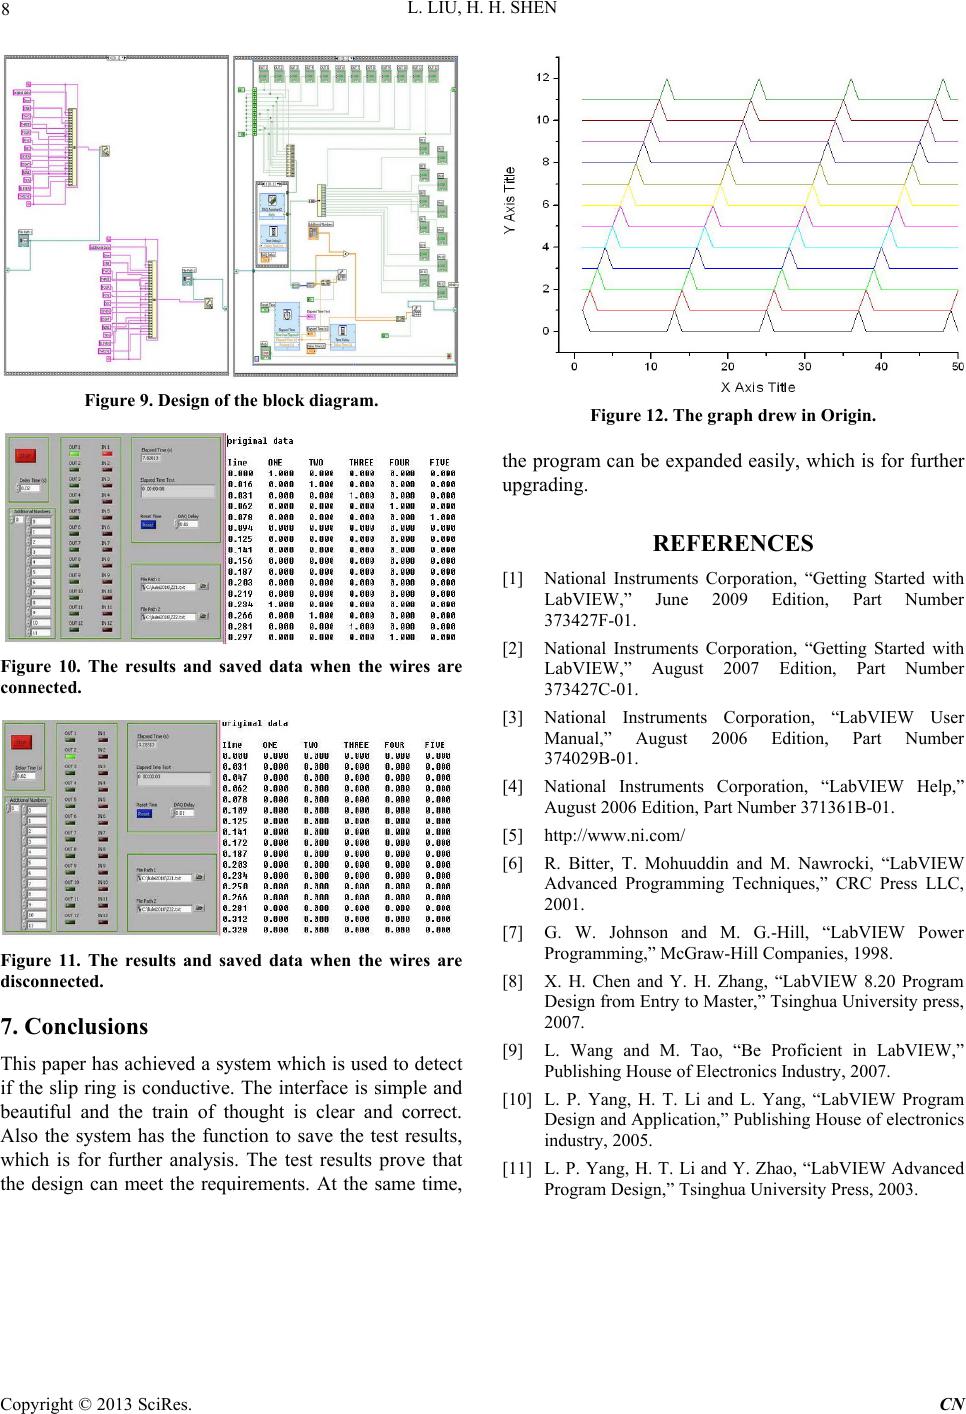 L. LIU, H. H. SHEN Copyright © 2013 SciRes. CN 8 Figure 9. Design of the block diagram. Figure 12. The graph drew in Origin. the program can be expanded easily, which is for further upgrading. REFERENCES [1] National Instruments Corporation, “Getting Started with LabVIEW,” June 2009 Edition, Part Number 373427F-01. [2] National Instruments Corporation, “Getting Started with LabVIEW,” August 2007 Edition, Part Number 373427C-01. Figure 10. The results and saved data when the wires are connected. [3] National Instruments Corporation, “LabVIEW User Manual,” August 2006 Edition, Part Number 374029B-01. [4] National Instruments Corporation, “LabVIEW Help,” August 2006 Edition, Part Number 371361B-01. [5] http://www.ni.com/ [6] R. Bitter, T. Mohuuddin and M. Nawrocki, “LabVIEW Advanced Programming Techniques,” CRC Press LLC, 2001. [7] G. W. Johnson and M. G.-Hill, “LabVIEW Power Programming,” McGraw-Hill Companies, 1998. Figure 11. The results and saved data when the wires are disconnected. [8] X. H. Chen and Y. H. Zhang, “LabVIEW 8.20 Program Design from Entry to Master,” Tsinghua University press, 2007. 7. Conclusions [9] L. Wang and M. Tao, “Be Proficient in LabVIEW,” Publishing House of Electronics Industry, 2007. This paper has achieved a system which is used to detect if the slip ring is conductive. The interface is simple and beautiful and the train of thought is clear and correct. Also the system has the function to save the test results, which is for further analysis. The test results prove that the design can meet the requirements. At the same time, [10] L. P. Yang, H. T. Li and L. Yang, “LabVIEW Program Design and Application,” Publishing House of electronics industry, 2005. [11] L. P. Yang, H. T. Li and Y. Zhao, “LabVIEW Advanced Program Design,” Tsinghua University Press, 2003. |