Paper Menu >>
Journal Menu >>
 Modern Economy, 2011, 2, 49-53 doi:10.4236/me.2011.21008 Published Online February 2011 (http://www.SciRP.org/journal/me) Copyright © 2011 SciRes. ME Demand Function for Croatian Tourist Product: A Panel Data Approach Lorena Škuflić1, Igor Štoković2 1University of Zagreb, Scho ol of Economic s and Business, Za gr eb , Croatia 2University in Pula Juraj Dobrila, Pula E-mail: lskuflic@efzg.hr, igor.stokovic@arenaturist.hr Received June 29, 2010; revised October 2, 2010; accepted October 15, 2010 Abstract Croatia as a small country with GDP of 14.255 US $ per capita and 44.6 milliard Euro of gross external debt has a strong need for a development process and construction of production bases which, in the future, will be capable to generate revenue for the return of foreign debt. As a small country, with relatively low produc- tion potential, the service sector seems the only way for achieving the necessary income to servicing foreign debt, and to start new development cycle. In Croatia, tourism sector participates with approximately 3% in the structure of GDP, while revenues from tourism has been growing constantly, from 10.6% (1996) to 22% (2008) in GDP. This sector employs about 3.5 of total employees and has a significant multiplicative effect on the overall economy, where the multiplier of tourist consumption is around 2.5. According to statistics, tourism activity tends to grow faster than the total Croatian production. The high import dependence and the weak export propulsive of goods, in last decade, had a negative impact on external trade sector, furthermore, the trade deficit reached 7.3 billion Euros, while revenues from tourism amounted 6.4 billion Euros (2009). In the Mediterranean basin the most significant Croatian competitors are France, Spain and Italy, states that are also among the five most desirable destinations in the world, while Croatia with 11 million arrivals and 56.3 million overnights (2009), was ranked around 20th place. Tourism is a sector that involves a multiplic- ity of economic activities responding to differentiated demands with specific characteristics at the national and international levels. Identifying the main determinants of tourism demand is becoming imperative for the country whose development process depends heavily on tourist revenues. Tourism brings obvious economic benefits, with the two most important being the generation of foreign exchange and revenues as well as the creation of jobs. Therefore, it is no surprise that tourism is an important economic activity in many parts of the world, including Croatia. Given the importance of the tourism, the aim of this paper is to design the model of demand for Croatian tourist product. Keywords: Tourism Demand, Croatia, Demand Determinants, Panel Data Estimation 1. Introduction Croatia as a Mediterranean country with its natural po- tential has significant comparative advantages for devel- oping tourism sector. In the Mediterranean basin the most significant Croatian competitors are France, Spain and Italy, states that are also among the five most desir- able destinations in the world, while Croatia with 11 mil- lion arrivals and 56.3 million overnights (2009), was ranked around 20th place. According to statistics, tour- ism activity tends to grow faster than the total Croatian production. In Croatia, tourism sector participates with approximately 3% in the structure of GDP, while reve- nues from tourism has been growing constantly, from 10.6% (1996) to 22% (2008) in GDP. This sector em- ploys about 3.5 of total employees and has a significant multiplicative effect on the overall economy, where the multiplier of tourist consumption is around 2.5. Croatia as a tourist destination continually achieves better results. Number of arrivals has doubled compared to ten years earlier. Furthermore, in 1999 Croatia has realized 5.1 million arrivals while in 2009 it was 10.9 millions. In the structure of overnight stays, 10.3% realized domestic and 89.7% foreign tourists. Analysis of the structure of for-  L. ŠKUFLIĆ ET AL. Copyright © 2011 SciRes. ME 50 eign tourists shows the following: most of the tourists come from Germany (22.7%), Slovenia (11.2%), Italy (10.2%), Austria (8.9%), Czech Republic (8.0%), Poland (5.4%), Netherlands (4.8%) and Slovakia (4.0%), while tourists from other countries accounted for 24.8% of total overnights. In recent years, the financial crisis on a global level or, in some states, partially impaired functioning of the fi- nancial system, has led to a significant drop in demand for large number of products and services, if not all. Mentioned situation has resulted in a drop of the real national production by sectors, and GDP as a whole. In Croatia, the annual decline in total production (2009) reached 5.8%, which is in line with global trends. Ex- ports of goods and services had the greatest influence on reducing the Croatian GDP and the rate of decline of exports of goods and services was 16.2%. Positive trends can be noticed in a number of developed countries and are primarily the result of government intervention in their economies. In general, a large number of introduced measures have led to the growth of budget deficits and external debt but also the effect of crowding private in- vestment out. At the same time, personal saving and a reduction in personal consumption were become the or- dinary, which has unpredictable consequences on the demand for tourism. Croatia as a small country with GDP of 14.255 US $ per capita and 44.6 billion Euros of gross external debt has a strong need for a development process, and in the current circumstances, when the state does not have much money to help business sector, ex- ports, particularly tourism, represents a major way out of the crisis. Identifying the main determinants of tourism demand is becoming imperative for the country whose develop- ment process depends heavily on tourist revenues. Tour- ism brings obvious economic benefits, with the two most important channels, being the generation of foreign ex- change and revenues and creation of jobs. Therefore, it is no surprise that tourism is an important economic activity in many parts of the world, including Croatia. Given the importance of the tourism, the aim of this paper is to design the model of demand for Croatian tourist product. Tourism product is very complex and multidimensional concept. Depends on the quality of accommodation, prices and kindness of staff; as much as entertainment, quality of shopping centre, etc. Through the most impor- tant tourist regions within Croatia, we assess the relevant determinants of demand using panel data method. The econometric models mainly used cross-section or time series data and rarely a panel data approach. We concen- trate our research to panel data due to the fact that long time series data for Croatia are not available for all vari- ables. The purpose of this paper is to provide an empiri- cal analysis that emphasizes the weaknesses that have been observed with regards the demand function for Croatian tourist product. The paper is divided into 2 parts, besides introduction and conclusion. Section 2 provides review determinants of demand generally defined in economic literature, and gives the theoretical and em- pirical aspects of tourism demand. Section 3 presents the results from the panel data estimation of the demand function of tourism. 2. Determinants of the Tourism Demand Demand is the quantity of a goods and services that an individual consumer is willing and able to buy at the market price during a given time period. What are the factors that influence consumers’ decision on the type and quantity of the products he will buy? Firstly, cus- tomer makes decision about buying in respect with the price. Economists agree that, although there are many other factors, most buyers decide depending on the price and the price is the most influential factor on individual demand. What are elements that consumers take into account when buying? His earnings or income is undoubtedly important, the prices of related products, its expectations of price movements in the future, his (her) tastes and preferences, advertising and other relevant factors. Using functional notation, we can write the demand function as: ,,,, ,, x xxt sc DfPIPEpTAO (1) While: Dx = quantity of goods and services I = buyer’s income. The amount of money that consumers have available for consumption Ps(c) = price of related goods and service which include substitute and complementary goods. Goods are substitute if can substitute each other in consumption without leaving any traces in consumer satisfaction. For example, consumer is indifferent if he uses water “Jana” or “Studena.” In the case of tourism, he is indifferent if he spends his holiday on Croatian or Italian coast. Products are complementary if they enter together in the consumption process. For example, con- sumer cannot use car without fuel, or cannot enjoy in tourist product without using means of transport. ExP = consumer’s expectation about future prices. If consumer expects that the price will raise, he postpones his purchase and vice versa. T = tastes and preferences. This variable is difficult to measure because it depends on the subjective attitude of individual consumers, but can have a great impact on 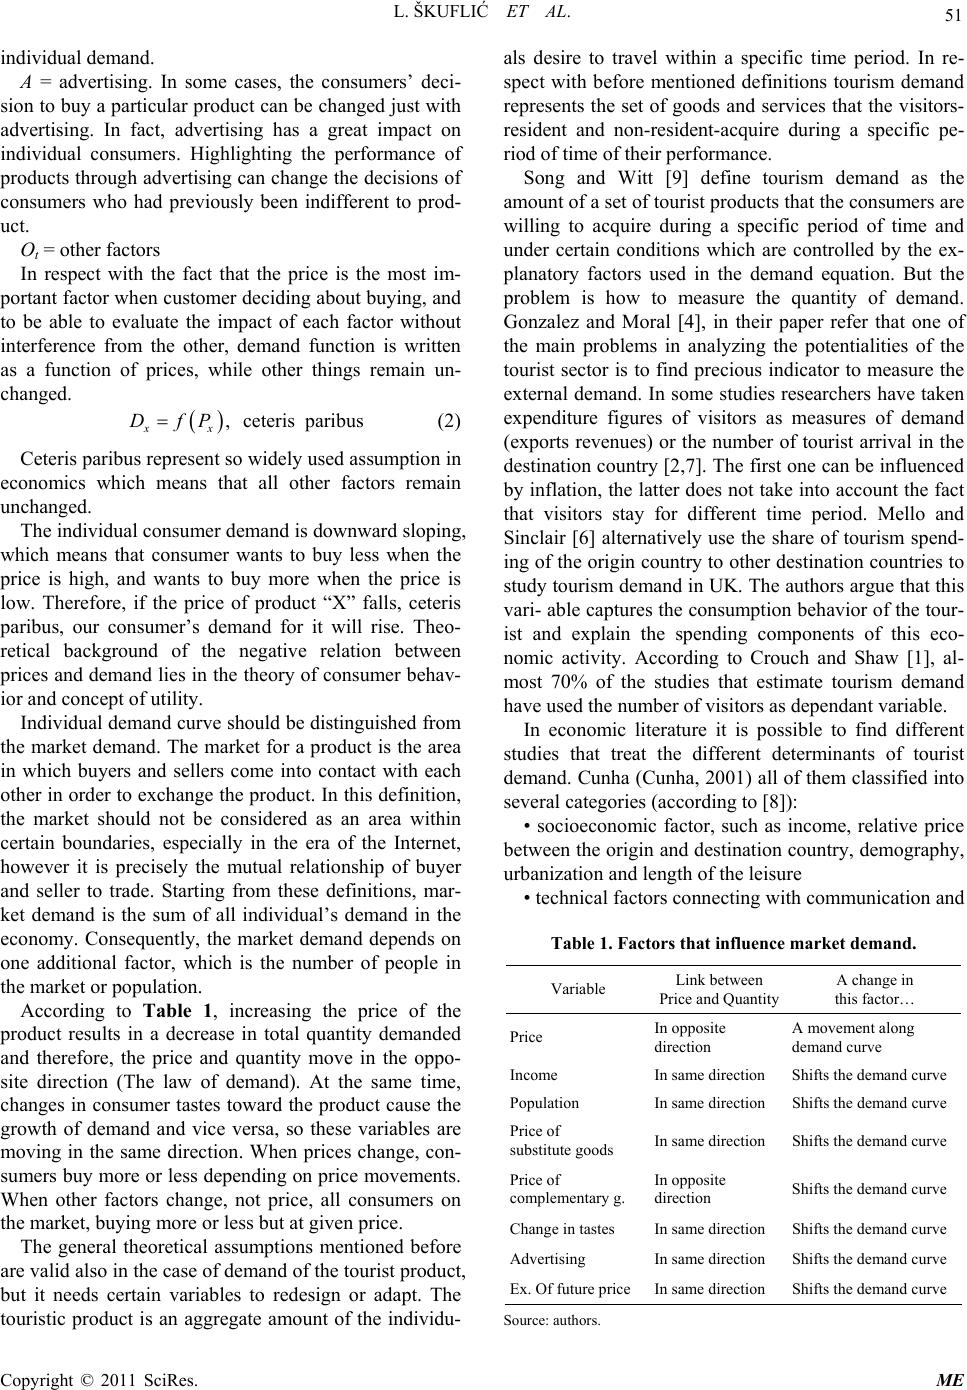 L. ŠKUFLIĆ ET AL. Copyright © 2011 SciRes. ME 51 individual demand. A = advertising. In some cases, the consumers’ deci- sion to buy a particular product can be changed just with advertising. In fact, advertising has a great impact on individual consumers. Highlighting the performance of products through advertising can change the decisions of consumers who had previously been indifferent to prod- uct. Ot = other factors In respect with the fact that the price is the most im- portant factor when customer deciding about buying, and to be able to evaluate the impact of each factor without interference from the other, demand function is written as a function of prices, while other things remain un- changed. , ceteris paribus xx DfP (2) Ceteris paribus represent so widely used assumption in economics which means that all other factors remain unchanged. The individual consumer demand is downward sloping, which means that consumer wants to buy less when the price is high, and wants to buy more when the price is low. Therefore, if the price of product “X” falls, ceteris paribus, our consumer’s demand for it will rise. Theo- retical background of the negative relation between prices and demand lies in the theory of consumer behav- ior and concept of utility. Individual demand curve should be distinguished from the market demand. The market for a product is the area in which buyers and sellers come into contact with each other in order to exchange the product. In this definition, the market should not be considered as an area within certain boundaries, especially in the era of the Internet, however it is precisely the mutual relationship of buyer and seller to trade. Starting from these definitions, mar- ket demand is the sum of all individual’s demand in the economy. Consequently, the market demand depends on one additional factor, which is the number of people in the market or population. According to Table 1, increasing the price of the product results in a decrease in total quantity demanded and therefore, the price and quantity move in the oppo- site direction (The law of demand). At the same time, changes in consumer tastes toward the product cause the growth of demand and vice versa, so these variables are moving in the same direction. When prices change, con- sumers buy more or less depending on price movements. When other factors change, not price, all consumers on the market, buying more or less but at given price. The general theoretical assumptions mentioned before are valid also in the case of demand of the tourist product, but it needs certain variables to redesign or adapt. The touristic product is an aggregate amount of the individu- als desire to travel within a specific time period. In re- spect with before mentioned definitions tourism demand represents the set of goods and services that the visitors- resident and non-resident-acquire during a specific pe- riod of time of their performance. Song and Witt [9] define tourism demand as the amount of a set of tourist products that the consumers are willing to acquire during a specific period of time and under certain conditions which are controlled by the ex- planatory factors used in the demand equation. But the problem is how to measure the quantity of demand. Gonzalez and Moral [4], in their paper refer that one of the main problems in analyzing the potentialities of the tourist sector is to find precious indicator to measure the external demand. In some studies researchers have taken expenditure figures of visitors as measures of demand (exports revenues) or the number of tourist arrival in the destination country [2,7]. The first one can be influenced by inflation, the latter does not take into account the fact that visitors stay for different time period. Mello and Sinclair [6] alternatively use the share of tourism spend- ing of the origin country to other destination countries to study tourism demand in UK. The authors argue that this vari- able captures the consumption behavior of the tour- ist and explain the spending components of this eco- nomic activity. According to Crouch and Shaw [1], al- most 70% of the studies that estimate tourism demand have used the number of visitors as dependant variable. In economic literature it is possible to find different studies that treat the different determinants of tourist demand. Cunha (Cunha, 2001) all of them classified into several categories (according to [8]): • socioeconomic factor, such as income, relative price between the origin and destination country, demography, urbanization and length of the leisure • technical factors connecting with communication and Table 1. Factors that influence market demand. Variable Link between Price and Quantity A change in this factor… Price In opposite direction A movement along demand curve Income In same direction Shifts the demand curve Population In same direction Shifts the demand curve Price of substitute goods In same direction Shifts the demand curve Price of complementary g. In opposite direction Shifts the demand curve Change in tastes In same direction Shifts the demand curve Advertising In same direction Shifts the demand curve Ex. Of future price In same direction Shifts the demand curve Source: authors. 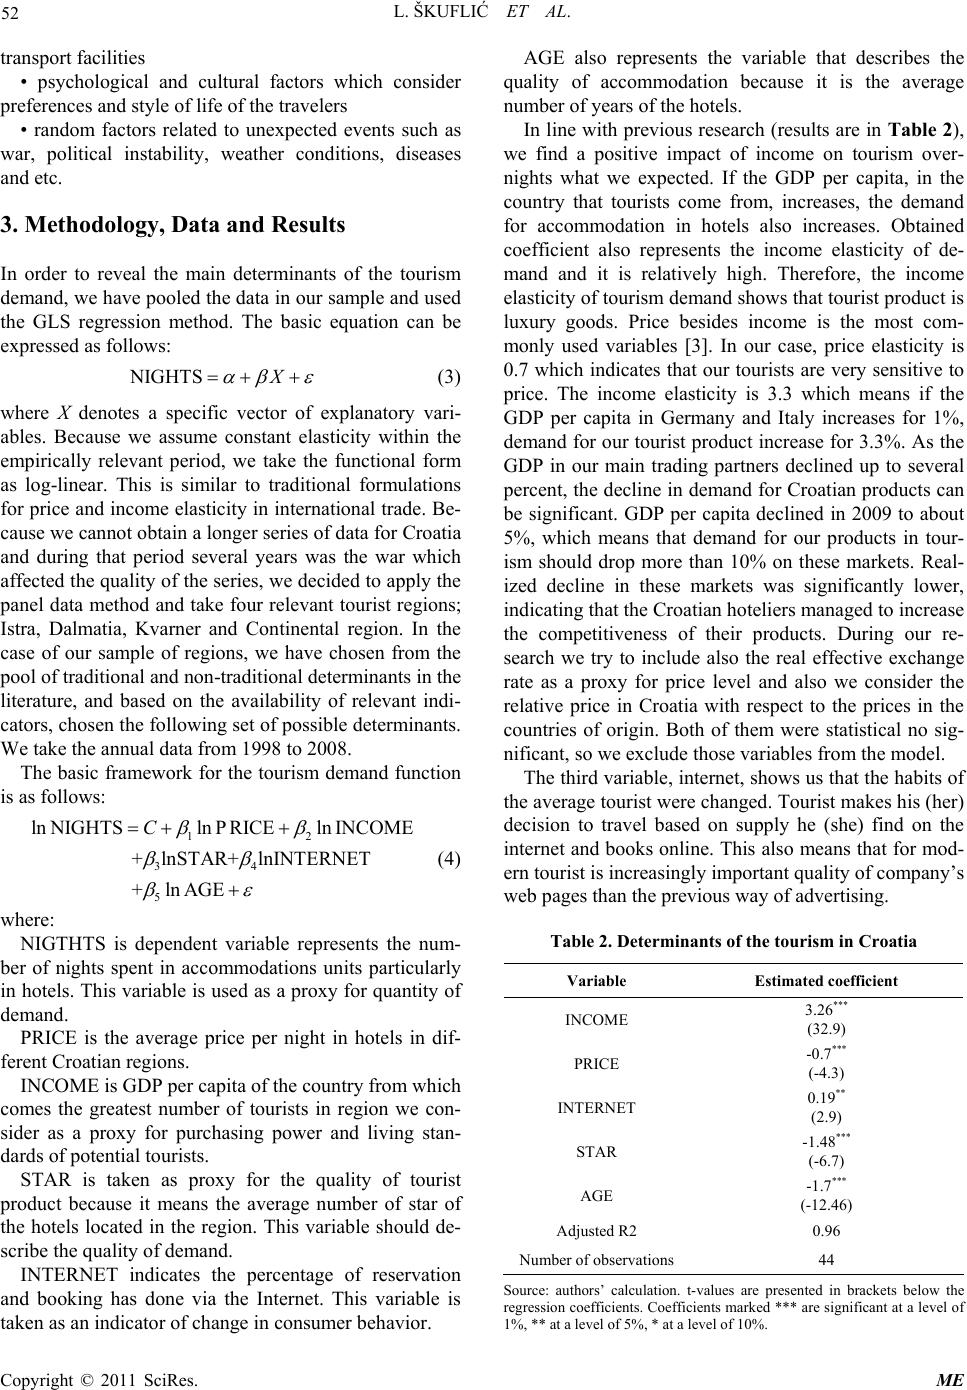 L. ŠKUFLIĆ ET AL. Copyright © 2011 SciRes. ME 52 transport facilities • psychological and cultural factors which consider preferences and style of life of the travelers • random factors related to unexpected events such as war, political instability, weather conditions, diseases and etc. 3. Methodology, Data and Results In order to reveal the main determinants of the tourism demand, we have pooled the data in our sample and used the GLS regression method. The basic equation can be expressed as follows: NIGHTS X (3) where X denotes a specific vector of explanatory vari- ables. Because we assume constant elasticity within the empirically relevant period, we take the functional form as log-linear. This is similar to traditional formulations for price and income elasticity in international trade. Be- cause we cannot obtain a longer series of data for Croatia and during that period several years was the war which affected the quality of the series, we decided to apply the panel data method and take four relevant tourist regions; Istra, Dalmatia, Kvarner and Continental region. In the case of our sample of regions, we have chosen from the pool of traditional and non-traditional determinants in the literature, and based on the availability of relevant indi- cators, chosen the following set of possible determinants. We take the annual data from 1998 to 2008. The basic framework for the tourism demand function is as follows: 12 34 5 ln NIGHTSln PRICEln INCOME +lnSTAR+lnINTERNET +lnAGE C (4) where: NIGTHTS is dependent variable represents the num- ber of nights spent in accommodations units particularly in hotels. This variable is used as a proxy for quantity of demand. PRICE is the average price per night in hotels in dif- ferent Croatian regions. INCOME is GDP per capita of the country from which comes the greatest number of tourists in region we con- sider as a proxy for purchasing power and living stan- dards of potential tourists. STAR is taken as proxy for the quality of tourist product because it means the average number of star of the hotels located in the region. This variable should de- scribe the quality of demand. INTERNET indicates the percentage of reservation and booking has done via the Internet. This variable is taken as an indicator of change in consumer behavior. AGE also represents the variable that describes the quality of accommodation because it is the average number of years of the hotels. In line with previous research (results are in Table 2), we find a positive impact of income on tourism over- nights what we expected. If the GDP per capita, in the country that tourists come from, increases, the demand for accommodation in hotels also increases. Obtained coefficient also represents the income elasticity of de- mand and it is relatively high. Therefore, the income elasticity of tourism demand shows that tourist product is luxury goods. Price besides income is the most com- monly used variables [3]. In our case, price elasticity is 0.7 which indicates that our tourists are very sensitive to price. The income elasticity is 3.3 which means if the GDP per capita in Germany and Italy increases for 1%, demand for our tourist product increase for 3.3%. As the GDP in our main trading partners declined up to several percent, the decline in demand for Croatian products can be significant. GDP per capita declined in 2009 to about 5%, which means that demand for our products in tour- ism should drop more than 10% on these markets. Real- ized decline in these markets was significantly lower, indicating that the Croatian hoteliers managed to increase the competitiveness of their products. During our re- search we try to include also the real effective exchange rate as a proxy for price level and also we consider the relative price in Croatia with respect to the prices in the countries of origin. Both of them were statistical no sig- nificant, so we exclude those variables from the model. The third variable, internet, shows us that the habits of the average tourist were changed. Tourist makes his (her) decision to travel based on supply he (she) find on the internet and books online. This also means that for mod- ern tourist is increasingly important quality of company’s web pages than the previous way of advertising. Table 2. Determinants of the tourism in Croatia Variable Estimated coefficient INCOME 3.26*** (32.9) PRICE -0.7*** (-4.3) INTERNET 0.19** (2.9) STAR -1.48*** (-6.7) AGE -1.7*** (-12.46) Adjusted R2 0.96 Number of observations44 Source: authors’ calculation. t-values are presented in brackets below the regression coefficients. Coefficients marked *** are significant at a level of 1%, ** at a level of 5%, * at a level of 10%.  L. ŠKUFLIĆ ET AL. Copyright © 2011 SciRes. ME 53 According to obtained results our tourist is not bur- dened by the number of stars, but rather the opposite, raising the number of stars, which immediately means higher quality, is in the opposite relation to demand. It can be interpreted in two ways. Firstly, the quality of our hotels is very high in relation to our competition in terms of number of stars, the second, tourists coming to Croatia are average not highly requesting. These findings are proved by the fact that, in the last two years, Croatian five star hotels have the biggest problem to realize their budget. With regard to the obtained results in our research, price elasticity coefficient of 0.7 and the number of stars (-1.5) we can make the conclusion that tourism compa- nies by raising the number of stars of their hotels are not able to achieve higher prices in markets where they sell their products. These coefficients should be interpreted very carefully. In fact, although the average Croatian tourist does not require five-star hotel, it nevertheless takes into account the date of the last reconstruction. Croatian hoteliers do not necessarily offer a five-star hotel, but they must continuously invest in the quality of existing hotels. 4. Conclusions We can conclude that tourism is an important sector for the Croatian economy and the main source of foreign revenues, needed to service foreign debt and running a development cycle. Tourism sector participates with ap- proximately 3% in the structure of GDP, while revenues from tourism account around 20% in GDP. This sector employs about 3.5 of total employees and has a signifi- cant multiplicative effect on the overall economy, where the multiplier of tourist consumption is around 2.5. The high import dependence and the weak export propulsive of goods, in last decade, had a negative impact on exter- nal trade sector, furthermore, the trade deficit reached 7.3 billion Euros, while revenues from tourism amounted 6.4 billion Euros (2009). Tourism is a sector that involves a multiplicity of economic activities responding to differ- entiated demands with specific characteristics at the na- tional and international levels. Given the importance of the industry, the aim of the paper was to quantitatively assess the determinants of the demand for tourism in Croatia. According to obtained results we can conclude that the income in our major trading partners countries are positively related to the demand for tourism, with a long-run elasticity of around 3.3. The results also suggest that an increase in price of accommodation decreases demand for tourist product. Price elasticity coefficient shows that our customers are high price sensitive because coefficient is 0.7. Tourist companies must consider the quality of their own web- sites and provide the opportunity for online booking. With regard to the model the modern consumer is in- creasingly affected by internet, and less importance is the classic way of advertising. However, it should be noted that there are certain limitations of this research. The model does not take into account transportation costs, such as aircrafts ticket or price of fuel due to the fact that many tourists in Croatia come by car. The model also does not take into account the price of substitutes such as the price of accommoda- tion in Italy or Spain. Attempts to include the price of competition through the general price level did not give satisfactory results. We did not include the relative effec- tive exchange rate. These omitted variables could have had a significant influence on the model. In the following studies the mentioned variables should be included. 5. References [1] G. Crouch, , R. Shaw, “International Tourism Demand: a Meta analytical Integration of Research Findings,” In: P. Johnson and B. Thomas, Eds., Choose and Demand in Tourism, Mansell, London, 1992, pp. 175-207. [2] R. Katafono and A. Gounder, “Modeling Tourism De- mand in Fiji,” Working Paper, 2004/01, Economic De- partment Reserve Bank of Fiji, Suva, 2004. [3] C. Lim, “An Econometric Classification and Review of International Tourism Demand Models,” Tourism Econo- metrics, Vol. 3, No. 1, 1997, pp. 69-81. [4] P. Gonzalez and P. Moral, “An Analysis of the Interna- tional Tourism Demand in Spain,” International Journal of Forecasting, Vol. 11, No. 4, 1995, pp. 233-251. doi:10.1016/0169-2070(94)00570-3 [5] Horwat Consulting Zagreb, Poslovanje hotelijerstva u Hrvatskoj, Ministarstvo mora, turizma, prometa i razvitka RH and Horwath Consulting Zagreb, Zagreb, different years. [6] M. Mello and T. Sinclair, “Alternative Specifications of Tourism Demand Models,” paper presented at 5 Confer- ence Da Sociedade Portuguesa de Investigacao em Economia, 19-20 Juny, 2000. [7] F. J. R. Ledesma, M. I. Navarro and J. V. P. Rodríguez, “Panel Data and Tourism: a Case Study of Tenerife,” Tourism Economics, Vol. 7, No.1, 2001, pp. 75-88. doi:10.5367/000000001101297748 [8] S. A. Proença and E. Soukiazis, “Demand for Tourism in Portugal: A Panel Data Approach,” Working paper 29, CEUNEUROP, 2005. [9] H. Song and S. Witt, “Tourism Modeling and Forecasting – Modern Econometric Approaches,” Pergamon, 2000. |