 Applied Mathematics, 2013, 4, 1583-1589 Published Online November 2013 (http://www.scirp.org/journal/am) http://dx.doi.org/10.4236/am.2013.411213 Open Access AM Mergers and Acquisitions: An Efficiency Evaluation Paulo Rotela Junior1, Edson de Oliveira Pamplona1, Aneirson Francisco da Silva2 1Institute of Production Engineering and Management, Federal University of Itajuba, Itajuba, Brazil 2Departament of Production, São Paulo State University, Guaratingueta, Brazil Email: paulo.rotela@gmail.com, pamplona@unifei.edu.br, aneirson@yahoo.com.br Received June 7, 2013; revised July 7, 2013; accepted July 15, 2013 Copyright © 2013 Paulo Rotela Junior et al. This is an open access article distributed under the Creative Commons Attribution Li- cense, which permits unrestricted use, distribution, and reproduction in any medium, provided the original work is properly cited. ABSTRACT This article sheds light on how synergies arise through mergers and acquisitions (M&A). Enterprises go through the process of Mergers and Acquisitions (M&A) with the goal of improving performance, increasing efficiency and obtain- ing business synergy. Prior literature suggests that synergies could arise due to taxes, market power or efficiency im- provements. This study evaluates the efficiency of M&A in Brazil among publicly-traded companies. We used models with multiple objectives from Goal Programming and Data Envelopment Analysis (GPDEA), employing accounting indicators as input and output variables, and thus evaluated the emergence of synergy gains. These models allow us to analyze and classify the M&A according to the efficiency obtained in such processes. Some of the M&A cases analyzed were mistakenly considered efficient when used traditional models. And, as expected, the GPDEA was proved to be superior to classical models; however it was noticed that few of the cases investigated were proved to be effective. We presented a new application for multi-objective approach that can be used to assess mergers and acquisitions. The dual- application of GPDEA provided a greater understanding of efficiency generation in synergy creation by means of M&A. Keywords: Merger and Acquisition; Multiple-Objective Optimization; Goal Programming; Data Envelopment Analysis; Synergy 1. Introduction Mergers and Acquisitions (M&A) has redefined the cor- porate managerial environment, evidenced by the ever- enhanced competitive edge of professional enterprises on today’s market. Theories behind M&A have supported the concept that the value of the combined companies may rise after com- ing together. A large part of this justification is associ- ated to the gains contributed to so-called “synergy” [1-4]. According to Kumar and Bansal [5], the task of evalu- ating M&A transactions has been one of the greatest dif- ficulties for economic researchers, given that different approaches are taken to identify the effects of M&As. Moreover, their results are often presented differently. In a literature review, a large number of M&A studies were found which focused on countries such as the USA, Canada, and the United Kingdom. However, few studies were found which take a closer look at the Brazilian context. This study aims to address this lack of M&A studies focusing on Brazil in scientific literature. Operational Research (OR), specifically Goal Program- ming (GP) and Data Envelopment Analysis (DEA), may help in evaluating these results. This paper is motivated by the lack of evidence about the synergistic gains via M&As. Thus, this article’s objective is to utilize GP and DEA models (GPDEA) to evaluate the efficiency of cases of M&As which have taken place between Brazilian pub- licly-traded companies. Specific objective: Compare GPDEA models (BBC and CCR) from Bal et al. [6], with classic DEA-BCC and CCR models, proposed by Banker et al. [7] and Charnes et al. [8]. This article analyzes and classifies M&As according to their obtained levels of efficiency. Upon starting this investigation, it was expected that both pros and cons would be found for M&As. Another expectation of this study is the confirmations of Bal et al. [6] and Silva et al. [9], who stated that GPDEA models are an important tool to be utilized in efficiency evaluation problems when the quantity of DMUs is not equal to three times the sum of the number of input & output variables [10]. 2. Mergers & Acquisitions Kummer and Steger [11] state that the main motivation 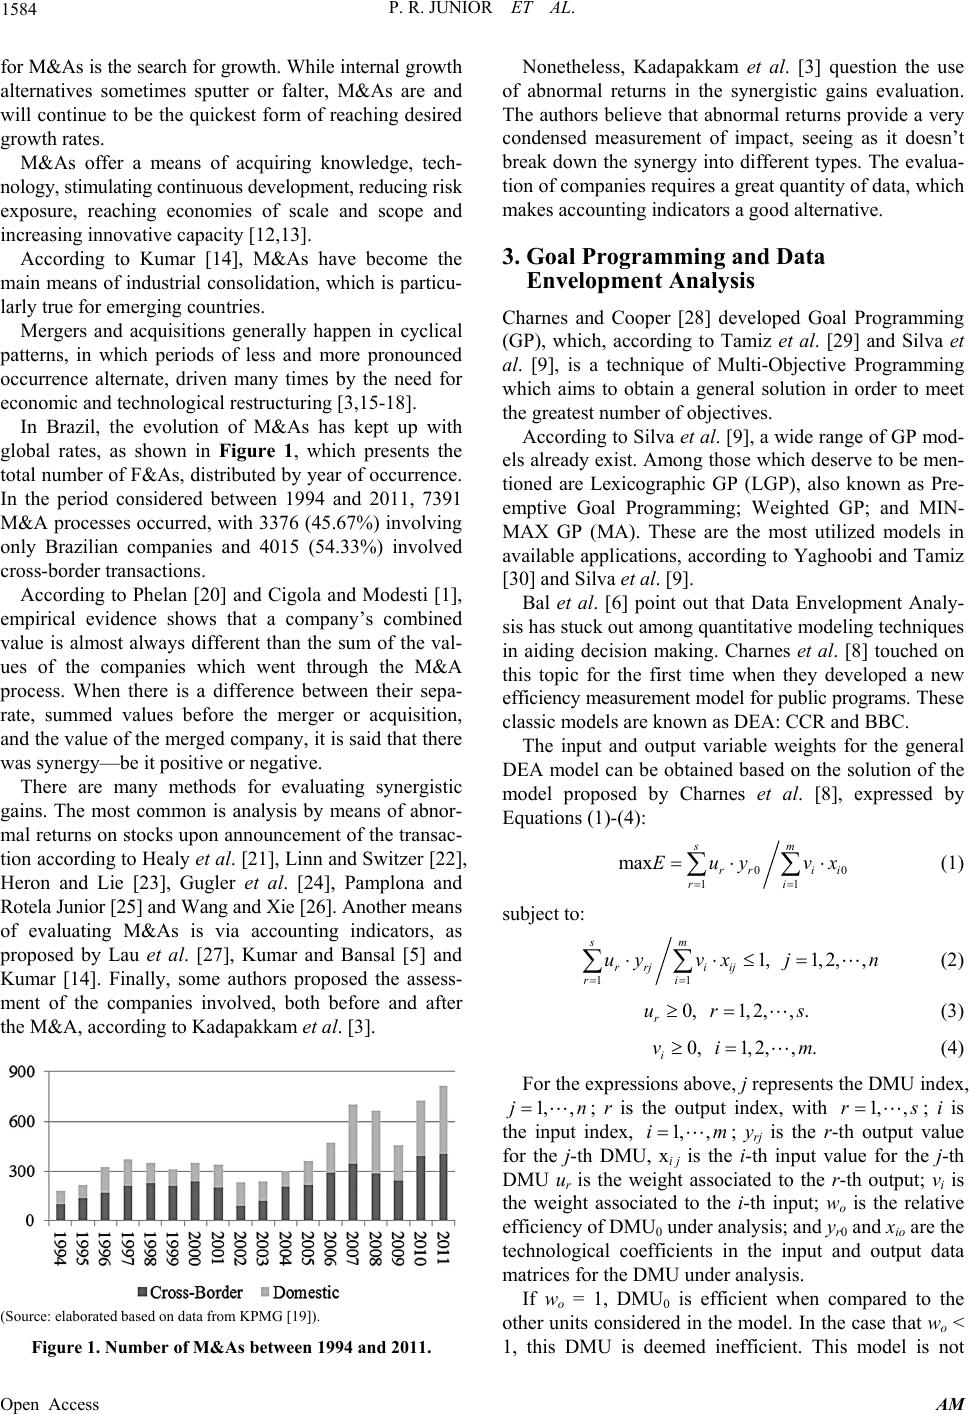 P. R. JUNIOR ET AL. 1584 for M&As is the search for growth. While internal growth alternatives sometimes sputter or falter, M&As are and will continue to be the quickest form of reaching desired growth rates. M&As offer a means of acquiring knowledge, tech- nology, stimulating continuous development, reducing risk exposure, reaching economies of scale and scope and increasing innovative capacity [12,13]. According to Kumar [14], M&As have become the main means of industrial consolidation, which is particu- larly true for emerging countries. Mergers and acquisitions generally happen in cyclical patterns, in which periods of less and more pronounced occurrence alternate, driven many times by the need for economic and technological restructuring [3,15-18]. In Brazil, the evolution of M&As has kept up with global rates, as shown in Figure 1, which presents the total number of F&As, distributed by year of occurrence. In the period considered between 1994 and 2011, 7391 M&A processes occurred, with 3376 (45.67%) involving only Brazilian companies and 4015 (54.33%) involved cross-border transactions. According to Phelan [20] and Cigola and Modesti [1], empirical evidence shows that a company’s combined value is almost always different than the sum of the val- ues of the companies which went through the M&A process. When there is a difference between their sepa- rate, summed values before the merger or acquisition, and the value of the merged company, it is said that there was synergy—be it positive or negative. There are many methods for evaluating synergistic gains. The most common is analysis by means of abnor- mal returns on stocks upon announcement of the transac- tion according to Healy et al. [21], Linn and Switzer [22], Heron and Lie [23], Gugler et al. [24], Pamplona and Rotela Junior [25] and Wang and Xie [26]. Another means of evaluating M&As is via accounting indicators, as proposed by Lau et al. [27], Kumar and Bansal [5] and Kumar [14]. Finally, some authors proposed the assess- ment of the companies involved, both before and after the M&A, according to Kadapakkam et al. [3]. (Source: elaborated based on data from KPMG [19]). Figure 1. Number of M&As between 1994 and 2011. Nonetheless, Kadapakkam et al. [3] question the use of abnormal returns in the synergistic gains evaluation. The authors believe that abnormal returns provide a very condensed measurement of impact, seeing as it doesn’t break down the synergy into different types. The evalua- tion of companies requires a great quantity of data, which makes accounting indicators a good alternative. 3. Goal Programming and Data Envelopment Analysis Charnes and Cooper [28] developed Goal Programming (GP), which, according to Tamiz et al. [29] and Silva et al. [9], is a technique of Multi-Objective Programming which aims to obtain a general solution in order to meet the greatest number of objectives. According to Silva et al. [9], a wide range of GP mod- els already exist. Among those which deserve to be men- tioned are Lexicographic GP (LGP), also known as Pre- emptive Goal Programming; Weighted GP; and MIN- MAX GP (MA). These are the most utilized models in available applications, according to Yaghoobi and Tamiz [30] and Silva et al. [9]. Bal et al. [6] point out that Data Envelopment Analy- sis has stuck out among quantitative modeling techniques in aiding decision making. Charnes et al. [8] touched on this topic for the first time when they developed a new efficiency measurement model for public programs. These classic models are known as DEA: CCR and BBC. The input and output variable weights for the general DEA model can be obtained based on the solution of the model proposed by Charnes et al. [8], expressed by Equations (1)-(4): 0 11 max sm rr ii ri Euy vx 0 (1) subject to: 11 1,1, 2,, sm rrjiij ri uy vxjn (2) 0, 1,2,,. r urs m n (3) 0, 1,2,,. i vi (4) For the expressions above, j represents the DMU index, 1, ,j ; r is the output index, with ; i is the input index, 1, ,rs 1, ,im ; yrj is the r-th output value for the j-th DMU, xi j is the i-th input value for the j-th DMU ur is the weight associated to the r-th output; vi is the weight associated to the i-th input; wo is the relative efficiency of DMU0 under analysis; and yr0 and xio are the technological coefficients in the input and output data matrices for the DMU under analysis. If wo = 1, DMU0 is efficient when compared to the other units considered in the model. In the case that wo < 1, this DMU is deemed inefficient. This model is not Open Access AM  P. R. JUNIOR ET AL. 1585 linear, as this is a case of Fractionary Programming; how- ever, it may be linearized, as seen in (5)-(9), by means of the model known as CCR, proposed by Charnes et al. [8], or with Constant Returns of Scale. 0 1 max s rr r Euy (5) subject to: 1 1 m iio i vx (6) 0 11 0 1,2,, sm rr iio ri uy vxjn (7) 0, 1,2,,. r urs m 0 c s m r y (8) 0, 1,2,,. i vi (9) Banker et al. [7] relaxed the assertion of constant re- turns of scale in CCR models by means of a restriction of convexity, in which the boundary is made up of convex combinations of efficient units. In doing so, variable re- turn of scale can be seen, known as the BCC model, which bears the authors’ initials. This is shown in the expressions Equations (10)-(14): 0 1 max s rr r Euy (10) subject to: 1 1 m iio i vx (11) 00 11 0 1,2,, sm rr iio ri uyvx cjn (12) 0, 1,2,,. r ur (13) 0, 1,2,,. i vi (14) It is recommended that the number of DMUs be three times the sum of the total number of variables. Otherwise, according to Cooper et al. [10], traditional DEA methods do not enable suitable data discrimination. Bal et al. [6] proposed a new DEA model integrated with GP, known as a GPDEA model. For their research, the objective was to analyze efficiency when there are more input and output variables than the number of units for analysis (DMUs). The GPDEA is derived from multi-objective DEA models, described by Equations (15)-(21) and proposed by Li and Reeves [31]: 0 1 1 minou max min min s or r n j j du W d (15) subject to: 1 1 m iio i vx (16) 0 11 0, 1,2,, sm rriioj ri uyvx djn (17) 0, 1,2,, j dj n (18) 0, 1,2,,. r urs m n (19) 0, 1,2,,. i vi (20) 0, 1,2,,. j dj (21) In the expressions above, d0 is the deviation variable for the DMUo; dj is the deviation variable for the DMUj; M is the maximum value of the deviation variable (max {dj}) and M dj ≥ 0 defines the maximum deviation M which will not alter the viable region of the decision variables. Bal et al. [6] associated goals to multiple objective functions from the model by Li and Reeves [31], and thus, obtained the GPDEA-CCR and GPDEA-BCC mod- els, seen in the expressions (22)-(30) and (31)-(39) be- low: GPDEA-CCR: 11 23 min j jj ddd dd (22) subject to: 11 1 1 m iio i vx d d (23) 02 2 1 1 s rr r uyd d (24) 0 11 0 1,2,, sm rriioj ri uyvx djn (25) 33 0, 1,2,, jjj dd djn (26) 0, 1,2,,. r urs m n (27) 0, 1,2,,. i vi (28) 0, 1,2,,. j dj (29) 33 0, ,0. ijj ddd (30) GPDEA-BCC: 11 23 min j jj ddd dd (31) subject to: 11 1 1 m iio i vx d d (32) Open Access AM  P. R. JUNIOR ET AL. 1586 00 22 1 1 s rr r uycdd (33) 00 11 0 1,2,, sm rr iioj ri uyvxc djn (34) 33 0, 1,2,, jjj dd djn (35) 0, 1,2,,. r urs m n (36) 0, 1,2,,. i vi (37) 0, 1,2,,. j dj (38) 33 0, ,0. ijj ddd (39) 4. Problem Description and Modeling According to Bertrand and Fransoo [32], this research can be classified as applied research, with a descriptive, empirical objective, seeing as the model describes causal relationships which may exist in reality, and thus enables a greater understanding of real processes. The problem is dealt with quantitatively by means of modeling. With the aim of applying the GPDEA-BCC and GPDEA-CCR models in order to evaluate the efficiency of fusions and acquisitions, the steps proposed by Silva et al. [9] were utilized: Step (a)—Problem Identification—The problem may be summed up as an efficiency evaluation, by means of economic indicators, of 29 M&As which occurred during the span of 2000 to 2007 between Brazilian publicly- traded companies. Step (b)—Data Collection—Eleven accounting indi- cators, divided into four parameters: 1) Liquidity: General Liquidity (GL) and Current Li- quidity (CL); 2) Debt: Debt Profile (DP), level of financial debt (LFD) and participation of Third-Party Capital (TPC); 3) Profitability: Return On Assets (ROA), Return On Equity (ROE) and Earnings Per Share (EPS); 4) Synergy: Gross Margin (GM), Net Margin (NM) and General and Administrative Expenses in Relation to Revenue (GAR). Historical data were obtained using the database soft- ware Economática®. M&A process efficiency will be analyzed by means of three sets of data: two for companies operating inde- pendently, corresponding to the years which preceded the M&A announcement, and a set of data for the resulting “merged” company upon the enterprises’ combination. The resulting average values obtained by the companies under investigation in a period of three years prior to and three years after the business deal announcement are considered. The year of the announcement was disregarded, given that the effects of the deal make it difficult to compare to other years [14,21]. Thus, this article aims to analyze the efficiency of these processes by deeming them either positive or negative for the companies involved, in which inputs (I) are all of the indicators which have minimiza- tion objectives, and outputs (O) are the indicators which have maximization objectives. The data were calculated as a relation between the values before and after the M&A, as shown in Table 1. Thus, as the input data (I) were utilized in relation to the indicators DP, LFD, TPC and GAR, the best scenar- ios for each one is to be minimized. Contrarily, for the output data (O), data were utilized in relation to the indi- cators GL, CL, ROA, ROE, GM, NM and EPS, the best scenarios for each one is to be maximized. Step (c)—Modeling—The software modules General Algebraic Modeling (GAMS), version 23.6.5 and solver CPLEX, version 12.2.1, were utilized. Step (d)—Model Solution—Analysis was performed on all of the variables using classic DEA models (BCC and CCR), as well as by Multi-Objective DEA methods (GPDEA-BCC and GPDEA-CCR). Results are presented in Table 2. The super efficiency for the classic models is also presented, in which the efficiency values for the DEA (BCC and CCR) models extrapolate the value of 1, thus enabling them to be classified in accordance with the efficiency evaluation. In Table 2 it can be observed that 12 efficient DMUs were identified using the BCC method, which represents roughly 41% of the sample. It can be asserted that the BCC model does not discriminate well between the DMUs. Regarding super efficiency (S. Ef.), it can be seen that DMU16 presents the greatest efficiency, fol- lowed by DMU 19. When analyzing the models obtained with the CCR model, 10 DMUs were identified as efficient, which repre- sents around roughly 34% of the sample. Due to the fact that companies utilized different types of technology and performed in different economic segments (thus charac- terizing a scenario of variable return of scale), the results from the classic CCR model are chosen. Similar to the BCC model, the S. Ef. Identifies DMU16 as the most efficient, followed by DMU19. Table 2 also encompasses the analyses done for the multi-objective DEA, GPDEA models. In the results ob- tained with the GPDEA-BCC and GPDEA-CCR, it can be observed that only four M&A cases were considered efficient DMUs. This corresponds to roughly 14% of the total evaluated, represented by the DMUs 16, 19, 2 and 20. Through this study, the assertion from Cooper et al. [10] that when one does not satisfy the rules for the number of DMUs to be three times greater in relation to the sum of the number of variables, application of GPDEA Open Access AM 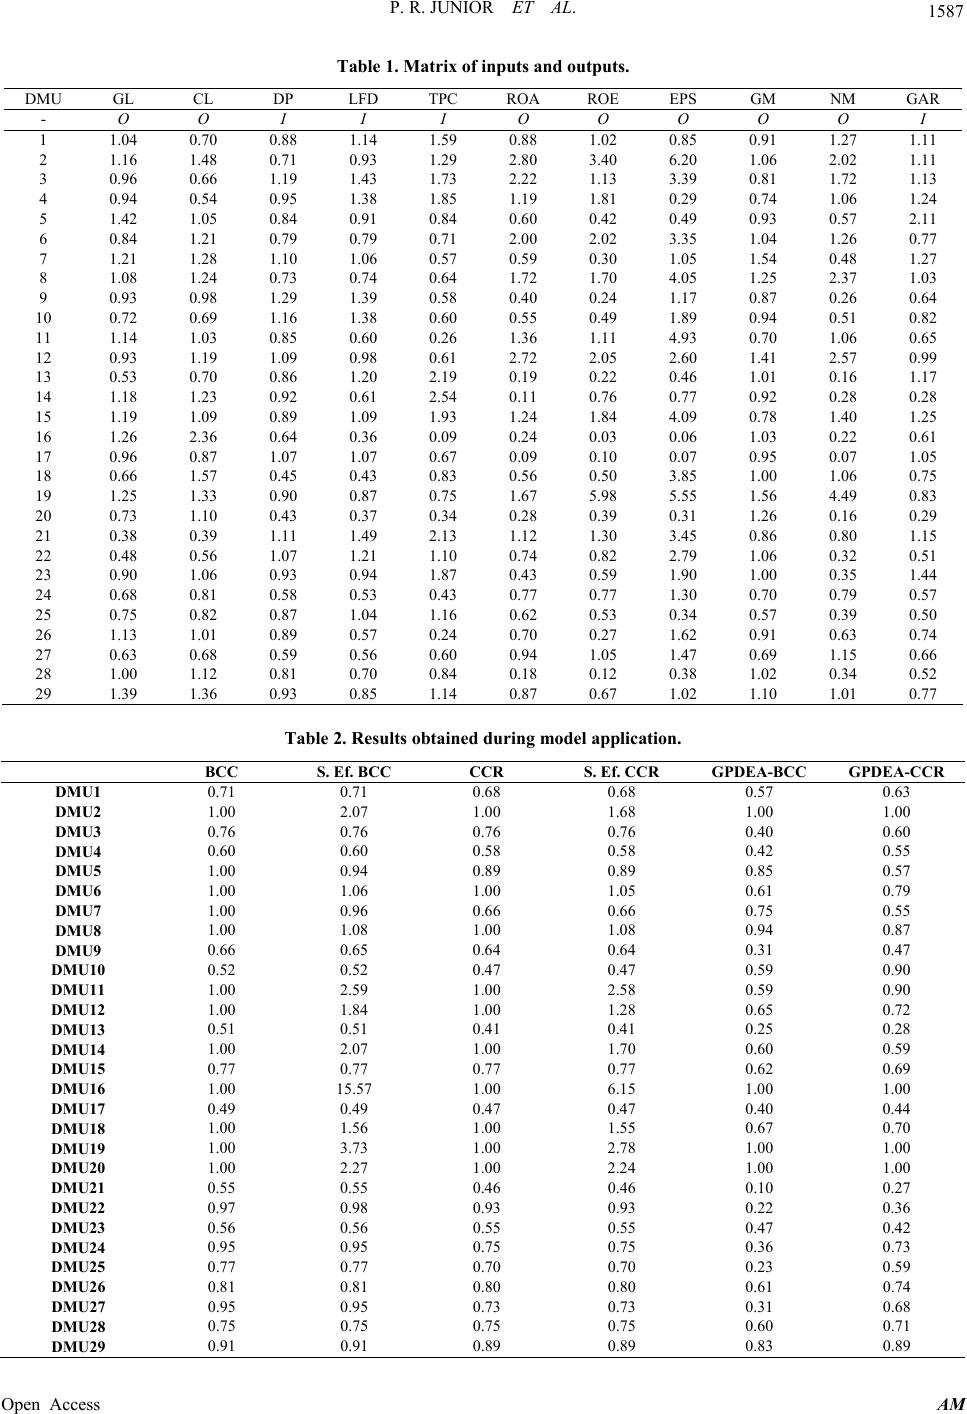 P. R. JUNIOR ET AL. Open Access AM 1587 Table 1. Matrix of inputs and outputs. DMU GL CL DP LFD TPC ROA ROE EPS GM NM GAR - O O I I I O O O O O I 1 1.04 0.70 0.88 1.14 1.59 0.88 1.02 0.85 0.91 1.27 1.11 2 1.16 1.48 0.71 0.93 1.29 2.80 3.40 6.20 1.06 2.02 1.11 3 0.96 0.66 1.19 1.43 1.73 2.22 1.13 3.39 0.81 1.72 1.13 4 0.94 0.54 0.95 1.38 1.85 1.19 1.81 0.29 0.74 1.06 1.24 5 1.42 1.05 0.84 0.91 0.84 0.60 0.42 0.49 0.93 0.57 2.11 6 0.84 1.21 0.79 0.79 0.71 2.00 2.02 3.35 1.04 1.26 0.77 7 1.21 1.28 1.10 1.06 0.57 0.59 0.30 1.05 1.54 0.48 1.27 8 1.08 1.24 0.73 0.74 0.64 1.72 1.70 4.05 1.25 2.37 1.03 9 0.93 0.98 1.29 1.39 0.58 0.40 0.24 1.17 0.87 0.26 0.64 10 0.72 0.69 1.16 1.38 0.60 0.55 0.49 1.89 0.94 0.51 0.82 11 1.14 1.03 0.85 0.60 0.26 1.36 1.11 4.93 0.70 1.06 0.65 12 0.93 1.19 1.09 0.98 0.61 2.72 2.05 2.60 1.41 2.57 0.99 13 0.53 0.70 0.86 1.20 2.19 0.19 0.22 0.46 1.01 0.16 1.17 14 1.18 1.23 0.92 0.61 2.54 0.11 0.76 0.77 0.92 0.28 0.28 15 1.19 1.09 0.89 1.09 1.93 1.24 1.84 4.09 0.78 1.40 1.25 16 1.26 2.36 0.64 0.36 0.09 0.24 0.03 0.06 1.03 0.22 0.61 17 0.96 0.87 1.07 1.07 0.67 0.09 0.10 0.07 0.95 0.07 1.05 18 0.66 1.57 0.45 0.43 0.83 0.56 0.50 3.85 1.00 1.06 0.75 19 1.25 1.33 0.90 0.87 0.75 1.67 5.98 5.55 1.56 4.49 0.83 20 0.73 1.10 0.43 0.37 0.34 0.28 0.39 0.31 1.26 0.16 0.29 21 0.38 0.39 1.11 1.49 2.13 1.12 1.30 3.45 0.86 0.80 1.15 22 0.48 0.56 1.07 1.21 1.10 0.74 0.82 2.79 1.06 0.32 0.51 23 0.90 1.06 0.93 0.94 1.87 0.43 0.59 1.90 1.00 0.35 1.44 24 0.68 0.81 0.58 0.53 0.43 0.77 0.77 1.30 0.70 0.79 0.57 25 0.75 0.82 0.87 1.04 1.16 0.62 0.53 0.34 0.57 0.39 0.50 26 1.13 1.01 0.89 0.57 0.24 0.70 0.27 1.62 0.91 0.63 0.74 27 0.63 0.68 0.59 0.56 0.60 0.94 1.05 1.47 0.69 1.15 0.66 28 1.00 1.12 0.81 0.70 0.84 0.18 0.12 0.38 1.02 0.34 0.52 29 1.39 1.36 0.93 0.85 1.14 0.87 0.67 1.02 1.10 1.01 0.77 Table 2. Results obtained during model application. BCC S. Ef. BCC CCR S. Ef. CCR GPDEA-BCC GPDEA-CCR DMU1 0.71 0.71 0.68 0.68 0.57 0.63 DMU2 1.00 2.07 1.00 1.68 1.00 1.00 DMU3 0.76 0.76 0.76 0.76 0.40 0.60 DMU4 0.60 0.60 0.58 0.58 0.42 0.55 DMU5 1.00 0.94 0.89 0.89 0.85 0.57 DMU6 1.00 1.06 1.00 1.05 0.61 0.79 DMU7 1.00 0.96 0.66 0.66 0.75 0.55 DMU8 1.00 1.08 1.00 1.08 0.94 0.87 DMU9 0.66 0.65 0.64 0.64 0.31 0.47 DMU10 0.52 0.52 0.47 0.47 0.59 0.90 DMU11 1.00 2.59 1.00 2.58 0.59 0.90 DMU12 1.00 1.84 1.00 1.28 0.65 0.72 DMU13 0.51 0.51 0.41 0.41 0.25 0.28 DMU14 1.00 2.07 1.00 1.70 0.60 0.59 DMU15 0.77 0.77 0.77 0.77 0.62 0.69 DMU16 1.00 15.57 1.00 6.15 1.00 1.00 DMU17 0.49 0.49 0.47 0.47 0.40 0.44 DMU18 1.00 1.56 1.00 1.55 0.67 0.70 DMU19 1.00 3.73 1.00 2.78 1.00 1.00 DMU20 1.00 2.27 1.00 2.24 1.00 1.00 DMU21 0.55 0.55 0.46 0.46 0.10 0.27 DMU22 0.97 0.98 0.93 0.93 0.22 0.36 DMU23 0.56 0.56 0.55 0.55 0.47 0.42 DMU24 0.95 0.95 0.75 0.75 0.36 0.73 DMU25 0.77 0.77 0.70 0.70 0.23 0.59 DMU26 0.81 0.81 0.80 0.80 0.61 0.74 DMU27 0.95 0.95 0.73 0.73 0.31 0.68 DMU28 0.75 0.75 0.75 0.75 0.60 0.71 DMU29 0.91 0.91 0.89 0.89 0.83 0.89 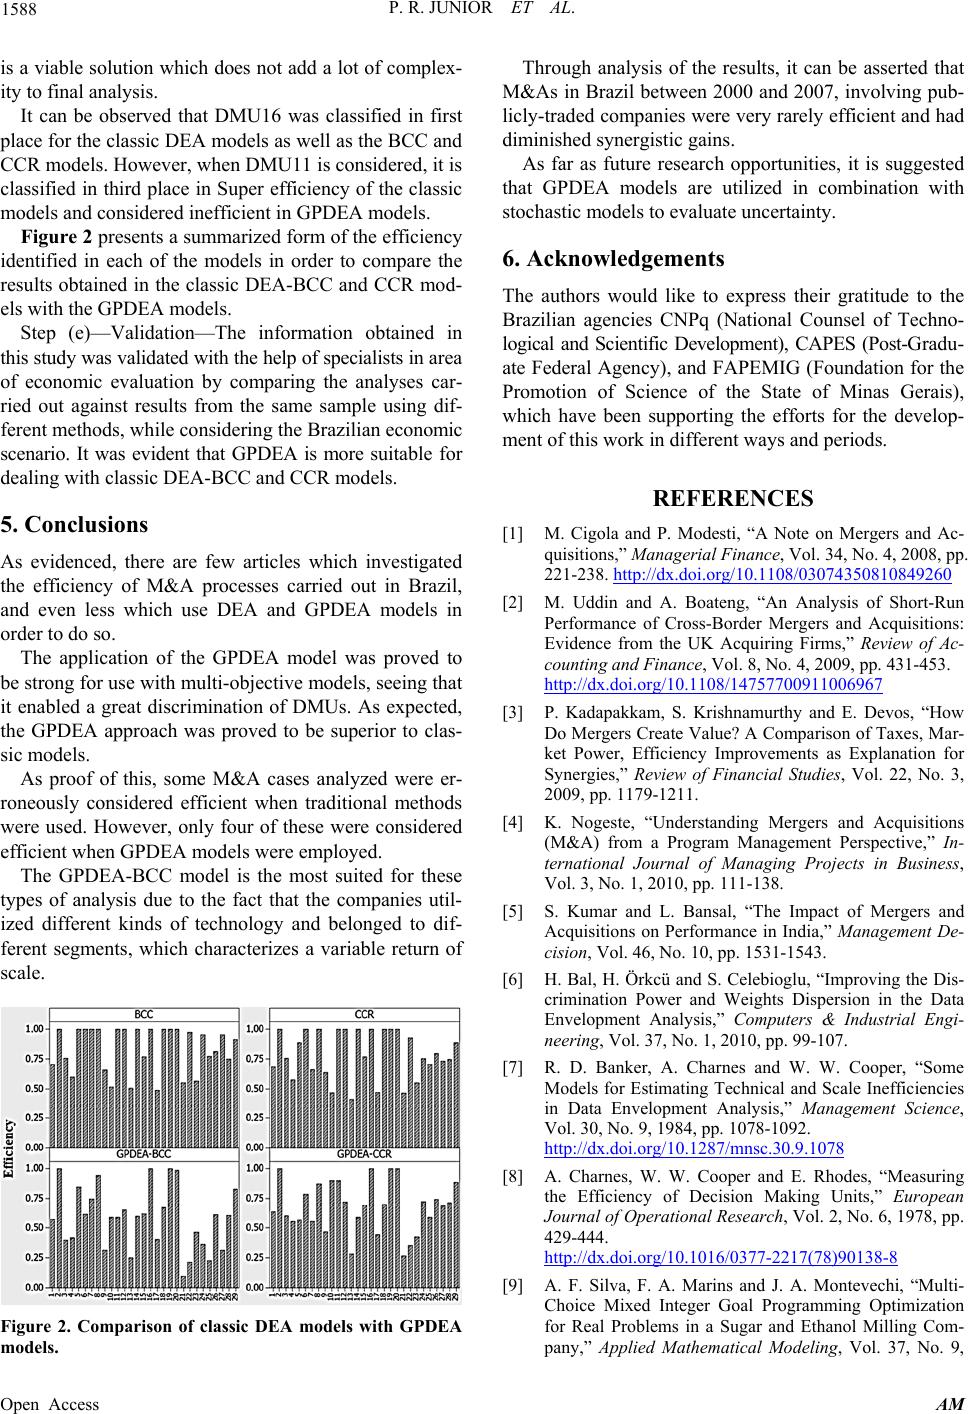 P. R. JUNIOR ET AL. 1588 is a viable solution which does not add a lot of complex- ity to final analysis. It can be observed that DMU16 was classified in first place for the classic DEA models as well as the BCC and CCR models. However, when DMU11 is considered, it is classified in third place in Super efficiency of the classic models and considered inefficient in GPDEA models. Figure 2 presents a summarized form of the efficiency identified in each of the models in order to compare the results obtained in the classic DEA-BCC and CCR mod- els with the GPDEA models. Step (e)—Validation—The information obtained in this study was validated with the help of specialists in area of economic evaluation by comparing the analyses car- ried out against results from the same sample using dif- ferent methods, while considering the Brazilian economic scenario. It was evident that GPDEA is more suitable for dealing with classic DEA-BCC and CCR models. 5. Conclusions As evidenced, there are few articles which investigated the efficiency of M&A processes carried out in Brazil, and even less which use DEA and GPDEA models in order to do so. The application of the GPDEA model was proved to be strong for use with multi-objective models, seeing that it enabled a great discrimination of DMUs. As expected, the GPDEA approach was proved to be superior to clas- sic models. As proof of this, some M&A cases analyzed were er- roneously considered efficient when traditional methods were used. However, only four of these were considered efficient when GPDEA models were employed. The GPDEA-BCC model is the most suited for these types of analysis due to the fact that the companies util- ized different kinds of technology and belonged to dif- ferent segments, which characterizes a variable return of scale. Figure 2. Comparison of classic DEA models with GPDEA models. Through analysis of the results, it can be asserted that M&As in Brazil between 2000 and 2007, involving pub- licly-traded companies were very rarely efficient and had diminished synergistic gains. As far as future research opportunities, it is suggested that GPDEA models are utilized in combination with stochastic models to evaluate uncertainty. 6. Acknowledgements The authors would like to express their gratitude to the Brazilian agencies CNPq (National Counsel of Techno- logical and Scientific Development), CAPES (Post-Gradu- ate Federal Agency), and FAPEMIG (Foundation for the Promotion of Science of the State of Minas Gerais), which have been supporting the efforts for the develop- ment of this work in different ways and periods. REFERENCES [1] M. Cigola and P. Modesti, “A Note on Mergers and Ac- quisitions,” Managerial Finance, Vol. 34, No. 4, 2008, pp. 221-238. http://dx.doi.org/10.1108/03074350810849260 [2] M. Uddin and A. Boateng, “An Analysis of Short-Run Performance of Cross-Border Mergers and Acquisitions: Evidence from the UK Acquiring Firms,” Review of Ac- counting and Finance, Vol. 8, No. 4, 2009, pp. 431-453. http://dx.doi.org/10.1108/14757700911006967 [3] P. Kadapakkam, S. Krishnamurthy and E. Devos, “How Do Mergers Create Value? A Comparison of Taxes, Mar- ket Power, Efficiency Improvements as Explanation for Synergies,” Review of Financial Studies, Vol. 22, No. 3, 2009, pp. 1179-1211. [4] K. Nogeste, “Understanding Mergers and Acquisitions (M&A) from a Program Management Perspective,” In- ternational Journal of Managing Projects in Business, Vol. 3, No. 1, 2010, pp. 111-138. [5] S. Kumar and L. Bansal, “The Impact of Mergers and Acquisitions on Performance in India,” Management De- cision, Vol. 46, No. 10, pp. 1531-1543. [6] H. Bal, H. Örkcü and S. Celebioglu, “Improving the Dis- crimination Power and Weights Dispersion in the Data Envelopment Analysis,” Computers & Industrial Engi- neering, Vol. 37, No. 1, 2010, pp. 99-107. [7] R. D. Banker, A. Charnes and W. W. Cooper, “Some Models for Estimating Technical and Scale Inefficiencies in Data Envelopment Analysis,” Management Science, Vol. 30, No. 9, 1984, pp. 1078-1092. http://dx.doi.org/10.1287/mnsc.30.9.1078 [8] A. Charnes, W. W. Cooper and E. Rhodes, “Measuring the Efficiency of Decision Making Units,” European Journal of Operational Research, Vol. 2, No. 6, 1978, pp. 429-444. http://dx.doi.org/10.1016/0377-2217(78)90138-8 [9] A. F. Silva, F. A. Marins and J. A. Montevechi, “Multi- Choice Mixed Integer Goal Programming Optimization for Real Problems in a Sugar and Ethanol Milling Com- pany,” Applied Mathematical Modeling, Vol. 37, No. 9, Open Access AM  P. R. JUNIOR ET AL. 1589 2013, pp. 6164-6162. http://dx.doi.org/10.1016/j.apm.2012.12.022 [10] W. W. Cooper, L. M. Seiford and K. Tone, “Data Envel- opment Analysis: A Comprehensive Text with Models, Application, References and DEA-Solver Software,” 2nd Edition, Springer Science + Business, New York, 2007. [11] C. Kummer and U. Steger, “Why Mergers and Acquisi- tions (M&A) Waves Reoccur: The Vicious Circle from Pressure to Failure,” Strategic Management Review, Vol. 24, No. 2, 2008, pp. 44-63. [12] G. Lodorfos and A. Boateng, “The Role of Culture in the Merger and Acquisition Process: Evidence from the Euro- pean Chemical Industry,” Management Decision, Vol. 44, No. 10, 2006, pp. 1405-1421. http://dx.doi.org/10.1108/00251740610715722 [13] K. Christensen, “Losing Innovativeness the Challenge of Being Acquired,” Management Decision, Vol. 44, No. 9, 2006, pp. 1161-1182. http://dx.doi.org/10.1108/00251740610707668 [14] S. Kumar, “Post-Merger Corporate Performance: An In- dian Perspective,” Management Research, Vol. 32, No. 2, 2009, pp. 145-157. [15] M. Gort, “An Economic Disturbance Theory of Mergers,” Quarterly Journal of Economics, Vol. 83, No. 4, 1969, pp. 624-642. [16] M. Jensen, “The Modern Industrial Revolution, Exit and the Failure of Internal Control Systems,” Journal of Fi- nance, Vol. 48, No. 3, 1993, pp. 831-880. [17] M. Mitchell and J. Mulherin, “The Impact of Industry Shocks on Takeover and Restructuring Activity,” Journal of Financial Economics, Vol. 41, No. 2, 1996, pp. 193- 229. [18] J. Harford, “What Drives Merger Waves,” Journal of Fi- nancial Economics, Vol. 77, No. 3, 2005, pp. 529-560. [19] “KPMG Corporate Finance, Mergers and Acquisitions Research,” 2013. http://www.kpmg.com/BR/PT/Estudos_Analises/artigosep ublicacoes/Documents/Fusoes%20e%20Aquisicoes/2012/ FA-3-trim-2012.pdf [20] S. Phelan, “Exposing the Illusion of Confidence in Finan- cial Analysis,” Management Decision, Vol. 35, No. 2, 1997, pp. 162-168. http://dx.doi.org/10.1108/00251749710160322 [21] P. M. Healy, K. Palepu and R. S. Ruback, “Does Corpo- rate Performance Improve after Mergers?” Journal of Fi- nancial and Quantitative Analysis, Vol. 37, No. 1, 1992, pp. 135-175. [22] S. Linn and J. Switzer, “Are Cash Acquisitions Associ- ated with Better Post-Combination Operating Perform- ance than Stock Acquisitions,” Journal of Banking & Fi- nance, Vol. 25, No. 6, 2001, pp. 1113-1138. [23] R. Heron and E. Lie, “Operating Performance and the Method of Payment in Takeovers,” Journal of Financial and Quantitative Analysis, Vol. 37, No. 1, 2002, pp. 137- 155. http://dx.doi.org/10.2307/3594998 [24] K. Gugler, D. Mueller, B. Yurtoglu and C. Zulehner, “The Effects of Mergers: An International Comparison,” International Journal of Industrial Organization, Vol. 21, No. 5, 2003, pp. 625-653. http://dx.doi.org/10.1016/S0167-7187(02)00107-8 [25] E. Pamplona and P. R. Junior, “Analysis of Mergers and Acquisitions in Brazilian Companies,” African Journal of Business Management, Vol. 7, No. 26, 2013, pp. 2625- 2633. [26] C. Wang and F. Xie, “Corporate Governance Transfer and Synergistic Gains from Mergers and Acquisitions,” Review of Financial Studies, Vol. 22, No. 2, 2009, pp. 829-858. [27] B. Lau, A. Proimos and S. Wrigth, “Accounting Measures of Operating Performance Outcomes for Australian Merg- ers,” Journal of Applied Accounting Research, Vol. 9, No. 3, 2008, pp. 168-180. http://dx.doi.org/10.1108/09675420810919720 [28] A. Charnes and W. W. Cooper, “Programming with Lin- ear Fractional Functional,” Naval Research Logistics Quarterly, Vol. 9, No. 3-4, 1962, pp. 181-185. [29] M. Tamiz, D. Jones and C. Romero, “Goal Programming for Decision Making: An Overview of the Current State- Of-The-Art,” European Journal of Operational Research, Vol. 111, No. 3, 1998, pp. 569-581. http://dx.doi.org/10.1016/S0377-2217(97)00317-2 [30] M. A. Yaghoobi and M. Tamiz, “A Method for Solving Fuzzy Goal Programming Problems Based on MINMAX Approach,” European Journal of Operational Research, Vol. 177, No. 3, 2007, pp. 1580-1590. http://dx.doi.org/10.1016/j.ejor.2005.10.022 [31] X.-B. Li and G. Reeves, “A Multiple Criteria Approach to Data Envelopment Analysis,” European Journal of Op- erational Research, Vol. 115, No. 3, 1999, pp. 507-517. http://dx.doi.org/10.1016/S0377-2217(98)00130-1 [32] J. W. M. Bertrand and J. C. Fransoo, “Operations Man- agement Research Methodologies Using Quantitative Modeling,” International Journal of Operations & Pro- duction Management, Vol. 22, No. 2, 2002, pp. 241-264. http://dx.doi.org/10.1108/01443570210414338 Open Access AM
|