 Technology and Investment, 2013, 4, 236-243 Published Online November 2013 (http://www.scirp.org/journal/ti) http://dx.doi.org/10.4236/ti.2013.44028 Open Access TI Inter-Industry Productivity Spillovers from Japanese and US FDI in Mexico’s Manufacturing Sector Leo Guzmán Anaya University of Guadalajara, Guadalajara, Mexico Email: leo.guzman8@gmail.com Received April 24, 2013; revised May 24, 2013; accepted May 30, 2013 Copyright © 2013 Leo Guzmán Anaya. This is an open access article distributed under the Creative Commons Attribution License, which permits unrestricted use, distribution, and reproduction in any medium, provided the original work is properly cited. ABSTRACT Foreign Direct Investment can have positive effects on host countries by generating spillovers to domestic firms and contributing to increases in their productivity. These productivity spillovers1 can take place within an industry (intra- industry spillovers) and across industries (inter-industry spillovers) as in the case of technology or knowledge transfer to domestic suppliers (backward productivity spillovers) or customers (forward productivity spillovers). Using unpub- lished economic census data from Mexico’s manufacturing sector this study differs from others by comparing inter- industry productivity spillovers from Japanese and US FDI. Results show that Japanese FDI increases the productivity of upstream sectors; however these gains seem to be shared only among foreign suppliers, while US FDI does not seem to generate backward productivity spillovers. Results show no presence of forward productivity spillovers. Keywords: Foreign Direct Investment; Productivity Spillovers; Backward Linkages; Forward Linkages; Mexican Manufacturing Sector 1. Introduction Foreign Direct Investment (FDI) has been high on the agenda of many policy makers in developing countries, especially after the decrease of bank lending of the 1980’s, which prompted most of these countries to invite FDI by reducing restrictions on foreign capital and by offering subsidies and tax incentives to foreign investors [2]. Reference [3] mentions that in 1998, 60 countries made regulatory changes towards FDI, where 94% were aimed to generate more favorable conditions to foreign investors. Mexico has also eased restrictions on FDI, especially after the debt crisis of the 1980’s where for- eign investment became the main source of financing after 1988 [4]. The Mexican government has since then pursued active policies to lower the entry barriers to in- vestment from Multinational Enterprises (MNEs) in the hope that FDI would promote economic development through technological, knowledge and productivity spill- overs as well as through export growth. The country has also transitioned from an import substitution to an export promotion strategy where FDI has played a central role. Since the middle of the 1980’s, and more particularly since the implementation of the North American Free Trade Agreement (NAFTA) in 1994, FDI flows to Mex- ico increased2. Despite the increases of FDI inflows to Mexico and other developing countries, the spillover effects of FDI still remain unclear [2]. The economic foundations to offer special incentives to attract FDI derive from the idea that foreign invest- ment is a composite bundle of capital, know-how, and technology which produces externalities (known as “spill- overs”), mainly through technology transfer as well as technology and skill diffusion in the countries that import FDI, which will increase the productivity of local firms ([3,5,6]). Also, the literature distinguishes between spill- overs to firms in the same industry (intra-industry spill- overs) from spillovers to firms across industries (inter- industry spillovers). This implies that local firms may benefit from presence of MNEs in their same sector or from FDI presence in upstream or downstream sectors that have linkages with local firms. Early empirical literature focused on intra-industry spill- 2After receiving FDI inflows worth around 5.5 billion constant 2000 US dollars in 1993, the amount in 1994 was over 11 billion US dollars in constant 2000 prices. 1Productivity spillovers are defined according to [1] as “the average roductivity gains of domestic firms due to foreign firm presence in the host country”. 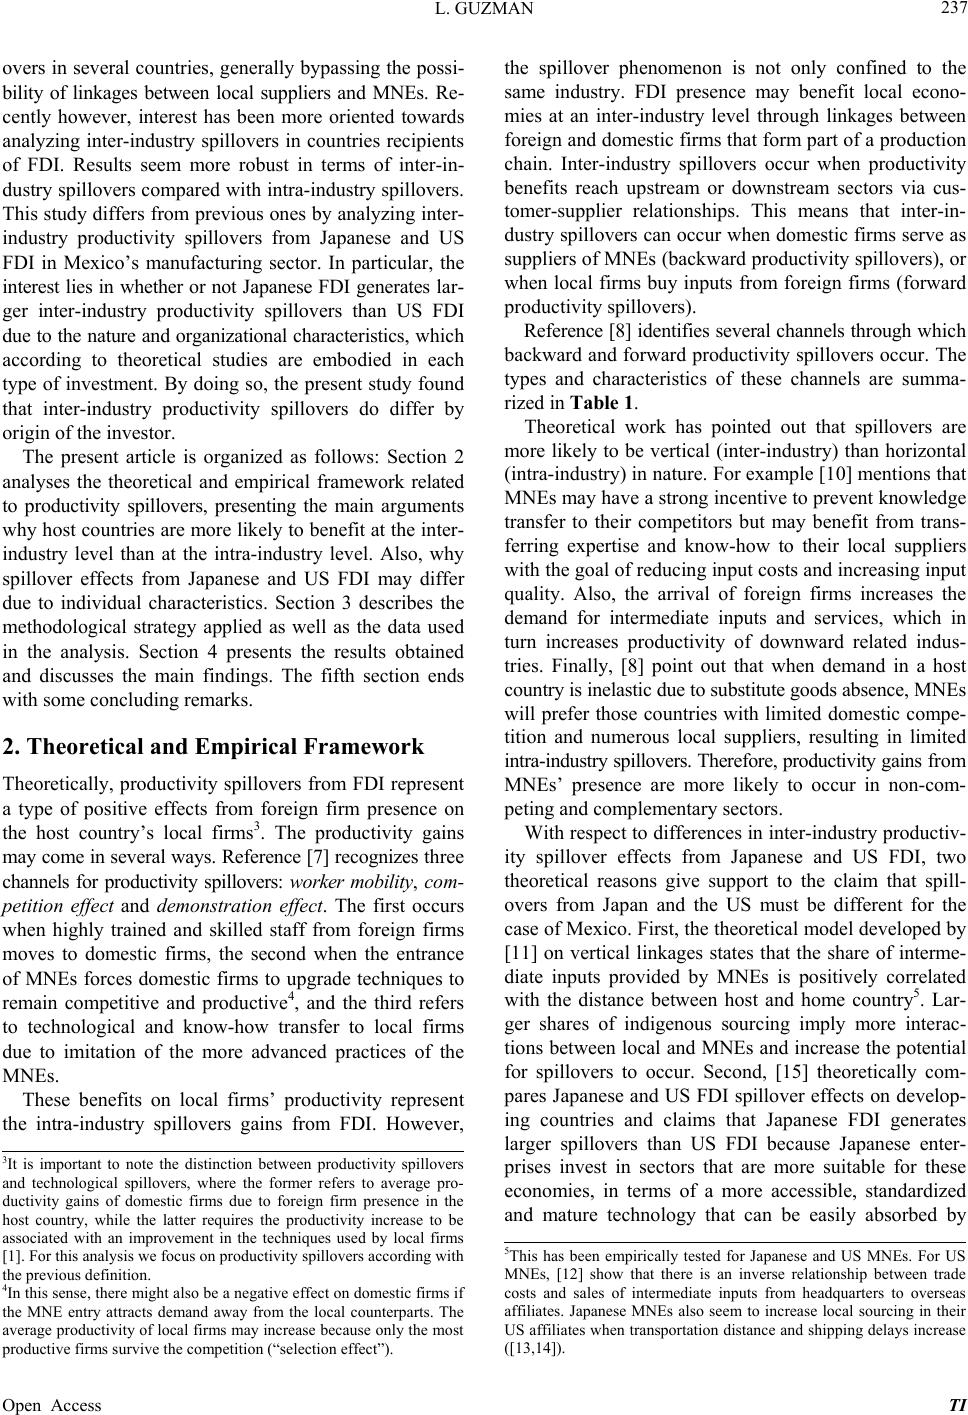 L. GUZMAN 237 overs in several countries, generally bypassing the possi- bility of linkages between local suppliers and MNEs. Re- cently however, interest has been more oriented towards analyzing inter-industry spillovers in countries recipients of FDI. Results seem more robust in terms of inter-in- dustry spillovers compared with intra-industry spillovers. This study differs from previous ones by analyzing inter- industry productivity spillovers from Japanese and US FDI in Mexico’s manufacturing sector. In particular, the interest lies in whether or not Japanese FDI generates lar- ger inter-industry productivity spillovers than US FDI due to the nature and organizational characteristics, which according to theoretical studies are embodied in each type of investment. By doing so, the present study found that inter-industry productivity spillovers do differ by origin of the investor. The present article is organized as follows: Section 2 analyses the theoretical and empirical framework related to productivity spillovers, presenting the main arguments why host countries are more likely to benefit at the inter- industry level than at the intra-industry level. Also, why spillover effects from Japanese and US FDI may differ due to individual characteristics. Section 3 describes the methodological strategy applied as well as the data used in the analysis. Section 4 presents the results obtained and discusses the main findings. The fifth section ends with some concluding remarks. 2. Theoretical and Empirical Framework Theoretically, productivity spillovers from FDI represent a type of positive effects from foreign firm presence on the host country’s local firms3. The productivity gains may come in several ways. Reference [7] recognizes three channels for productivity spillovers: worker mobility, com- petition effect and demonstration effect. The first occurs when highly trained and skilled staff from foreign firms moves to domestic firms, the second when the entrance of MNEs forces domestic firms to upgrade techniques to remain competitive and productive4, and the third refers to technological and know-how transfer to local firms due to imitation of the more advanced practices of the MNEs. These benefits on local firms’ productivity represent the intra-industry spillovers gains from FDI. However, the spillover phenomenon is not only confined to the same industry. FDI presence may benefit local econo- mies at an inter-industry level through linkages between foreign and domestic firms that form part of a production chain. Inter-industry spillovers occur when productivity benefits reach upstream or downstream sectors via cus- tomer-supplier relationships. This means that inter-in- dustry spillovers can occur when domestic firms serve as suppliers of MNEs (backward productivity spillovers), or when local firms buy inputs from foreign firms (forward productivity spillovers). Reference [8] identifies several channels through which backward and forward productivity spillovers occur. The types and characteristics of these channels are summa- rized in Table 1. Theoretical work has pointed out that spillovers are more likely to be vertical (inter-industry) than horizontal (intra-industry) in nature. For example [10] mentions that MNEs may have a strong incentive to prevent knowledge transfer to their competitors but may benefit from trans- ferring expertise and know-how to their local suppliers with the goal of reducing input costs and increasing input quality. Also, the arrival of foreign firms increases the demand for intermediate inputs and services, which in turn increases productivity of downward related indus- tries. Finally, [8] point out that when demand in a host country is inelastic due to substitute goods absence, MNEs will prefer those countries with limited domestic compe- tition and numerous local suppliers, resulting in limited intra-industry spillovers. Therefore, productivity gains from MNEs’ presence are more likely to occur in non-com- peting and complementary sectors. With respect to differences in inter-industry productiv- ity spillover effects from Japanese and US FDI, two theoretical reasons give support to the claim that spill- overs from Japan and the US must be different for the case of Mexico. First, the theoretical model developed by [11] on vertical linkages states that the share of interme- diate inputs provided by MNEs is positively correlated with the distance between host and home country5. Lar- ger shares of indigenous sourcing imply more interac- tions between local and MNEs and increase the potential for spillovers to occur. Second, [15] theoretically com- pares Japanese and US FDI spillover effects on develop- ing countries and claims that Japanese FDI generates larger spillovers than US FDI because Japanese enter- prises invest in sectors that are more suitable for these economies, in terms of a more accessible, standardized and mature technology that can be easily absorbed by 3It is important to note the distinction between productivity spillovers and technological spillovers, where the former refers to average pro- ductivity gains of domestic firms due to foreign firm presence in the host country, while the latter requires the productivity increase to be associated with an improvement in the techniques used by local firms [1]. For this analysis we focus on productivity spillovers according with the previous definition. 4In this sense, there might also be a negative effect on domestic firms i the MNE entry attracts demand away from the local counterparts. The average productivity of local firms may increase because only the most roductive firms survive the competition (“selection effect”). 5This has been empirically tested for Japanese and US MNEs. For US MNEs, [12] show that there is an inverse relationship between trade costs and sales of intermediate inputs from headquarters to overseas affiliates. Japanese MNEs also seem to increase local sourcing in their US affiliates when transportation distance and shipping delays increase ([13,14]). Open Access TI 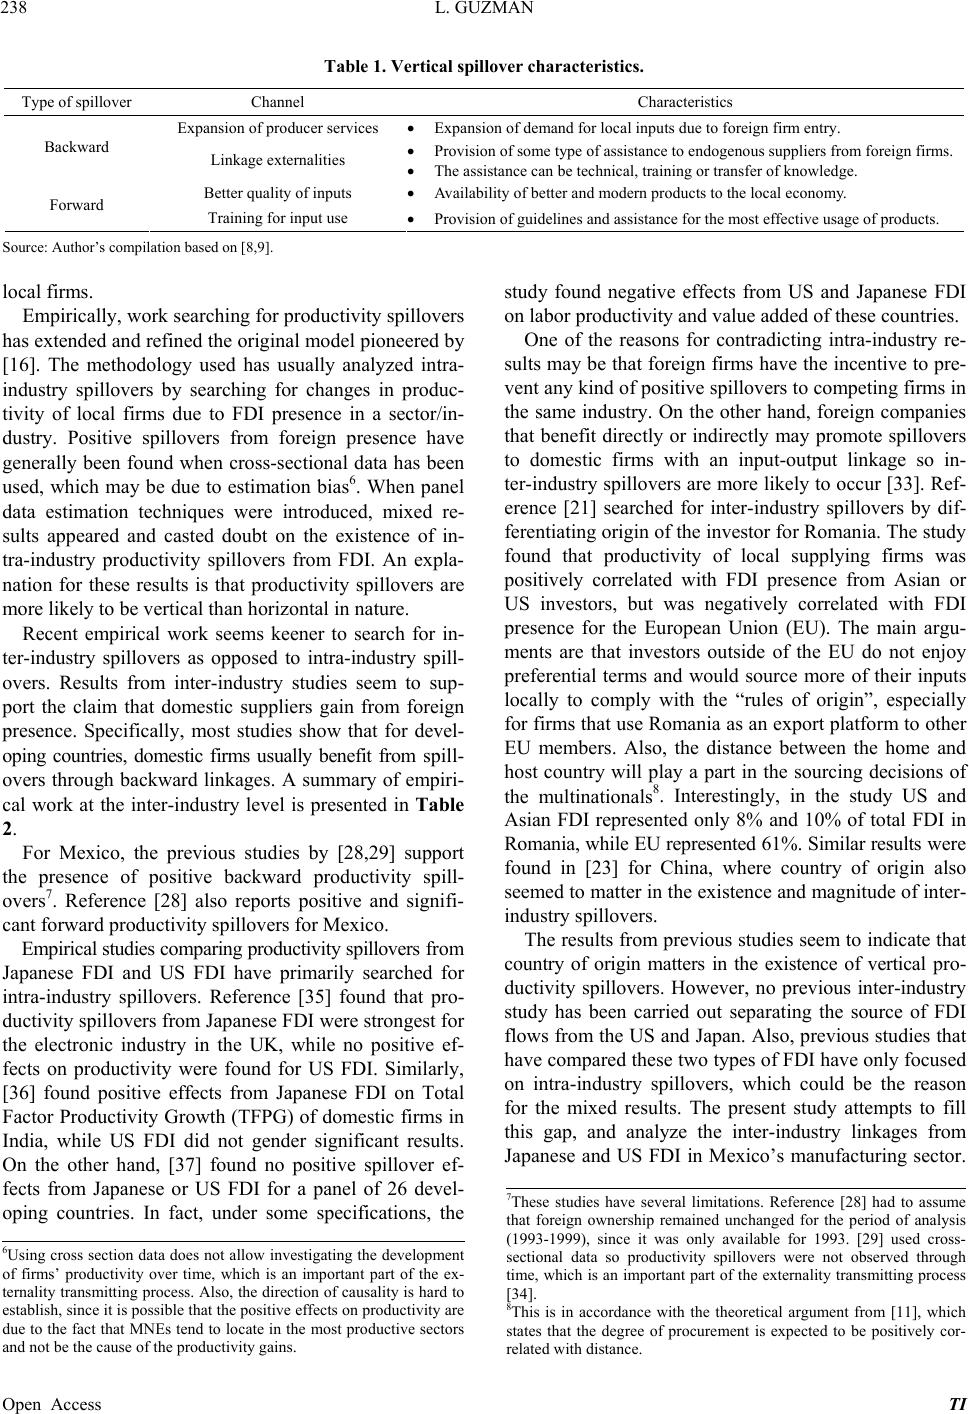 L. GUZMAN Open Access TI 238 Table 1. Vertical spillover characteristics. Type of spillover Channel Characteristics Expansion of producer services Expansion of demand for local inputs due to foreign firm entry. Backward Linkage externalities Provision of some type of assistance to endogenous suppliers from foreign firms. The assistance can be technical, training or transfer of knowledge. Better quality of inputs Availability of better and modern products to the local economy. Forward Training for input use Provision of guidelines and assistance for the most effective usage of products. Source: Author’s compilation based on [8,9]. local firms. Empirically, work searching for productivity spillovers has extended and refined the original model pioneered by [16]. The methodology used has usually analyzed intra- industry spillovers by searching for changes in produc- tivity of local firms due to FDI presence in a sector/in- dustry. Positive spillovers from foreign presence have generally been found when cross-sectional data has been used, which may be due to estimation bias6. When panel data estimation techniques were introduced, mixed re- sults appeared and casted doubt on the existence of in- tra-industry productivity spillovers from FDI. An expla- nation for these results is that productivity spillovers are more likely to be vertical than horizontal in nature. Recent empirical work seems keener to search for in- ter-industry spillovers as opposed to intra-industry spill- overs. Results from inter-industry studies seem to sup- port the claim that domestic suppliers gain from foreign presence. Specifically, most studies show that for devel- oping countries, domestic firms usually benefit from spill- overs through backward linkages. A summary of empiri- cal work at the inter-industry level is presented in Table 2. For Mexico, the previous studies by [28,29] support the presence of positive backward productivity spill- overs7. Reference [28] also reports positive and signifi- cant forward productivity spillovers for Mexico. Empirical studies comparing productivity spillovers from Japanese FDI and US FDI have primarily searched for intra-industry spillovers. Reference [35] found that pro- ductivity spillovers from Japanese FDI were strongest for the electronic industry in the UK, while no positive ef- fects on productivity were found for US FDI. Similarly, [36] found positive effects from Japanese FDI on Total Factor Productivity Growth (TFPG) of domestic firms in India, while US FDI did not gender significant results. On the other hand, [37] found no positive spillover ef- fects from Japanese or US FDI for a panel of 26 devel- oping countries. In fact, under some specifications, the study found negative effects from US and Japanese FDI on labor productivity and value added of these countries. One of the reasons for contradicting intra-industry re- sults may be that foreign firms have the incentive to pre- vent any kind of positive spillovers to competing firms in the same industry. On the other hand, foreign companies that benefit directly or indirectly may promote spillovers to domestic firms with an input-output linkage so in- ter-industry spillovers are more likely to occur [33]. Ref- erence [21] searched for inter-industry spillovers by dif- ferentiating origin of the investor for Romania. The study found that productivity of local supplying firms was positively correlated with FDI presence from Asian or US investors, but was negatively correlated with FDI presence for the European Union (EU). The main argu- ments are that investors outside of the EU do not enjoy preferential terms and would source more of their inputs locally to comply with the “rules of origin”, especially for firms that use Romania as an export platform to other EU members. Also, the distance between the home and host country will play a part in the sourcing decisions of the multinationals8. Interestingly, in the study US and Asian FDI represented only 8% and 10% of total FDI in Romania, while EU represented 61%. Similar results were found in [23] for China, where country of origin also seemed to matter in the existence and magnitude of inter- industry spillovers. The results from previous studies seem to indicate that country of origin matters in the existence of vertical pro- ductivity spillovers. However, no previous inter-industry study has been carried out separating the source of FDI flows from the US and Japan. Also, previous studies that have compared these two types of FDI have only focused on intra-industry spillovers, which could be the reason for the mixed results. The present study attempts to fill this gap, and analyze the inter-industry linkages from Japanese and US FDI in Mexico’s manufacturing sector. 7These studies have several limitations. Reference [28] had to assume that foreign ownership remained unchanged for the period of analysis (1993-1999), since it was only available for 1993. [29] used cross- sectional data so productivity spillovers were not observed through time, which is an important part of the externality transmitting process [34]. 8This is in accordance with the theoretical argument from [11], which states that the degree of procurement is expected to be positively cor- related with distance. 6Using cross section data does not allow investigating the development of firms’ productivity over time, which is an important part of the ex- ternality transmitting process. Also, the direction of causality is hard to establish, since it is possible that the positive effects on productivity are due to the fact that MNEs tend to locate in the most productive sectors and not be the cause of the productivity gains. 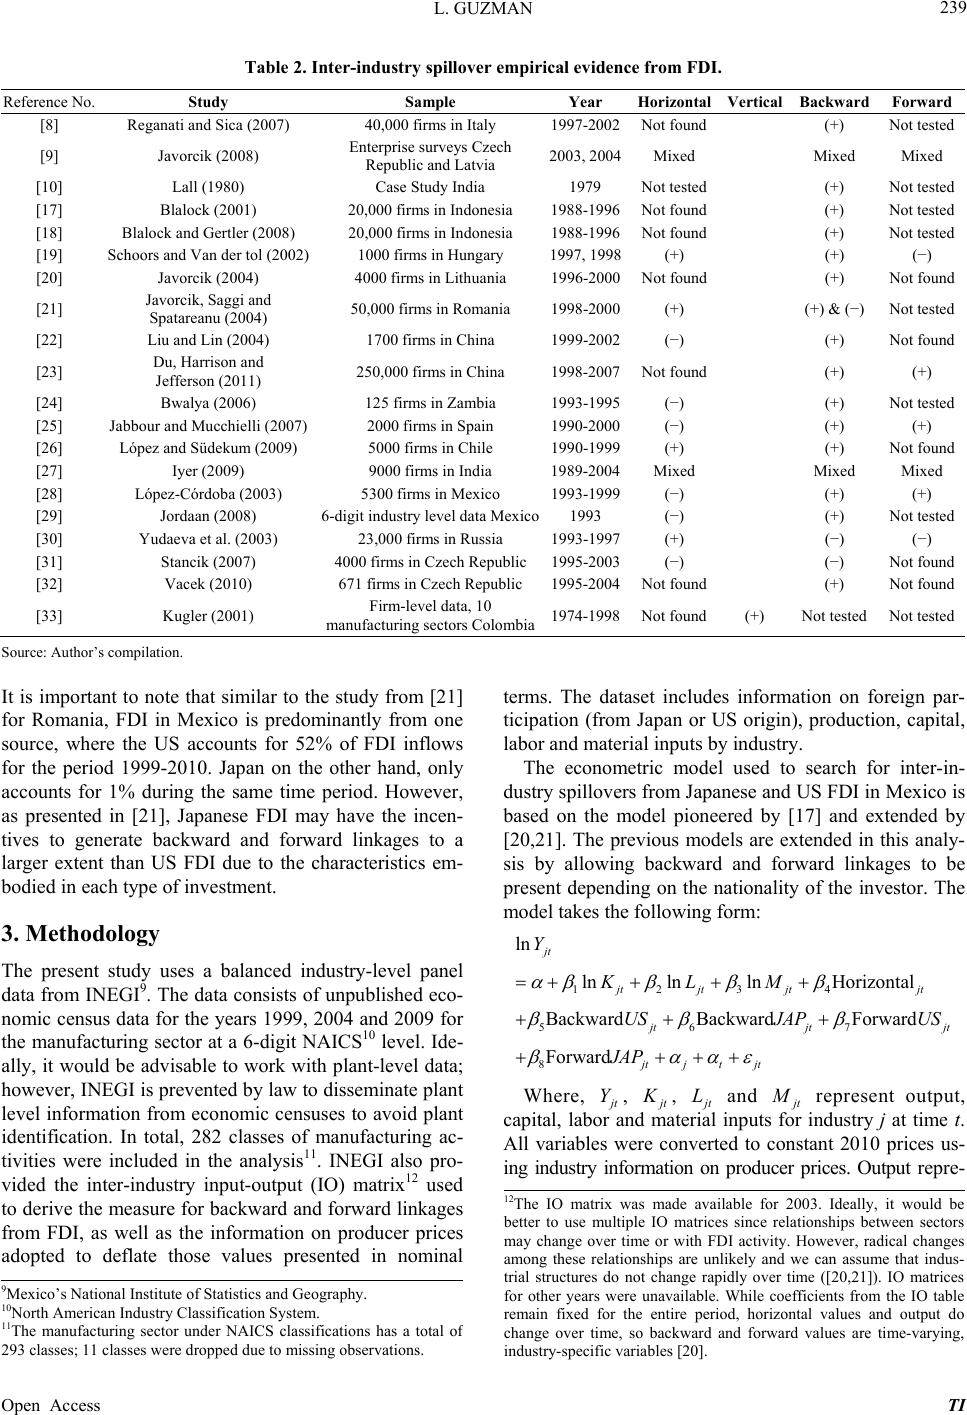 L. GUZMAN 239 Table 2. Inter-industry spillover empirical evidence from FDI. Reference No. Study Sample Year HorizontalVertical Backward Forward [8] Reganati and Sica (2007) 40,000 firms in Italy 1997-2002Not found (+) Not tested [9] Javorcik (2008) Enterprise surveys Czech Republic and Latvia 2003, 2004Mixed Mixed Mixed [10] Lall (1980) Case Study India 1979 Not tested (+) Not tested [17] Blalock (2001) 20,000 firms in Indonesia 1988-1996Not found (+) Not tested [18] Blalock and Gertler (2008) 20,000 firms in Indonesia 1988-1996Not found (+) Not tested [19] Schoors and Van der tol (2002) 1000 firms in Hungary 1997, 1998(+) (+) (−) [20] Javorcik (2004) 4000 firms in Lithuania 1996-2000Not found (+) Not found [21] Javorcik, Saggi and Spatareanu (2004) 50,000 firms in Romania 1998-2000(+) (+) & (−) Not tested [22] Liu and Lin (2004) 1700 firms in China 1999-2002(−) (+) Not found [23] Du, Harrison and Jefferson (2011) 250,000 firms in China 1998-2007Not found (+) (+) [24] Bwalya (2006) 125 firms in Zambia 1993-1995(−) (+) Not tested [25] Jabbour and Mucchielli (2007) 2000 firms in Spain 1990-2000(−) (+) (+) [26] López and Südekum (2009) 5000 firms in Chile 1990-1999(+) (+) Not found [27] Iyer (2009) 9000 firms in India 1989-2004Mixed Mixed Mixed [28] López-Córdoba (2003) 5300 firms in Mexico 1993-1999(−) (+) (+) [29] Jordaan (2008) 6-digit industry level data Mexico1993 (−) (+) Not tested [30] Yudaeva et al. (2003) 23,000 firms in Russia 1993-1997(+) (−) (−) [31] Stancik (2007) 4000 firms in Czech Republic1995-2003(−) (−) Not found [32] Vacek (2010) 671 firms in Czech Republic 1995-2004Not found (+) Not found [33] Kugler (2001) Firm-level data, 10 manufacturing sectors Colombia1974-1998Not found(+) Not tested Not tested Source: Author’s compilation. It is important to note that similar to the study from [21] for Romania, FDI in Mexico is predominantly from one source, where the US accounts for 52% of FDI inflows for the period 1999-2010. Japan on the other hand, only accounts for 1% during the same time period. However, as presented in [21], Japanese FDI may have the incen- tives to generate backward and forward linkages to a larger extent than US FDI due to the characteristics em- bodied in each type of investment. 3. Methodology The present study uses a balanced industry-level panel data from INEGI9. The data consists of unpublished eco- nomic census data for the years 1999, 2004 and 2009 for the manufacturing sector at a 6-digit NAICS10 level. Ide- ally, it would be advisable to work with plant-level data; however, INEGI is prevented by law to disseminate plant level information from economic censuses to avoid plant identification. In total, 282 classes of manufacturing ac- tivities were included in the analysis11. INEGI also pro- vided the inter-industry input-output (IO) matrix12 used to derive the measure for backward and forward linkages from FDI, as well as the information on producer prices adopted to deflate those values presented in nominal terms. The dataset includes information on foreign par- ticipation (from Japan or US origin), production, capital, labor and material inputs by industry. The econometric model used to search for inter-in- dustry spillovers from Japanese and US FDI in Mexico is based on the model pioneered by [17] and extended by [20,21]. The previous models are extended in this analy- sis by allowing backward and forward linkages to be present depending on the nationality of the investor. The model takes the following form: 123 4 56 7 8 ln lnlnlnHorizontal Backward BackwardForward Forward jt jt jtjtjt jtjt jt jtj t jt Y KLM USJAP US JAP Where, t, Y t , t and L t represent output, capital, labor and material inputs for industry j at time t. All variables were converted to constant 2010 prices us- ing industry information on producer prices. Output repre- 12The IO matrix was made available for 2003. Ideally, it would be etter to use multiple IO matrices since relationships between sectors may change over time or with FDI activity. However, radical changes among these relationships are unlikely and we can assume that indus- trial structures do not change rapidly over time ([20,21]). IO matrices for other years were unavailable. While coefficients from the IO table remain fixed for the entire period, horizontal values and output do change over time, so backward and forward values are time-varying, industry-specific variables [20]. 9Mexico’s National Institute of Statistics and Geography. 10North American Industry Classification System. 11The manufacturing sector under NAICS classifications has a total o 293 classes; 11 classes were dropped due to missing observations. Open Access TI  L. GUZMAN 240 sents gross total output in an industry. Capital is meas- ured as total fixed assets in an industry. Labor is meas- ured by the total number of workers in an industry and material inputs represent the value of intermediate mate- rial inputs used by industry. The Horizont al t variable represents foreign pres- ence in the same industry and is measured as the share of industry j’s output produced by foreign firms in time t. This variable measures intra-industry spillovers from FDI. The Backward t variable was added to test the in- ter-industry productivity effects from US and Japanese FDI. It represents the share of an industry’s output pur- chased by downstream foreign enterprise. It is a proxy for foreign presence in downstream sectors that intends to capture the effect of foreign enterprises as customers of domestic suppliers [17]. It is defined as: Backward Horizontal tjk kif kj kt Where m is the share of upstream industry j’s out- put used by downstream sector k taken from the 2003 IO matrix. Two different measures of this variable are cal- culated, one for Japanese FDI and one for US FDI re- spectively. The Forward t variable measures the share of an in- dustry’s output sold by upstream foreign enterprises to domestic customers. It is a proxy for foreign presence in upstream sectors; it intends to capture the effect of for- eign enterprises as suppliers of domestic producers. It takes the following form: Forward Horizontal tjm mifm j mt Where m is the share of downstream industry j’s output used by upstream sector m taken from the 2003 IO matrix. This variable is also calculated for the case of Japan and US foreign presence. Finally, and t are industry and time specific effects, and 2 ~0,II jt D is the error term. 4. Results The test for the spillover hypothesis was carried out on the full sample and on a sub-sample excluding foreign firm production, in other words only focusing on domes- tic production13. Also, the Levinsohn-Petrin14 correction was used to deal with the endogeneity problem that arises when estimating production functions15. Using the Le- vinsohn-Petrin correction allowed obtaining Total Factor Productivity (TFP) values that were later used as de- pendent variable in the basic model. We also extended the model with first differences16. Results from both es- timations are presented in Tables 3 and 4 respectively. Table 3 shows that the variables jointly considered are significant at a 1 per cent level. From the variables of Table 3. Results from fixed effects estimation model. Dependent variable: InTFPjt Regressors All Domestic InKjt −0.53*** (−30.51) −0.34*** (−7.30) InLjt −0.27*** (−10.45) 0.26*** (−3.90) InMjt 0.78*** (39.67) 0.68*** (13.17) Horizontaljt 0.07* (1.79) −0.04*** (−23.66) BackwardUSjt −0.09 (−0.84) −0.01 (−0.51) BackwardJAPjt 1.94*** (2.86) 0.67 (1.09) ForwardUSjt 0.11 (0.74) −0.05 (−1.25) ForwardJAPjt 1.76 (1.00) −0.42 (−0.51) Constant 2.88*** (9.10) 3.94*** (4.90) R2 0.78 0.55 F 246.74*** 84.90*** nOBS 846 846 Notes: *Significance at 90% interval; **Significance at 95% interval; ***Significance at 99% interval. Numbers in parenthesis indicate t statistics. interest, the variable “Horizontal”, which measures intra- industry spillovers results positive and significant when all production is considered and negative and significant when only domestic production is tested. This result is interesting and seems to indicate that FDI arrival in Mexico has been accompanied by competitive pressure that has pushed less efficient domestic firms from the same industry out of the market. In this sense productivity spillover gains are shared only among foreign firms. Inter-industry spillovers were tested in the “Backward” and “Forward” variable. The backward variable for the case of the US showed negative but not statistically sig- nificant values, the same was observed for the US for 13The presence of an unobserved effect in the data was confirmed through the Breusch-Pagan Lagrange multiplier test. Afterwards, the chi-squared Hausman test was conducted to test for inconsistency in the random effects model and determined the appropriate estimation method. 14Reference [38]. 15The main problem is that the estimates might be biased due to corre- lation between input levels and productivity shocks. Reference [39] developed a semiparametric method to account for endogeneity o input demand. Specifically, they proposed an estimator that uses in- vestment as a proxy to account for the unobservable shocks. However, [38] mention that using the investment proxy might not always work. They mention that investment is a control on a state variable, which has adjustment costs that may affect the responsiveness to productivity shocks and thus violate the monotonicity condition. Also, the invest- ment proxy is only valid for industries that report nonzero investment. 16The main reason for differencing the equation is to address the poten- tial problem of omission of unobserved variables, which could in turn affect the relationship between foreign presence and industry produc- tivity [8]. First differencing permits the removal of these potential unobservable effects. Open Access TI 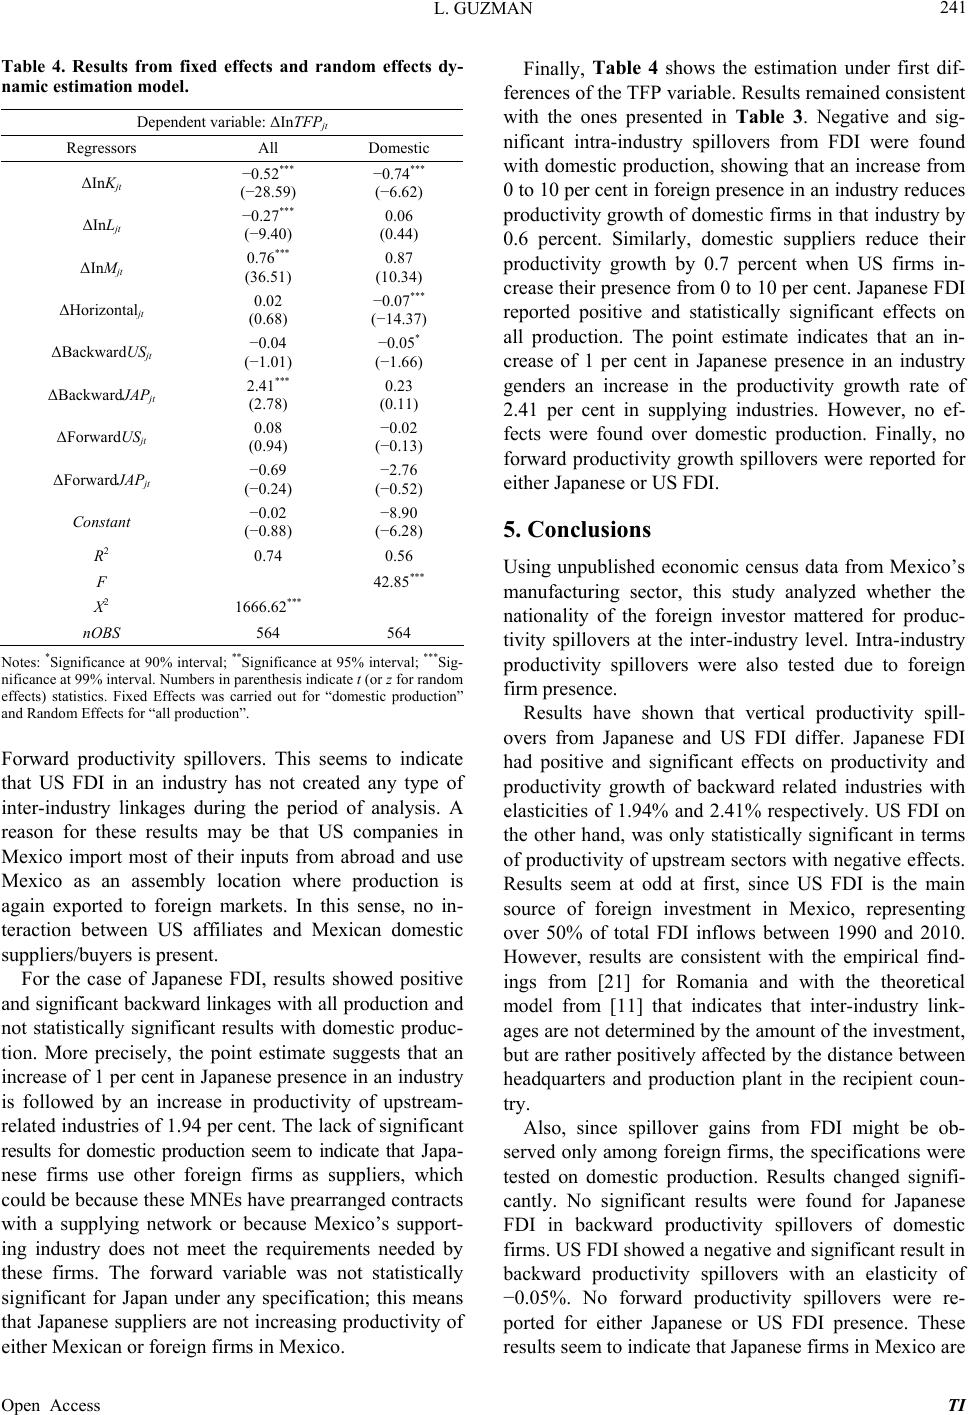 L. GUZMAN 241 Table 4. Results from fixed effects and random effects dy- namic estimation model. Dependent variable: ΔInTFPjt Regressors All Domestic ΔInKjt −0.52*** (−28.59) −0.74*** (−6.62) ΔInLjt −0.27*** (−9.40) 0.06 (0.44) ΔInMjt 0.76*** (36.51) 0.87 (10.34) ΔHorizontaljt 0.02 (0.68) −0.07*** (−14.37) ΔBackwardUSjt −0.04 (−1.01) −0.05* (−1.66) ΔBackwardJAPjt 2.41*** (2.78) 0.23 (0.11) ΔForwardUSjt 0.08 (0.94) −0.02 (−0.13) ΔForwardJAPjt −0.69 (−0.24) −2.76 (−0.52) Constant −0.02 (−0.88) −8.90 (−6.28) R2 0.74 0.56 F 42.85*** X2 1666.62*** nOBS 564 564 Notes: *Significance at 90% interval; **Significance at 95% interval; ***Sig- nificance at 99% interval. Numbers in parenthesis indicate t (or z for random effects) statistics. Fixed Effects was carried out for “domestic production” and Random Effects for “all production”. Forward productivity spillovers. This seems to indicate that US FDI in an industry has not created any type of inter-industry linkages during the period of analysis. A reason for these results may be that US companies in Mexico import most of their inputs from abroad and use Mexico as an assembly location where production is again exported to foreign markets. In this sense, no in- teraction between US affiliates and Mexican domestic suppliers/buyers is present. For the case of Japanese FDI, results showed positive and significant backward linkages with all production and not statistically significant results with domestic produc- tion. More precisely, the point estimate suggests that an increase of 1 per cent in Japanese presence in an industry is followed by an increase in productivity of upstream- related industries of 1.94 per cent. The lack of significant results for domestic production seem to indicate that Japa- nese firms use other foreign firms as suppliers, which could be because these MNEs have prearranged contracts with a supplying network or because Mexico’s support- ing industry does not meet the requirements needed by these firms. The forward variable was not statistically significant for Japan under any specification; this means that Japanese suppliers are not increasing productivity of either Mexican or foreign firms in Mexico. Finally, Table 4 shows the estimation under first dif- ferences of the TFP variable. Results remained consistent with the ones presented in Table 3. Negative and sig- nificant intra-industry spillovers from FDI were found with domestic production, showing that an increase from 0 to 10 per cent in foreign presence in an industry reduces productivity growth of domestic firms in that industry by 0.6 percent. Similarly, domestic suppliers reduce their productivity growth by 0.7 percent when US firms in- crease their presence from 0 to 10 per cent. Japanese FDI reported positive and statistically significant effects on all production. The point estimate indicates that an in- crease of 1 per cent in Japanese presence in an industry genders an increase in the productivity growth rate of 2.41 per cent in supplying industries. However, no ef- fects were found over domestic production. Finally, no forward productivity growth spillovers were reported for either Japanese or US FDI. 5. Conclusions Using unpublished economic census data from Mexico’s manufacturing sector, this study analyzed whether the nationality of the foreign investor mattered for produc- tivity spillovers at the inter-industry level. Intra-industry productivity spillovers were also tested due to foreign firm presence. Results have shown that vertical productivity spill- overs from Japanese and US FDI differ. Japanese FDI had positive and significant effects on productivity and productivity growth of backward related industries with elasticities of 1.94% and 2.41% respectively. US FDI on the other hand, was only statistically significant in terms of productivity of upstream sectors with negative effects. Results seem at odd at first, since US FDI is the main source of foreign investment in Mexico, representing over 50% of total FDI inflows between 1990 and 2010. However, results are consistent with the empirical find- ings from [21] for Romania and with the theoretical model from [11] that indicates that inter-industry link- ages are not determined by the amount of the investment, but are rather positively affected by the distance between headquarters and production plant in the recipient coun- try. Also, since spillover gains from FDI might be ob- served only among foreign firms, the specifications were tested on domestic production. Results changed signifi- cantly. No significant results were found for Japanese FDI in backward productivity spillovers of domestic firms. US FDI showed a negative and significant result in backward productivity spillovers with an elasticity of −0.05%. No forward productivity spillovers were re- ported for either Japanese or US FDI presence. These results seem to indicate that Japanese firms in Mexico are Open Access TI  L. GUZMAN 242 using other foreign suppliers, where the productivity gains remain among the more efficient foreign firms supplying Japanese producers. Since most Japanese MNEs form part of a “Keiretsu”17, it can be argued that the usage of suppliers usually comes from members of the same busi- ness group where supplier networks and prearranged con- tracts are established. US FDI showed detrimental effects on the development of Mexico’s supplying industry. These results could be a reflection of US enterprises im- porting most of their inputs under NAFTA’s preferential terms and taking advantage of programs that encourage temporal imports of intermediate products. Also, Mexi- can firms do not appear to use US firms as suppliers, which might be due to the fact that most of the produc- tion from US MNEs is for export purposes. Horizontal spillovers were also tested and interesting results were obtained. The initial specification showed positive and significant intra-industry productivity spill- overs, indicating that FDI in an industry increases pro- ductivity of firms within the industry. However, when only domestic production was analyzed, the results showed negative productivity spillover effects from FDI. These findings seem to indicate that foreign firm presence in Mexico’s manufacturing sector has been accompanied by competitive pressure that has pushed less efficient do- mestic firms from the same industry out of the market. In this sense, as in the case of inter-industry productivity spillovers, the productivity gains from FDI seem to be shared only among foreign firms. Finally, the results reported here have several policy implications. First, governments cannot treat all FDI from different origins in the same manner, results have shown that differences exist and governments have to encourage FDI that is the most adequate to their development goals and brings positive spillovers to the local economy. Sec- ond, governments also have to provide the right envi- ronment for spillovers to occur, encourage the develop- ment of the local supplier base that is adequate to serve established and prospective foreign firms and thus facili- tate the technological exchange between foreign and do- mestic firms [1]. Third, it is important to point out that developing local suppliers may not be enough, since for many MNEs the input sourcing decision is taken at head- quarters and generally follows the use of international supplier networks. Governments have to treat each in- vestment project as a different phenomenon and don’t expect to have the same benefits from all FDI received. In this sense, the present analysis has shown the national- ity of the investor matters in the presence of inter-indus- try productivity spillovers, in other words, FDI from dif- ferent sources has different effects on the host country. REFERENCES [1] T. Perez, “Multinational Enterprises and Technological Spillovers,” Hardwood, Amsterdam, 1998. http://dx.doi.org/10.4324/9780203362914 [2] M. Carkovic and R. Levine, “Does Foreign Direct In- vestment Accelerate Economic Growth?” Working Paper, University of Minnesota Department of Finance, 2002. [3] H. Görg and D. Greenaway, “Much Ado about Nothing? Do Domestic Firms Really Benefit from Foreign Direct Investment,” Discussion Paper No. 944, Institute for the Study of Labor, 2003. [4] J. A. Gurría, “Flujos de Capital: El Caso de México,” Serie Financiamiento del Desarrollo CEPAL, No. 27, 1994. [5] V. N. Balasubramanyam, M. Salisu and D. Sapsford, “Foreign Direct Investment and Growth in EP and IS Countries,” The Economic Journal, Vol. 106, No. 434, 1996, pp. 92-105. http://dx.doi.org/10.2307/2234933 [6] M. Blomström, S. Globerman and A. Kokko, “The De- terminants of Host Country Spillovers from Foreign Di- rect Investment: Review and Synthesis of the Literature,” In: N. Pain, Ed., Inward Investment, Technological Chan- ge and Growth, Palgrave, London, 2001, pp. 34-66. [7] M. Blomström and A. Kokko, “How Foreign Direct In- vestment Affects Host Countries,” World Bank Working Paper No. 1745, 1997. [8] F. Reganati and E. Sica, “Horizontal and Vertical Spill- overs from FDI: Evidence from Panel Data for the Italian Manufacturing Sector,” Journal of Business Economics and Management, Vol. 8, No. 4, 2007, pp. 259-266. [9] S. Lall, “Vertical Inter-firm Linkages in LDCs: An Em- pirical Study,” Oxford Bulletin of Economics & Statistics, Vol. 80, No. 3, 1980, pp. 203-226. [10] B. Javorcik, “Can Survey Evidence Shed Light on Spill- overs from Foreign Direct Investment?” The World Bank Research Observer, Vol. 23, No. 2, 2008, pp. 139-159. http://dx.doi.org/10.1093/wbro/lkn006 [11] A. Rodríguez-Clare, “Multinationals, Linkages and Eco- nomic Development,” The American Economic Review, Vol. 86, No. 4, 1996, pp. 852-873. [12] G. Hanson, R. Mataloni and M. Slaughter, “Vertical Pro- duction Networks in Multinational Firms,” The Review of Economics and Statistics, Vol. 87, No. 4, 2005, pp. 664- 678. http://dx.doi.org/10.1162/003465305775098080 [13] W. Chung, W. Mitchell and B. Yeung, “Foreign Direct Investment and Host Country Productivity: The American Automotive Component Industry in the 1980s,” Journal of International Business Studies, Vol. 34, No. 2, 2003, pp. 199-218. http://dx.doi.org/10.1057/palgrave.jibs.8400017 [14] X. Martin, W. Mitchell and A. Swaminathan, “Recreating and Extending Japanese Automobile Buyer-Supplier Links in North America,” Strategic Management Journal, Vol. 16, No. 8, 1995, pp. 589-619. http://dx.doi.org/10.1002/smj.4250160803 [15] K. Kojima, “Japanese Direct Foreign Investment, A Model of Multinational Business Operations,” Charles E. 17The Keiretsu represents a group of companies with interlocking busi- ness relations and shareholdings. Open Access TI  L. GUZMAN Open Access TI 243 Tuttle Company, Tokyo, 1978. [16] R. E. Caves, “Multinational Firms, Competition and Pro- ductivity in Host-Country Markets,” Macmillan, London, 1974. [17] G. Blalock, “Technology from Foreign Direct Investment: Strategic Transfer through Supply Chains,” Ph.D. Disser- tation, Haas School of Business, University of California, Berkley, 2001. [18] G. Blalock and P. J. Gertler, “Welfare Gains from For- eign Direct Investment through Technology Transfer to Local Suppliers,” Journal of International Economics, Vol. 74, No. 2, 2008, pp. 402-421. http://dx.doi.org/10.1016/j.jinteco.2007.05.011 [19] K. Schoors and B. van der Tol, “Foreign Direct Invest- ment Spillovers within and between Sectors,” Working Paper No. 157, Department of Economics, Ghent Univer- sity, Belgium, 2002. [20] B. Javorcik, “Does Foreign Direct Investment Increase the Productivity of Local Firms? In Search of Spillovers through Backward Linkages,” American Economic Re- view, Vol. 94, No. 3, 2004, pp. 605-627. http://dx.doi.org/10.1257/0002828041464605 [21] B. Javorcik, K. Saggi and M. Spatareanu, “Does It Matter Where You Come From? Vertical Spillovers from For- eign Direct Investment and the Nationality of Investors,” World Bank Policy Research Working Paper No. 3449, 2004. [22] Z. Liu and P. Lin, “Backward Linkages of Foreign Direct Investment,” 2004. http://www.docin.com/p-98810674.html [23] L. Du, A. Harrison and G. H. Jefferson, “Testing for Horizontal and Vertical Foreign Investment Spillovers in China, 1998-2007,” Journal of Asian Economics, Vol. 23, No. 3, 2012, pp. 234-243. http://dx.doi.org/10.1016/j.asieco.2011.01.001 [24] S. Bwalya, “Foreign Direct Investment and Technology Spillovers: Evidence from Panel Data Analysis of Manu- facturing Firms in Zambia,” Journal of Development Eco- nomics, Vol. 81, No. 2, 2006, pp. 514-526. http://dx.doi.org/10.1016/j.jdeveco.2005.06.011 [25] L. Jabbour and J. L. Mucchielli, “Technology Transfer through Vertical Linkages: The Case of the Spanish Man- ufacturing Industry,” Journal of Applied Economics, Vol. 10, No. 1, 2007, pp. 115-136. [26] R. López and J. Südekum, “Vertical Industry Relations, Spillovers, and Productivity: Evidence from Chilean Plants,” Journal of Regional Science, Vol. 49, No. 2, 2009, pp. 721-747. http://dx.doi.org/10.1111/j.1467-9787.2009.00631.x [27] C. Iyer, “Foreign Firms and Inter-Industry Spillovers in Indian Manufacturing: Evidence from 1989 to 2004,” The Journal of Applied Economic Research, Vol. 3, No. 3, 2009, pp. 297-317. [28] E. López-Córdoba, “NAFTA and Manufacturing Produc- tivity in Mexico,” Economía, Vol. 4, No. 1, 2003, pp. 55-98. http://dx.doi.org/10.1353/eco.2004.0007 [29] J. A. Jordaan, “Intra- and Inter-Industry Externalities from Foreign Direct Investment in the Mexican Manu- facturing Sector: New Evidence from Mexican Regions,” World Development, Vol. 36, No. 12, 2008, pp. 2838- 2854. http://dx.doi.org/10.1016/j.worlddev.2008.02.006 [30] K. Yudaeva, K. Kozlov, N. Melentieva and N. Ponoma- reva, “Does Foreign Ownership Matter? The Russian Experience,” Economics of Transition, Vol. 11, No. 3, 2003, pp. 383-409. http://dx.doi.org/10.1111/1468-0351.00157 [31] J. Stancik, “Horizontal and Vertical FDI Spillovers: Re- cent Evidence from the Czech Republic,” CERGE-EI Working Paper Series No. 340, 2007. [32] P. Vacek, “Panel Data Evidence on Productivity Spill- overs from Foreign Direct Investment: Firm-Level Meas- ures of Backward and Forward Linkages,” IES Working Paper No. 19, 2010. [33] M. Kugler, “Externalities from Foreign Direct Investment: The Sectoral Pattern of Spillovers and Linkages,” Uni- versity of Southampton, Mimeo, 2001. [34] S. Rosenthal and W. Strange, “Evidence of the Nature and Sources of Agglomeration Economies,” In: V. J. Henderson and J. F. Thisse, Eds., Handbook of Urban and Regional Economics, Vol. 4, North Holland, Am- sterdam, 2004. [35] S. Girma and K. Wakelin, “Regional Underdevelopment: Is FDI the Solution? A Semi-Parametric Analysis,” Dis- cussion Paper No. 2995, Centre for Economic Policy Re- search, 2001. [36] R. Banga, “Do Productivity Spillovers from Japanese and US FDI Differ,” In: R. Jha, Ed., Indian Economic Reform, Palgrave McMillan, New York, 2003, pp. 256-273. [37] A. Lemi, “Foreign Direct Investment, Host Country Pro- ductivity and Export: The Case of US and Japanese Mul- tinational Affiliates,” Journal of Economic Development, Vol. 29, No. 1, 2004, pp. 163-186. [38] J. Levinsohn and A. Petrin, “Estimating Production Func- tions Using Inputs to Control for Unobservables,” Review of Economic Studies, Vol. 70, No. 2, 2003, pp. 317-342. http://dx.doi.org/10.1111/1467-937X.00246 [39] S. Olley and A. Pakes, “The Dynamics of Productivity in the Telecommunications Equipment Industry,” Econome- trica, Vol. 64, No. 6, 1996, pp. 1263-1297. http://dx.doi.org/10.2307/2171831
|