Energy and Power Engineering, 2013, 5, 570-574
doi:10.4236/epe.2013.54B109 Published Online July 2013 (http://www.scirp.org/journal/epe)
Design of Power Supply for On-line Monitoring
System of Transmission Lines
Kai Chen1, Zi-jian Zhao1, Yu-ning Zhang1, Yang-chun Cheng1, Yuan Dai2
1State Key Laboratory of Alternate Electrical Power System with Renewable Energy Sources,
Beijing Key Laboratory of High Voltage and EMC, North China Electric Power University, Beijing, China
2Guangdong Power Test & Research Institution, Guangzhou, Guangdong Province, China
Email: 570940746@qq.com
Received March, 2013
ABSTRACT
This paper uses CT to gain the energy directly from the high-voltage transmission line, to address the problem of power
supply for monitoring system in high voltage side of transmission line. The draw-out power coil can induce voltage
from the transmission line, using single-chip microcomputer to analog and output PMW wave to control the charging
module, provides a stable 3.4 V DC voltage to the load, and solve the problem of easy saturating of core. The power
supply based on this kind of draw-out power coil has undergone the overall testing, and it is verified-showing that it can
properly work in a non-saturated status within the current range of 50 - 1000 A, and provide a stable output. The
equipment also design protection circuit to improve the reliability to avid the impacts of the impulse current or
short-circuit current. It effectively solves the problem of power supply for On-line Monitoring System of Transmission.
Keywords: Monitoring System; Power Supply of High-voltage Transmission Line; Draw-out Power Coil; Single-chip
Microcomputer
1. Introduction
The monitoring devices need to be installed directly in
the transmission lines, so how to provide electrical power
for the devices is one of the key issues we need to re-
solve. The power supply of study has important practical
value. Now the most widely used method is the solar
energy [1], but this method is susceptible to affected by
climatic conditions, and lack of long-term mainte-
nance-free capacity. The laser energy has been applied in
the electronic current transformers and active optical
current transformer [2, 3], but such power is not suitable
for work in the field. Using the capacitive bleeder is the
use of a capacitor to obtain energy from the high-voltage
transmission, but the stability and reliability of this me-
thod is poor, and the power of the method is limited [4].
The best way of power supply is using CT to take energy
directly from the transmission lines. In this paper, a new
power supply used in high-voltage buses is designed and
verified by experiments.
2. Basic Schematic of CT Inductive Power
The basic schematic of the power supply is shown in
Figure 1.
The basic principle of Using CT to obtain energy is
based on the Faraday's law of electromagnetic induction.
Within the current range of 50 - 1000 A, using CT to
induce from the high-voltage transmission, then after
rectifying, voltage reduction, it can finally output stable
3.4V-DC voltage for on-line monitoring equipment.
3. Basic Principle of CT Inductive Power
3.1. The Theoretical Analysis of Draw-out Coil
The draw-out coil works like a transformer, its no-load
equivalent model is shown in Figure 2.
Figure 1. The basic schematic of the pow er supply.
Copyright © 2013 SciRes. EPE
K. CHEN ET AL. 571
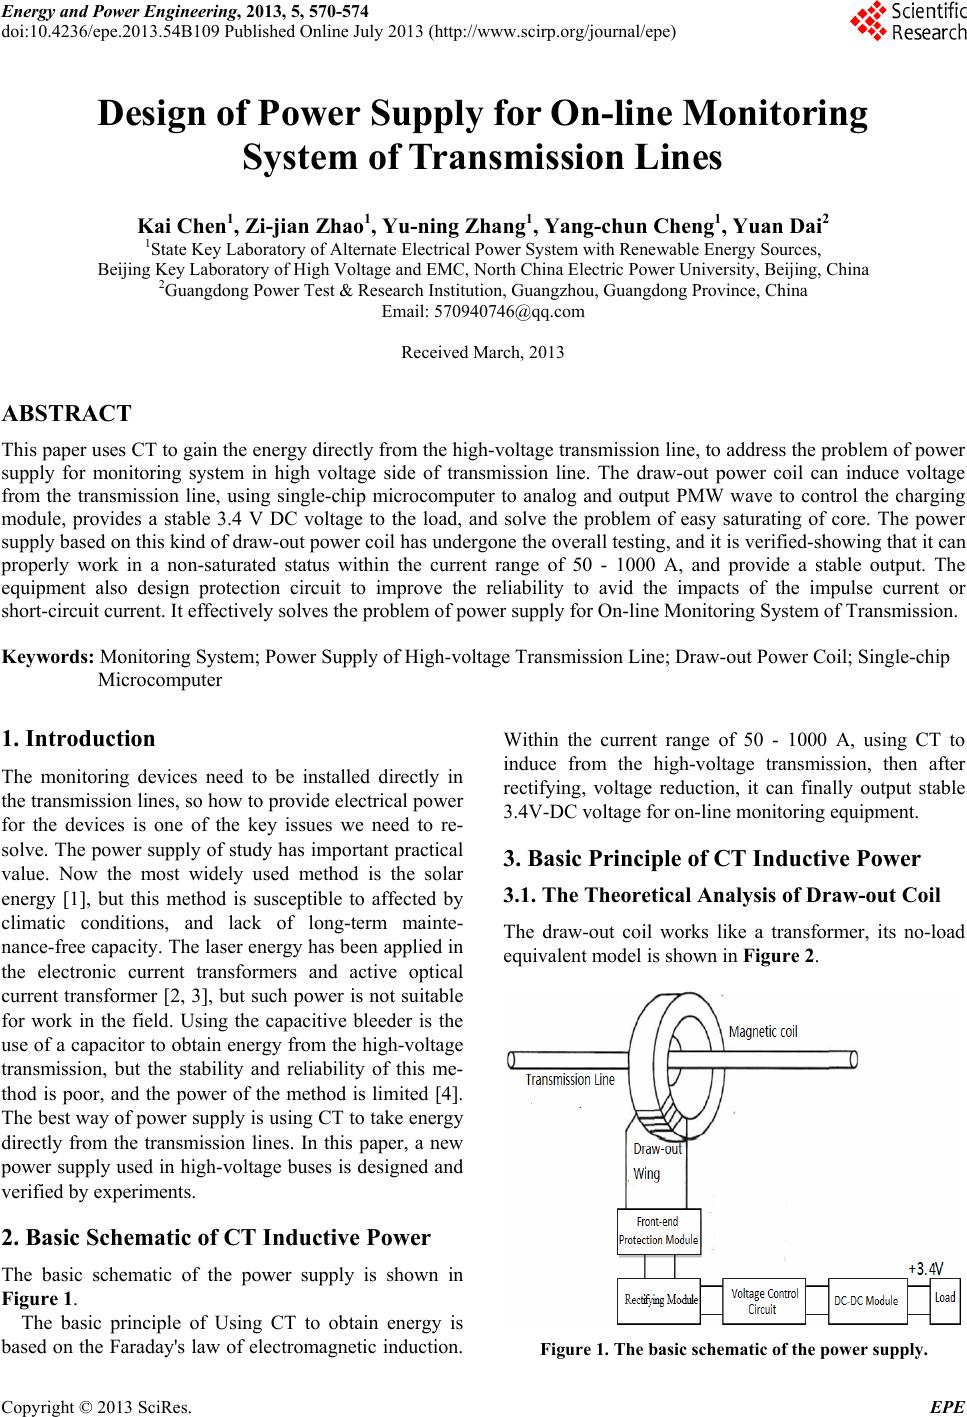
Figure 2. No-load equivalent model of draw-out coil.
According to the knowledge of the electromagnetic
theory [5,6], the secondary voltage valid value is:
22 2
UE4.44N
m
f  (1)
where E2 is the magnetic induction electromotive force
RMS; f is the power frequency; N2 is the secondary-side
winding turns; Φm is the magnetic flux amplitude, the
flux amplitude is:
BS
mm
k (2)
where Bm is saturation magnetic induction; k is laminated
coefficient.
According to Ampere's circuital law:
11
H2N
mlI
H
m
(3)
where S is the cross-sectional area of the core; I is the
average magnetic path length; I1 is the exciting current;
N is the primary winding turns, which takes one. The
relation of magnetic induction peak and magnetic field
strength peak is:
0
B
mr
(4)
where 0
is the vacuum permeability; r
is the rela-
tive permeability of magnetic core; Hm is the peak of the
magnetic field strength. By the formulas (1)-(4) can be
known:
0
22 2
2S
4.44 N4.44 NI
r
m
k
Eff l

 m
(5)
Form equation (5) we can be known that secondary-
side output voltage of the coil is related to the primary
side of the excitation current Im, and has no relation with
the secondary-side current.
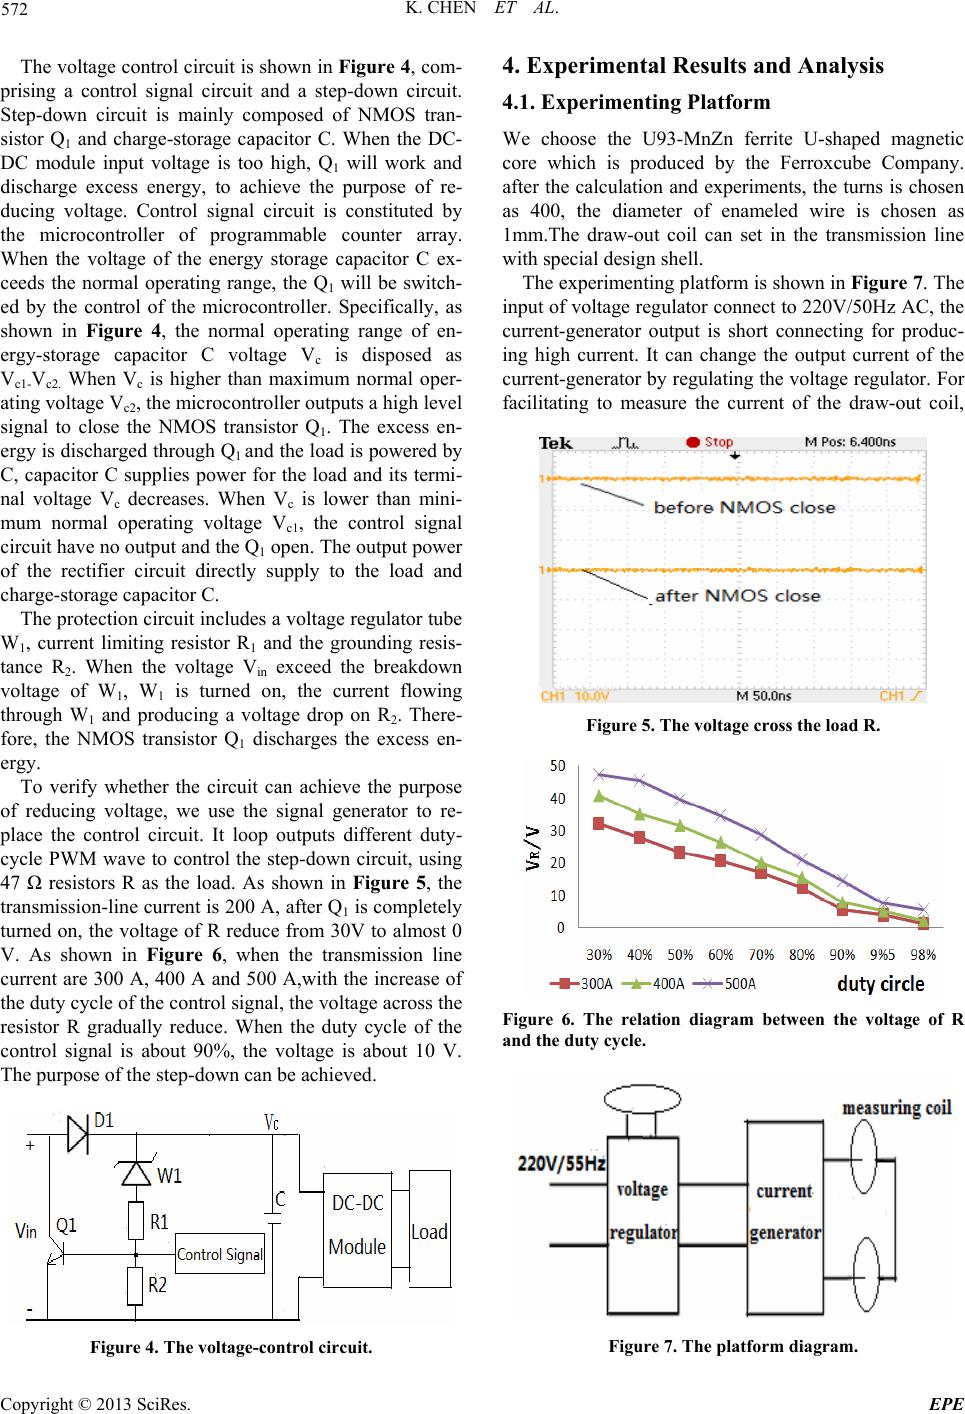
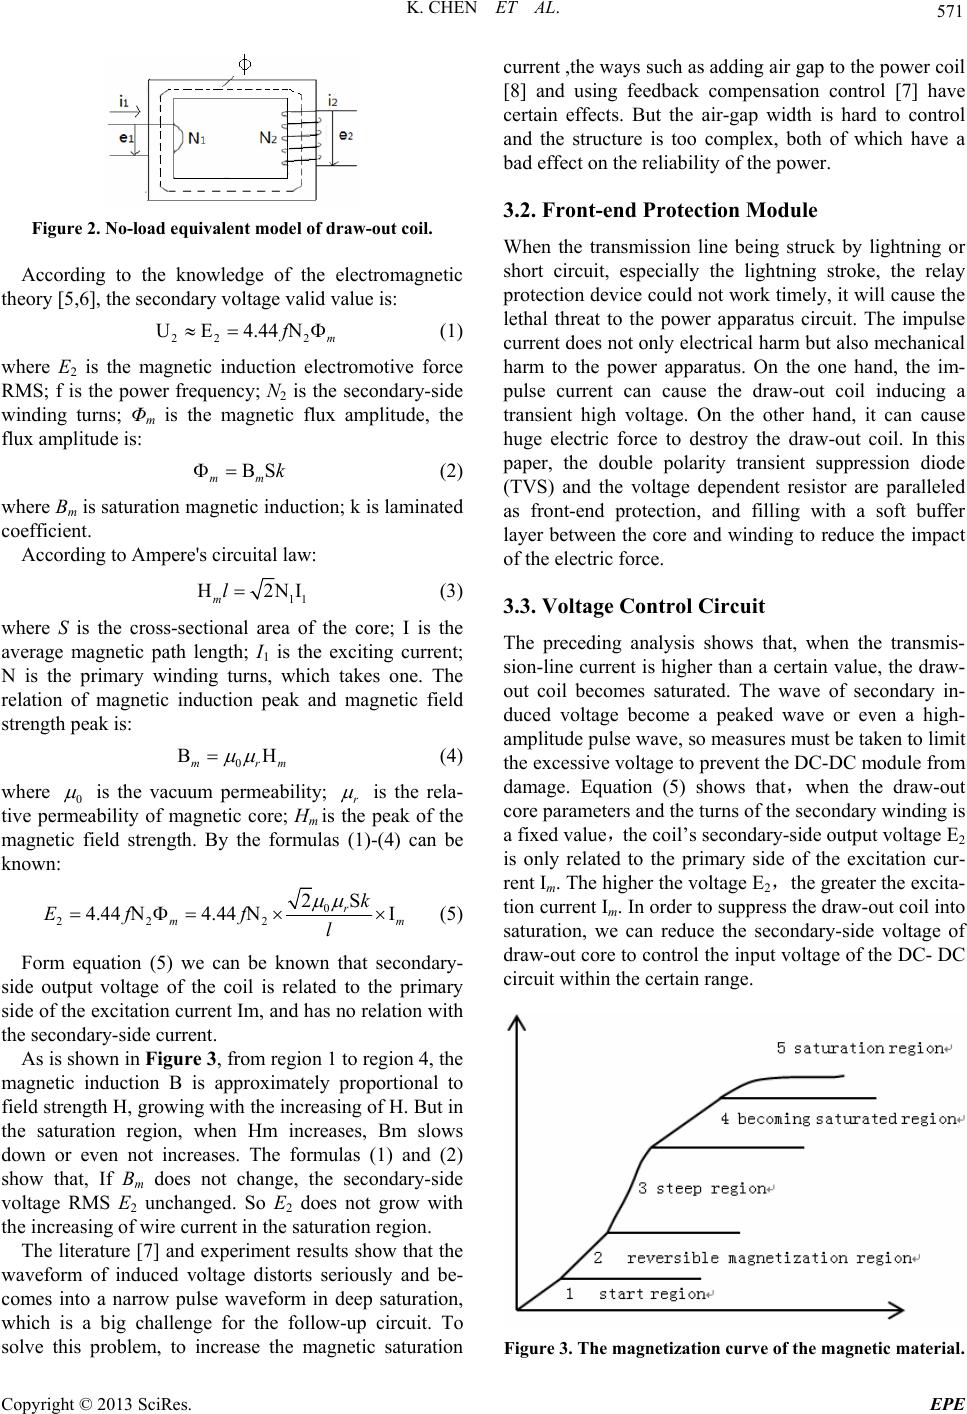
As is shown in Figure 3, from region 1 to region 4, the
magnetic induction B is approximately proportional to
field strength H, growing with the increasing of H. But in
the saturation region, when Hm increases, Bm slows
down or even not increases. The formulas (1) and (2)
show that, If Bm does not change, the secondary-side
voltage RMS E2 unchanged. So E2 does not grow with
the increasing of wire current in the saturation region.
The literature [7] and experiment results show that the
waveform of induced voltage distorts seriously and be-
comes into a narrow pulse waveform in deep saturation,
which is a big challenge for the follow-up circuit. To
solve this problem, to increase the magnetic saturation
current ,the ways such as adding air gap to the power coil
[8] and using feedback compensation control [7] have
certain effects. But the air-gap width is hard to control
and the structure is too complex, both of which have a
bad effect on the reliability of the power.
3.2. Front-end Protection Module
When the transmission line being struck by lightning or
short circuit, especially the lightning stroke, the relay
protection device could not work timely, it will cause the
lethal threat to the power apparatus circuit. The impulse
current does not only electrical harm but also mechanical
harm to the power apparatus. On the one hand, the im-
pulse current can cause the draw-out coil inducing a
transient high voltage. On the other hand, it can cause
huge electric force to destroy the draw-out coil. In this
paper, the double polarity transient suppression diode
(TVS) and the voltage dependent resistor are paralleled
as front-end protection, and filling with a soft buffer
layer between the core and winding to reduce the impact
of the electric force.
3.3. Voltage Control Circuit
The preceding analysis shows that, when the transmis-
sion-line current is higher than a certain value, the draw-
out coil becomes saturated. The wave of secondary in-
duced voltage become a peaked wave or even a high-
amplitude pulse wave, so measures must be taken to limit
the excessive voltage to prevent the DC-DC module from
damage. Equation (5) shows thatwhen the draw-out
core parameters and the turns of the secondary winding is
a fixed valuethe coil’s secondary-side output voltage E2
is only related to the primary side of the excitation cur-
rent Im. The higher the voltage E2the greater the excita-
tion current Im. In order to suppress the draw-out coil into
saturation, we can reduce the secondary-side voltage of
draw-out core to control the input voltage of the DC- DC
circuit within the certain range.
Figure 3. The magnetization curve of the magnetic material.
Copyright © 2013 SciRes. EPE
K. CHEN ET AL.
572
The voltage control circuit is shown in Figure 4, com-
prising a control signal circuit and a step-down circuit.
Step-down circuit is mainly composed of NMOS tran-
sistor Q1 and charge-storage capacitor C. When the DC-
DC module input voltage is too high, Q1 will work and
discharge excess energy, to achieve the purpose of re-
ducing voltage. Control signal circuit is constituted by
the microcontroller of programmable counter array.
When the voltage of the energy storage capacitor C ex-
ceeds the normal operating range, the Q1 will be switch-
ed by the control of the microcontroller. Specifically, as
shown in Figure 4, the normal operating range of en-
ergy-storage capacitor C voltage Vc is disposed as
Vc1-Vc2. When Vc is higher than maximum normal oper-
ating voltage Vc2, the microcontroller outputs a high level
signal to close the NMOS transistor Q1. The excess en-
ergy is discharged through Q1 and the load is powered by
C, capacitor C supplies power for the load and its termi-
nal voltage Vc decreases. When Vc is lower than mini-
mum normal operating voltage Vc1, the control signal
circuit have no output and the Q1 open. The output power
of the rectifier circuit directly supply to the load and
charge-storage capacitor C.
The protection circuit includes a voltage regulator tube
W1, current limiting resistor R1 and the grounding resis-
tance R2. When the voltage Vin exceed the breakdown
voltage of W1, W1 is turned on, the current flowing
through W1 and producing a voltage drop on R2. There-
fore, the NMOS transistor Q1 discharges the excess en-
ergy.
To verify whether the circuit can achieve the purpose
of reducing voltage, we use the signal generator to re-
place the control circuit. It loop outputs different duty-
cycle PWM wave to control the step-down circuit, using
47 resistors R as the load. As shown in Figure 5, the
transmission-line current is 200 A, after Q1 is completely
turned on, the voltage of R reduce from 30V to almost 0
V. As shown in Figure 6, when the transmission line
current are 300 A, 400 A and 500 A,with the increase of
the duty cycle of the control signal, the voltage across the
resistor R gradually reduce. When the duty cycle of the
control signal is about 90%, the voltage is about 10 V.
The purpose of the step-down can be achieved.
Figure 4. The voltage-control circuit.
4. Experimental Results and Analysis
4.1. Experimenting Platform
We choose the U93-MnZn ferrite U-shaped magnetic
core which is produced by the Ferroxcube Company.
after the calculation and experiments, the turns is chosen
as 400, the diameter of enameled wire is chosen as
1mm.The draw-out coil can set in the transmission line
with special design shell.
The experimenting platform is shown in Figure 7. The
input of voltage regulator connect to 220V/50Hz AC, the
current-generator output is short connecting for produc-
ing high current. It can change the output current of the
current-generator by regulating the voltage regulator. For
facilitating to measure the current of the draw-out coil,
Figure 5. The voltage cross the load R.
Figure 6. The relation diagram between the voltage of R
and the duty cycle.
Figure 7. The platform diagram.
Copyright © 2013 SciRes. EPE
K. CHEN ET AL. 573
the high-accuracy current transformer is used to detect
the current.
4.2. Testing Result and Analysis
When in start current 50 A, we need to test weather
draw- out coil can provide enough power. We Use a
variable resistor to simulate the changing load to test the
coil output power. Experiments show that the coil output
is related to the load. As is shown in Figure 8,with the
current-generator output current I1=50 A, when the load
resister R is 150 , the coil output power P2 reach the
maximum, as high as 653 mW. It can supply sufficient
power for the load.
The design requirements of the draw-out power are
that the starting current is 50 A, it can provide more than
500mW power the load (the normal operating power of
the transmission line monitoring device with a GPS
module is about 500 mW) and it can work stably within
the range of 50 A to 1000 A of the transmission-line cur-
rent.
Using 47 resistors R as load, the power apparatus
based on the above parameters is tested in the experi-
ments. Form Figure 9, we can find that the maximum
voltage of storage-capacitor C is 12.0 V, minimum volt-
age is 9.0V. When the NMOS transistor Q1 close, the
energy-charge capacitor C directly supply energy for
load and its terminal voltage Vc decrease. When Q1 open,
the output power of the rectifier circuit directly supply to
the load and charge capacitor C, the voltage Vc of C will
increase. In Table 1, Vmax is the maximum input voltage
of DC-DC, Vmin is the minimum voltage of DC-DC, Vout
is the output voltage.
After the voltage-control circuit, DC-DC module input
is 9.0 - 12.0 V and out a 3.4 V voltage within the range
of 50 A to 1000 A bus current. With bus current 300A
the power apparatus continue working 300 minutes, the
ripple wave within 300 minutes of DC-DC output volt-
age Vout is shown in Figure10. After the DC-DC module,
the power apparatus can provide a stable 3.4 V voltage.
Figure 8. The relationship curve between the output power
and the load.
Figure 9. The voltage cross energy-shortage capacitor C.
Table 1. The output and input voltage of the DC-DC circuit.
Tramission-line current Vmax /V Vmin /V V
out /V
50A 12.2V 8.8V 3.39V
100A 12.0V 9.0V 3.41V
200A 12.3V 9,1V 3.40V
400A 12.0V 9.1V 3.42V
600A 12.1V 8.9V 3.39V
800A 11.9V 9.0V 3.38V
1000A 12.0V 9.1V 3.40V
Figure 10. The ripple wave within 300 minutes of DC-DC
output voltage.
5. Conclusions
In this paper, we study the issue about the power for the
high-voltage on-line monitoring device. The analysis
shows that using CT to induce energy is a low-cost, prac-
tical and viable way.
To save the problems of easily saturating and high-
power consumption of the exiting power supply, the pa-
per introduces a new design of the high-voltage-side in-
duces power apparatus. A large number of experiments
show that, the power apparatus of the paper can prevent
the magnetic core from saturating in high current, stead-
ily work in non-saturated and low-power consumption
status within the range of 50 A to 1000 A transmis-
sion-line current.
Copyright © 2013 SciRes. EPE
K. CHEN ET AL.
Copyright © 2013 SciRes. EPE
574
REFERENCES
[1] S. B. Jiao, D. Liu, G. Zheng, et al., “On Line Insulator
Contamination Monitoring System for Transmission
Lines Based on Telemetry,” Automation of Electric
Power Systems, Vol. 28, No. 15, 2004, pp. 71-75.
[2] T. C. Banwell, R. C. Estes and L. A, Reith, et al., “Pow-
ering the Fiber Loop Optically-a Cost Analysis,” Journal
of Light Wave Technology, Vol. 11, No. 3, 1993, pp.
481-494. doi:10.1109/50.219583
[3] J. Song, P. G. Mclaren, D. J. Thomson, et al., “A Proto-
type Clamp-on Magneto-optical Current Transducer for
Power System Metering and Relaying,” IEEE Trans on
Power Delivery, Vol. 10, No. 4, 1995, pp. 1764-1770.
doi:10.1109/61.473382
[4] Z. Qian, “Power Supply for High Voltage Circuit of Ac-
tive Electronic Current Transformer,” High Voltage Ap-
paratus, Vol. 40, No. 2, 2004, pp. 135-138.
[5] G.-Y. Qiu, Circuit, Beijing: Higher Education Press,
1999.
[6] Y-M Tang and N. Shi, “Electromechanics,” Beijing:
China Machine Press, 2002.
[7] L. Fu, “Research on Power Supply of Hybrid Fiber Cur-
rent Transducer,” Qinhuangdao: Yanshan University,
2004.
[8] Z. Wang, F. Zong, F. Wang, et al., Development of
Power Supply in High Voltage Side of Transmission
Lines,” Power System and Clean Energy, Vol. 26, No. 6,
2010, pp. 24-27.