Advances in Chemical Engineering and Science, 2013, 3, 1-6
doi:10.4236/aces.2013.34B001 Published Online October 2013 (http://www.scirp.org/journal/aces)
Effect of Copper (II) Ions on Quality of Struvite Produced
in Continuous Reaction Crystallization Process at the
Magnesium Ions Excess
Nina Hutnik1, Boguslawa Wierzbowska1, Krzysztof Piotrowski2*, Andrzej Matynia1
1Wroclaw University of Technology, Faculty of Chemistry, Wybrzeze Wyspianskiego, Wroclaw, Poland
2Silesian University of Technology, Department of Chemical & Process Engineering, M. Strzody, Gliwice, Poland
Email: *krzysztof.piotrowski@polsl.pl
Received May, 2013
ABSTRACT
The research results concerning continuous removal of phosphate (V) ions from solutions containing 1.0 or 0.20 mass
% of phosphate (V) ions and 0.2 or 0.5 mg/kg of copper (II) ions using magnesium and ammonium ions addition are
presented. Continuous reaction crystallization of struvite MgNH4PO4 × 6H2O ran both under stoichiometric conditions
and at 20% excess of magnesium ions (pH 9, 900 s). It was concluded, that presence of copper (II) ions in a process
system influenced product quality moderately advantageously. Mean size of struvite crystals enlarged by ca. 6% only.
Lower concentration of phosphate (V) ions and excess of magnesium ions caused, that products of ca. 9% - 13% larger
crystal mean size (up to ca. 40 m) were removed from the crystallizer. Presence of struvite crystals and copper (II)
hydroxide were detected analytically in the products (Cu in a product varied from 6 to 90 mg/kg). Presence of copper (II)
ions favored crystallization of struvite in the form of tubular crystals.
Keywords: Struvite; Phosphate(V) Ions; Copper Ions; Continuous Reaction Crystallization; DT MSMPR Crystallizer;
Crystal Size Distribution; Product Quality
1. Introduction
Recovery of phosphate(V) ions from wastewaters (called
phosphorus recycling [1]) is based on precipitation fol-
lowed by mass crystallization of sparingly soluble phos-
phate salts, the most often magnesium ammonium phos-
phate(V) hexahydrate, MgNH4PO4 × 6H2O, struvite
(solubility product pKsp 9.0 - 13.26) [2]. The substrates
used in this process are usually crystalline magnesium
and ammonium salts or waste solutions containing mag-
nesium or/and ammonium ions in sufficiently large con-
centrations. Yield and quality of manufactured product
depend mainly on chemical composition of wastewater,
pH and the assumed technological and equipment solu-
tions [2-7]. Essential factor influencing course and re-
sults of struvite reaction crystallization process is com-
position of impurities present in wastewater [2,8]. Even
small amount of impurity can inhibit or catalyze struvite
precipitation reaction, influence nucleation rate and
crystal growth rate, crystals shape and their eventual ag-
glomeration [9-12]. Some metal ions in alkaline envi-
ronment of struvite reaction crystallization process can
form sparingly soluble hydroxides or phosphates, what
essentially modifies chemical composition of the product
and often limits the possibilities of its further application
in agriculture [13].
One of impurities present e.g. in liquid manure or in
wastewaters from mineral fertilizer industry are copper(II)
ions [14]. The research results concerning influence of three
process parameters: molar ratio of substrates (stoichiomet-
ric conditions or 20% excess of magnesium ions in rela-
tion to concentrations of phosphate(V) and ammonium
ions), concentration of phosphate(V) ions (1.0 or 0.20
mass %) and concentration of copper(II) ions (0.2 or 0.5
mg/kg) in solution feeding the continuous DT MSMPR
(Draft Tube, Mixed Suspension Mixed Product Removal
[15]) type crystallizer on struvite product quality are
presented in this work. The research tests ran at pH 9 for
constant mean residence time of struvite crystal suspend-
sion in the crystallizer 900 s. Process yield defined as
final concentration of PO4
3– ions in a postprocessed
mother solution was determined. Product crystal size
distributions and their statistical parameters (Lm, L50, Ld,
CV) were calculated. Crystals shape (La/Lb) and their
agglomeration effects were estimated. Copper content in
a product was determined analytically.
*Corresponding author.
Copyright © 2013 SciRes. ACES
N. HUTNIK ET AL.
2
2. Material and Methods
Scheme of laboratory plant for the tests of struvite con-
tinuous reaction crystallization process in copper (II) ions
presence is shown in Figure 1. Steering, control and ac-
quisition of measurement data streams were carried out
with the use of PC computer. For precise control of ex-
perimental plant operated in steady-state mode IKA lab-
worldsoft program was used. Working volume of the
crystallizer was 0.6 dm3. Crystallizer was a glass cylin-
drical tank (D 120 mm, H 123 mm), in a bottom part
equipped with external heating/cooling coil (thermo-
stated with water circulation system), providing isother-
mal process conditions. In central axis of the apparatus
cylindrical circulation profile (Draft Tube, DT, ddt 57
mm, hdt 53 mm) was placed, inside which three-paddle
propeller mixer (dm 55 mm) operated. Inlet ports of re-
acting substances, alkalising solution and removal port of
product crystal suspension are indicated in Figure 1.
Crystallizer was continuously provided with feed solu-
tion prepared earlier in a mixer device using chemically
pure substances (magnesium chloride MgCl2 × 6H2O,
ammonium dihydrogenphosphate(V) NH4H2PO4 and
copper (II) chloride CuCl2×2H2O (p.a. POCh Gliwice,
Poland) and deionised water (Barnstead – NANOpure
DIamond). The solution was introduced into circulation
profile (mixer speed: 6.6 ± 0.11/s; suspension movement
– downward). Between crystallizer body and DT element
(suspension movement – upward) aqueous solution of
sodium hydroxide of concentration 20 mass % NaOH
was dosed in proportions providing the assumed, con-
trolled value of pH. Temperature in a crystallizer was
298 ± 0.2 K. Research tests ran under stoichiometric con-
ditions (molar proportions between the substrates [PO4
3–]RM :
[Mg2+]RM : [NH4
+]RM = 1 : 1 : 1) and at 20% excess of
magnesium ions ([PO4
3–]RM : [Mg2+]RM : [NH4
+]RM = 1 :
1.2 : 1). Concentration of phosphate (V) ions in a feed
was 1.0 or 0.20 mass %. Corresponding concentration of
magnesium ions was thus: 0.256 or 0.0512 mass % – in
stoichiometric conditions, and 0.307 or 0.061 mass % –
at their 20% excess. Concentration of ammonium ions
was: 0.190 or 0.0380 mass %, appropriately, while con-
centration of copper ions was 0.2 or 0.5 mg/kg. Con-
tinuous reaction crystallization of struvite ran at pH 9
(±0.1) for mean residence time of suspension in a crys-
tallizer 900 s (± 20 s). After establishing in the crystal-
lizer the required parameter values, process in steady
state ran through the next 5. After this time whole crys-
tallizer content was transferred to vacuum filter. Product
crystals were not washed. Using adequate analytical
methods for each test run there were determined: solid
phase content in product crystal suspension (MT), chemical
composition of mother liquor and solid phase (plasma
emission spectrometer ICP–AES CPU 7000, spectrome-
ter IR PU9712, atomic absorption spectrometer iCE 3000,
spectrophotometer UV–Vis Evolution 300), product
crystal size distribution (solid particle laser analyser
Coulter LS–230) and crystals shape (scanning electron
microscope JEOL JSM 5800LV). Accuracy of process
data determination in the continuous laboratory plant was
estimated to be ca. 10%.
M
T
Product
NaOH
solution
pH
3
11
6
5
7
1
2
9
8
10
4
12
Feed
solution
Figure 1. Laboratory test stand scheme of continuous crystallizer with a propeller stirrer for reaction crystallization of stru-
vite, 1 – DT MSMPR type crystallizer with internal circulation of suspension, 2 – thermostat, 3 – computer, 4 – reservoir of
feed mixture: aqueous solution of NH4H2PO4, MgCl2 and CuCl2, 5 – feed proportioner (pump), 6 – alkalinity agent tank:
aqueous solution of NaOH, 7 – proportioner of NaOH solution, 8 – receiver (pump) of a product crystal suspension from the
crystallizer tank, 9 – storage tank of product crystal suspension, 10, 11, 12 – electronic balances, M – stirrer speed con-
trol/adjustment, pH – alkaline/acid reaction control/adjustment, T – temperature control/adjustment.
Copyright © 2013 SciRes. ACES
N. HUTNIK ET AL. 3
3. Results and Discussion
The research and analytical test results are presented in
Table 1. From the table it results, that increase in con-
centration of copper(II) ions in a feed influenced product
crystal size distribution moderately advantageously. For
example, under stoichiometric conditions, for [PO4
3–]RM
1.0 mass %, mean product crystal size Lm increased from
27.5 to 29.3 m (by ca. 6%), while median crystal size
L50 from 19.4 to 22.4 m [14]. Growth Lm with the in-
crease in copper(II) ions concentration in a process sys-
tem is connected with general decrease of the smallest
struvite crystals amount in a population of solid product.
For [Cu2+]RM 0.2 mg/kg crystal fraction of sizes below 5
m in a product was 15.7%, whereas for [Cu2+]RM 0.5
mg/kg this fraction decreased to 13.0%, thus shrank by
ca. 17%. The largest struvite crystal size did not, how-
ever, varied (ca. 140 m), whereas dominant crystal size
(Ld, corresponding to maximum in differential distribu-
tion), even slightly decreased (Ld 25.5 24.8 m). In
Figure 2(a) exemplary volumetric (mass) size distribution
of struvite crystals produced in presence of 0.5 mg/kg of
copper(II) ions in a feed ([PO4
3–]RM 1.0 mass %, pH 9,
900 s) is presented. In Figure 3(a) there was presented
scanning electron microscope image of product sample,
which crystal size distribution was presented in Figure
2(a). Detailed data concerning influence of copper(II)
ions concentration ((1–10)×10–5 mass %) and techno-
logical parameters (pH 9–11, 900–3600 s) of struvite
continuous reaction crystallization process from solutions
containing 1.0 mass % of PO4
3– ions under stoichiometric
conditions are presented in [14]. Influence of these pa-
rameters on mean size Lm (m) of product struvite crys-
tals was elaborated in a form of empirical correlation
[14]:
Lm = 6.748×10² [Cu2+]RM
0.052 pH–1.956 0.243 (1)
Five time decrease of phosphate(V) ions concentration
in a crystallizer feed (from 1.0 to 0.20 mass %) resulted
in increase in mean struvite crystal size Lm by 9-13% (No.
3 and 4 in Table 1). Solution supersaturation at the crys-
tallizer inlet decreased. Thus struvite nucleation rate,
strongly dependent on supersaturation is decreased, as
well. It resulted in decrease of nuclei amount, thus larger
size of crystals removed from the crystallizer (compare
Figures 2(a) and (b), as well as Figures 3( a ) and (b)).
From the comparison of Figures 2(a) and (b) it results,
that feeding the crystallizer with solution of concentra-
tion 0.20 mass % phosphate(V) ions both number and
size of the largest struvite crystals increased. The largest
size of struvite particles produced at [PO4
3–]RM 0.20 mass
% was 210 m (Figure 2(b)), whereas at [PO4
3–]RM 1.0
mass % it was 140 m only (Figure 2(a)). Fraction of
the smallest size particles in a product did not, however,
decrease. In results mean size of product crystals in-
creased by 2.7 m only: from 29.3 to 32.0 m (tests No.
2 and 4 in Table 1).
It can be assumed, that it is a net effect of smaller
struvite nucleation rate corresponding to lower working
supersaturation level in a crystallizer and smaller content
of solid phase in a mixed and circulated suspension (MT
24.3 5.0 kg struvite/m3 of suspension), limiting thus
excessive crystal attrition effects. From the analysis of
presented experimental data it results, that influence of
Table 1. Effect of copper(II) ions on the results of continuous struvite reaction crystallization process in DT MSMPR crystal-
lizer. Process parameters: temperature 298 K, pH 9, mean residence time of suspension in the crystallizer 900 s.
Feed Suspension Crystal product characteristics*
[PO43–]RM [Cu2+]RM MT [PO43–]ML Lm L50 Ld CV La/Lb [Cu]product
No.
mass % mg/kg kg crystals/m3 mg/kg m m m % – mg/kg
Molar proportions of reagent ions in a feed: [PO43–]RM : [Mg2+]RM : [NH4+]RM = 1 : 1 : 1
1 1.0 0.2 24.4 170 27.5 19.4 25.5 92.9 6.6 6
2 1.0 0.5 24.3 168 29.3 22.4 24.8 84.5 6.5 16
3 0.20 0.2 4.9 154 31.1 22.4 28.2 93.9 6.7 28
4 0.20 0.5 5.0 152 32.0 21.8 28.7 96.8 6.6 76
Molar proportions of reagent ions in a feed: [PO43–]RM : [Mg2+]RM : [NH4+]RM = 1 : 1.2 : 1
5 1.0 0.2 24.6 26 28.8 23.0 25.9 92.8 6.6 7
6 1.0 0.5 24.8 22 33.9 24.6 26.9 94.9 6.4 20
7 0.20 0.2 5.0 24 33.0 24.6 30.5 90.2 6.6 31
8 0.20 0.5 5.1 20 39.7 27.3 41.6 92.4 6.4 90
*Without product crystal washing; tests No. 1 – 2 see [14]; Average concentration of Cu2+ ions in mother solution: 0.05 – 0.10 mg/kg. Lm = ΣxiLi, where: xi – mass
fraction of crystals of mean fraction size Li; L50 – median crystal size for 50 mass % undersize fraction; Ld – crystal mode size; CV = 100(L84L16)/(2L50), where:
L84, L16, L50 – crystal sizes corresponding to 84, 16 and 50 mass % undersize fractions.
Copyright © 2013 SciRes. ACES
N. HUTNIK ET AL.
4
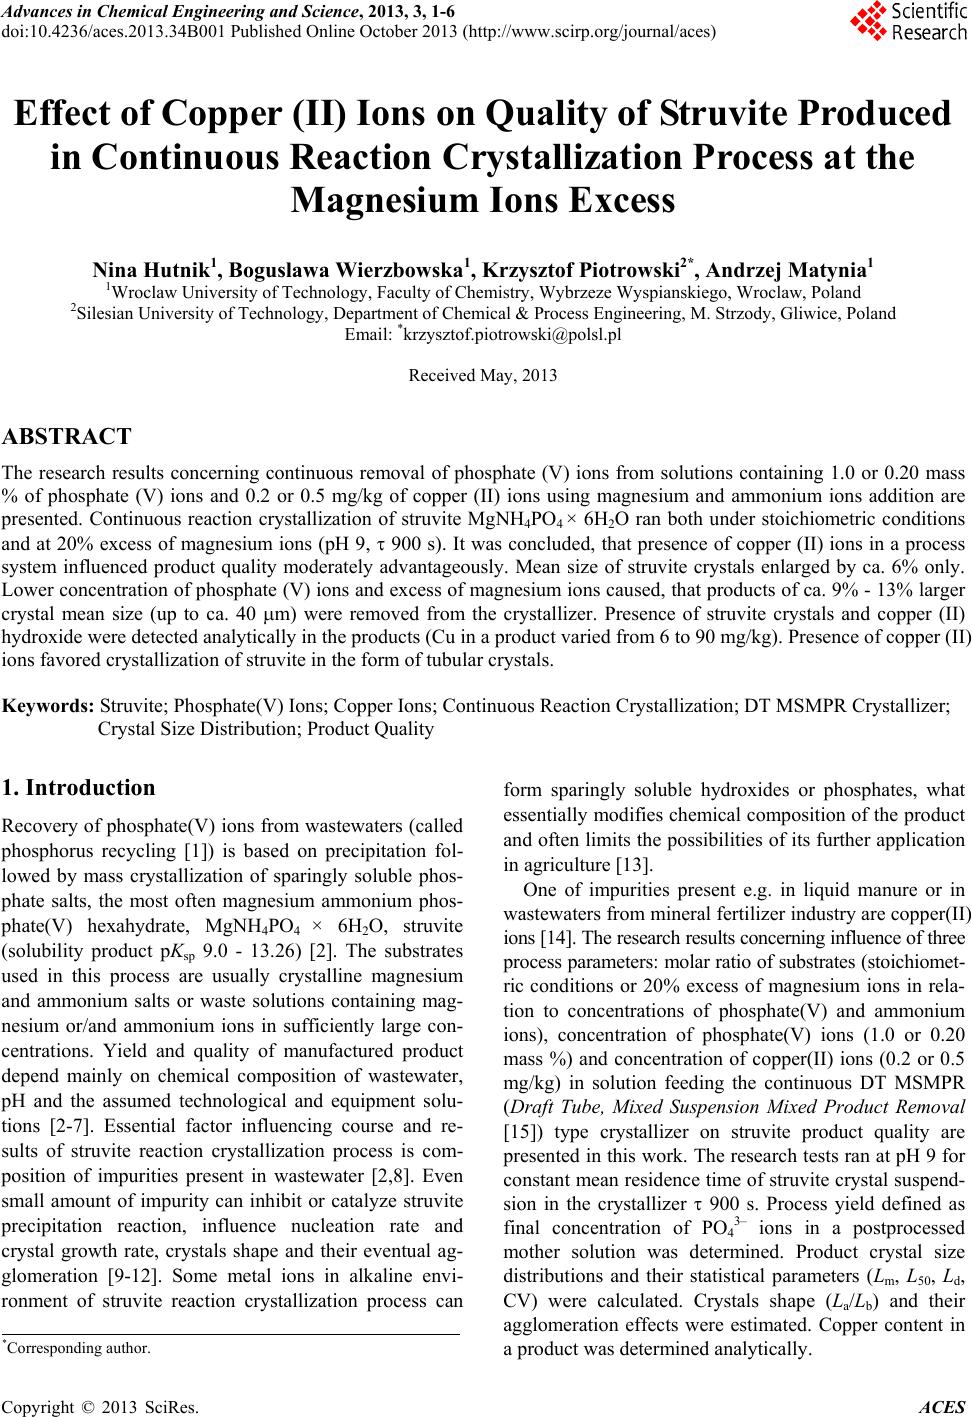
these process parameters on the final crystal size distri-
bution of struvite can be regarded only as a moderate.
Excess of magnesium ions in relation to phosphate(V)
and ammonium ions concentrations in a crystallizer feed
([PO4
3–]RM : [Mg2+]RM : [NH4
+]RM = 1 : 1.2 : 1) influenced
the process results generally advantageously (tests No.
5-8 in Table 1). For example, mean struvite crystal size
Lm enlarged from 32.0 to 39.7 m (by ca. 24%) for
[PO4
3–]RM 0.20 mass % in presence of copper ions of
concentration 0.5 mg/kg (Figure 2(c)). Higher super-
saturation of magnesium ions in struvite precipitation
environment influenced partial components of the con-
tinuous reaction crystallization process generally advan-
tageously. Their net effect (higher nucleation rate, how-
ever also higher crystals growth rate) produced more
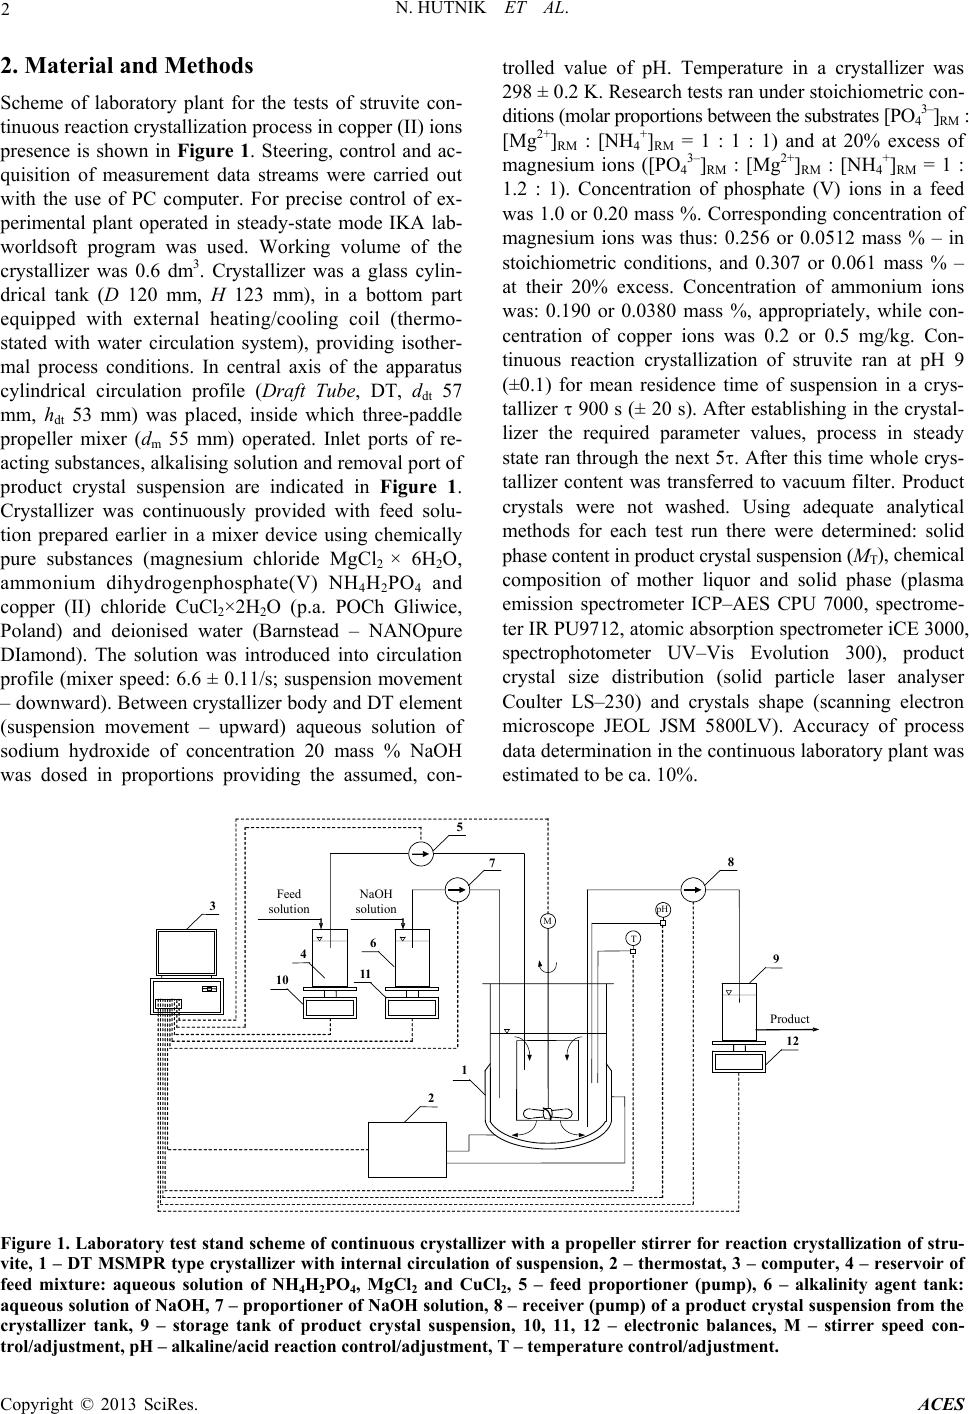
favourable crystal size distribution of struvite. In Figure
3(c) there is presented scanning electron microscope im-
age of exemplary product crystals. From the comparison
of crystal size distributions presented in Figures 2(b) and
(c) it results, that at magnesium ions excess both number
and size of the largest struvite crystals increased (Lmax
210 220 m). Simultaneously number of the smallest
struvite particles decreased. Crystal fraction of sizes
smaller than 5 m represented 9.7% (Figure 2(c)). In
result the dominant crystal size Ld increased from 28.7 up
to 41.6 m, and mean size Lm – from 32.0 to 39.7 m
(tests No. 4 and 8 in Table 1).
a
b
c
Figure 2. Exemplary differential (left scale) and cumulative
(right scale) volumetric (mass) size distributions of struvite
crystals produced in continuous reaction crystallization
process in presence of 0.5 mg/kg of copper(II) ions in a feed:
a) [PO43–]RM 1.0 mass % and b) [PO43–]RM 0.20 mass %, for
[PO43–]RM : [Mg2+]RM: [NH4+]RM = 1 : 1 : 1, and c) [PO43–]RM
0.20 mass % for [PO43–]RM : [Mg2+]RM: [NH4+]RM = 1 : 1.2 : 1
– corresponding to te sts No. 2, 4 and 8 in Table 1.
From the data presented in Table 1 it also results, that
homogeneity within product crystal population was prac-
tically constant. The CV coefficient value representing
quantitatively inhomogeneity within crystal sizes varied
within the 90.2%-96.8% range (excluding only one
strongly deviated value: 84.5%) with the average value
of 93.4%. It is relatively high CV value, suggesting large
diversification within product crystal sizes (CV for ideal
DT MSMPR crystallizer is 50% [15]).
From the analysis of scanning electron microscope
images of exemplary products (Figure 3) it results, that
struvite crystal habit was practically constant. Based on
planimetric measurement results involving 50 crystals
randomly selected from three microscope images (from
each product population) it was concluded, that average
ratio of their length La to their width Lb varied within
relatively narrow range from 6.4 to 6.7, depending on
process parameter values (Table 1). These values were
close to geometrical proportions within struvite crystals
produced in the same crystallizer unit from aqueous solu-
tions of NH4
+, Mg2+ and PO4
3- ions without impurities
[12]. Less than moderate agglomeration within struvite
crystals were reported in the products (Figure 3), espe-
cially within larger crystals. It can be thus regarded, that
advantageous process conditions were established in the
crystallizer, limiting excessive aggregation and agglom-
eration between crystals of the main product component.
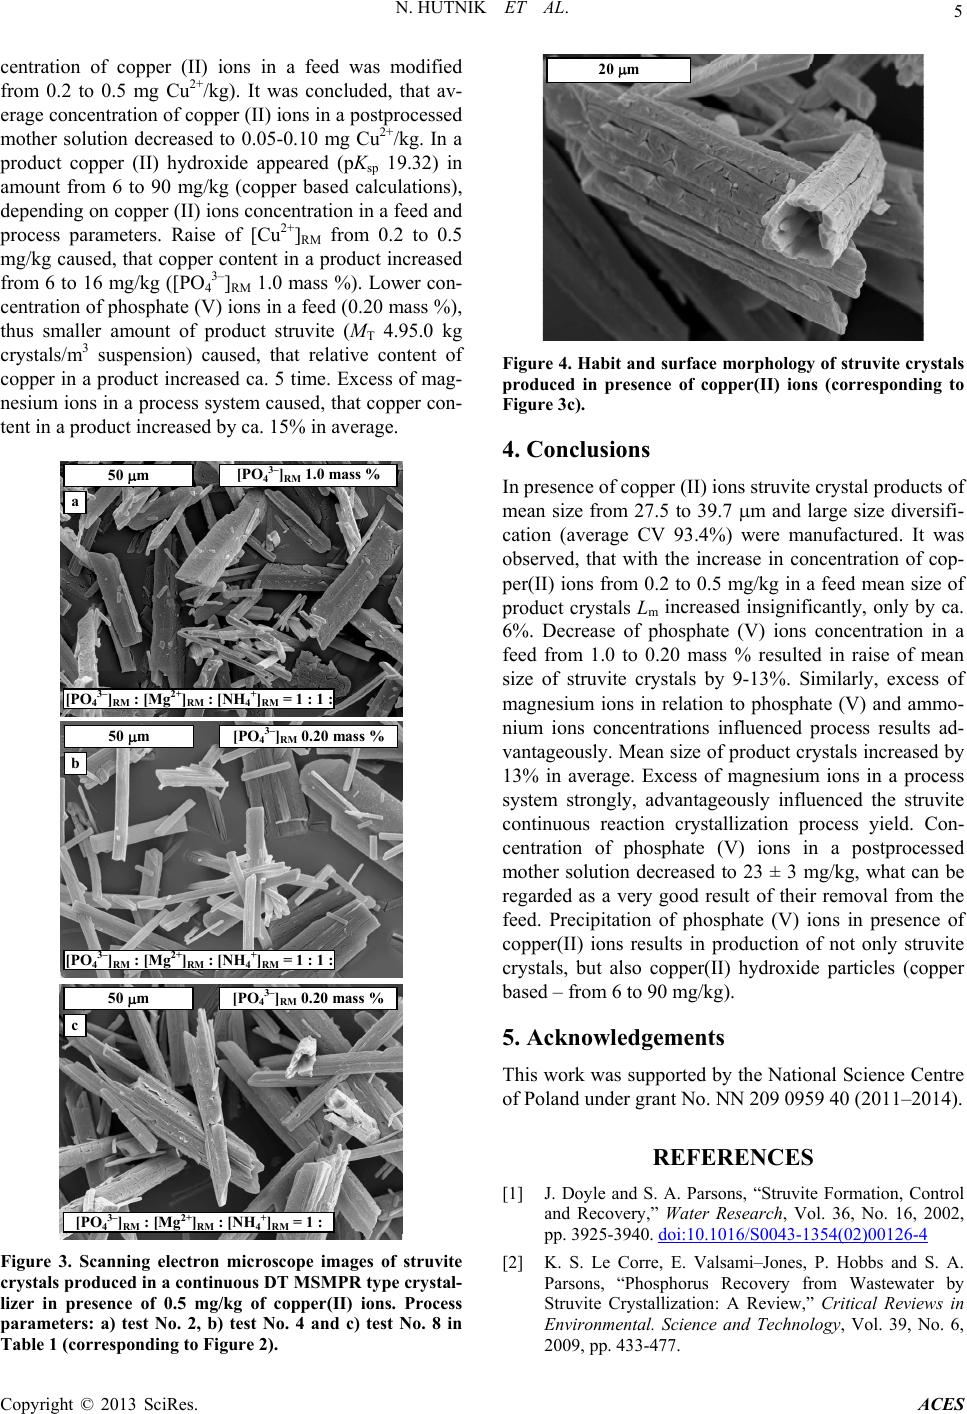
From the presented product microscope images (Figure
3) it also results, that in struvite population characteristic
in shape tubular crystals are present. Most of them, espe-
cially larger crystals, demonstrated, however, distinct
ruptures and crashes along longitudinal axis, numerous
surface cracks and deformed edges, being the proof of
significant tensions in their structure (see Figure 4).
These crystals, shaped during unconstrained growth, are
especially susceptible for the action of shear stresses
generated by turbulent flow of mother solution, as well
as on secondary contact nucleation [15].
In Table 1 there are presented the analytically deter-
mined concentration values of phosphate (V) ions in a
postprocessed mother solution. It can be practically as-
sumed, that this concentration stabilised on relatively
constant and low level 161 ± 9 mg PO4
3–/kg under
stoichiometric conditions and 23 ± 3 mg PO4
3–/kg at
magnesium ions excess. Average efficiency of phosphate
(V) ions removal from the feed was thus 91%-99%.
Magnesium ions excess in relation to phosphate (V) and
ammonium ions concentrations influenced process yield
advantageously. Concentration of phosphate (V) ions in a
postprocessed mother solution was ca. 7 time smaller
compared to stoichiometric conditions. In Table 1 there
are also presented the analytically determined values of
copper(II) ions concentration in a postprocessed mother
solution, as well as copper(II) content in a product. Con-
Copyright © 2013 SciRes. ACES
N. HUTNIK ET AL. 5
centration of copper (II) ions in a feed was modified
from 0.2 to 0.5 mg Cu2+/kg). It was concluded, that av-
erage concentration of copper (II) ions in a postprocessed
mother solution decreased to 0.05-0.10 mg Cu2+/kg. In a
product copper (II) hydroxide appeared (pKsp 19.32) in
amount from 6 to 90 mg/kg (copper based calculations),
depending on copper (II) ions concentration in a feed and
process parameters. Raise of [Cu2+]RM from 0.2 to 0.5
mg/kg caused, that copper content in a product increased
from 6 to 16 mg/kg ([PO4
3–]RM 1.0 mass %). Lower con-
centration of phosphate (V) ions in a feed (0.20 mass %),
thus smaller amount of product struvite (MT 4.95.0 kg
crystals/m3 suspension) caused, that relative content of
copper in a product increased ca. 5 time. Excess of mag-
nesium ions in a process system caused, that copper con-
tent in a product increased by ca. 15% in average.
50 m
a
[PO
43–
]
RM
1.0 mass %
[PO
43–
]
RM
: [Mg
2+
]
RM
: [NH
4+
]
RM
= 1 : 1 :
50 m
b
[PO
43–
]
RM
0.20 mass %
[PO
43–
]
RM
: [Mg
2+
]
RM
: [NH
4+
]
RM
= 1 : 1 :
50 m
c
[PO
43–
]
RM
0.20 mass %
[PO
43–
]
RM
: [Mg
2+
]
RM
: [NH
4+
]
RM
= 1 :
Figure 3. Scanning electron microscope images of struvite
crystals produced in a continuous DT MSMPR type cry stal-
lizer in presence of 0.5 mg/kg of copper(II) ions. Process
parameters: a) test No. 2, b) test No. 4 and c) test No. 8 in
Table 1 (corresponding to Figure 2).
20
m
Figure 4. Habit and surface morphology of struvite crystals
produced in presence of copper(II) ions (corresponding to
Figure 3c).
4. Conclusions
In presence of copper (II) ions struvite crystal products of
mean size from 27.5 to 39.7 m and large size diversifi-
cation (average CV 93.4%) were manufactured. It was
observed, that with the increase in concentration of cop-
per(II) ions from 0.2 to 0.5 mg/kg in a feed mean size of
product crystals Lm increased insignificantly, only by ca.
6%. Decrease of phosphate (V) ions concentration in a
feed from 1.0 to 0.20 mass % resulted in raise of mean
size of struvite crystals by 9-13%. Similarly, excess of
magnesium ions in relation to phosphate (V) and ammo-
nium ions concentrations influenced process results ad-
vantageously. Mean size of product crystals increased by
13% in average. Excess of magnesium ions in a process
system strongly, advantageously influenced the struvite
continuous reaction crystallization process yield. Con-
centration of phosphate (V) ions in a postprocessed
mother solution decreased to 23 ± 3 mg/kg, what can be
regarded as a very good result of their removal from the
feed. Precipitation of phosphate (V) ions in presence of
copper(II) ions results in production of not only struvite
crystals, but also copper(II) hydroxide particles (copper
based – from 6 to 90 mg/kg).
5. Acknowledgements
This work was supported by the National Science Centre
of Poland under grant No. NN 209 0959 40 (2011–2014).
REFERENCES
[1] J. Doyle and S. A. Parsons, “Struvite Formation, Control
and Recovery,” Water Research, Vol. 36, No. 16, 2002,
pp. 3925-3940. doi:10.1016/S0043-1354(02)00126-4
[2] K. S. Le Corre, E. Valsami–Jones, P. Hobbs and S. A.
Parsons, “Phosphorus Recovery from Wastewater by
Struvite Crystallization: A Review,” Critical Reviews in
Environmental. Science and Technology, Vol. 39, No. 6,
2009, pp. 433-477.
Copyright © 2013 SciRes. ACES
N. HUTNIK ET AL.
Copyright © 2013 SciRes. ACES
6
doi:10.1080/10643380701640573
[3] A. Matynia, J. Koralewska, K. Piotrowski and B. Wierz-
bowska, “The Influence of the Process Parameters on the
Struvite Continuous Crystallization Kinetics,” Chemical
Engineering Communications, Vol. 193, No. 2, 2006, pp.
160-176. doi:10.1080/009864490949008
[4] A. Matynia, B. Wierzbowska, N. Hutnik, K. Piotrowski,
R. Liszka, T. Ciesielski and A. Mazienczuk, “Method for
Struvite Recovery from Wastewater of Mineral Fertilizer
Industry,” Przem. Chem., Vol. 89, 2010, pp. 478-485.
[5] A. Mazienczuk, N. Hutnik, K. Piotrowski, B. Wierz-
bowska and A. Matynia, “Continuous crystallizers with
jet pump driven by recirculated mother solution in pro-
duction of struvite”, Przem. Chem., Vol. 91, 2012, pp.
890-895.
[6] K. S. Le Corre, E. Valsami–Jones, P. Hobbs and S. A.
Parsons, “Impact of Reactor Operation on Success of
Struvite Precipitation from Synthetic Liquors,” Environ-
metal Technology, Vol. 28, No. 11, 2007, pp. 1245-1256.
doi:10.1080/09593332808618885
[7] A. Kozik, A. Matynia, N. Hutnik and K. Piotrowski, “Ef-
fect of Technological Input Parameters on Struvite Sepa-
ration in a Continuous Laboratory Plant,” Przem. Chem.,
Vol. 92, 2013 (in press).
[8] N. Hutnik, A. Kozik, A. Mazienczuk, K. Piotrowski, B.
Wierzbowska and A. Matynia, “Phosphates(V) recovery
from phosphorus mineral fertilizers industry wastewater
by continuous struvite reaction crystallization process”,
Wat. Res., Vol. 47, 2013 (in press).
doi:10.1016/j.watres.2013.04.026
[9] K. S. Le Corre, E. Valsami–Jones, P. Hobbs and S. A.
Parsons, “Impact of Calcium on Struvite Crystal Size,
Shape and Purity,” Journal of Crystal Growth, Vol. 283,
2005, doi:10.1016/j.jcrysgro.2005.06.012
[10] N. Hutnik, K. Piotrowski, B. Wierzbowska and A.
Matynia, “Continuous Reaction Crystallization of Stru-
vite from Phosphate(V) Solutions Containing Calcium
ions”, Crystal Research and Technology, Vol. 46, No. 5,
2011, pp. 443-449. doi:10.1002/crat.201100049
[11] N. Hutnik, K. Piotrowski, J. Gluzinska and A. Matynia,
“Effect of Selected Inorganic Impurities Present in Real
Phosphate(V) Solutions on the Quality of Struvite Crys-
tals Produced in Continuous Reaction Crystallization
Process,” Progr. Environ. Sci. Technol., Vol. 3, 2011, pp.
559–566.
[12] N. Hutnik, B. Wierzbowska and A. Matynia, “Effect of
Inorganic Impurities on Quality of Struvite in Continuous
Reaction Crystallization in the Presence of Magnesium
ions Excess,” Przem. Chem., Vol. 91, 2012, pp. 762-766.
[13] L. E. de–Bashan and Y. Bashan, “Recent Advances in
Removing Phosphorus from Wastewater and Its Future
Use as Fertilizer,” Water Research, Vol. 38, No. 19, 2004,
pp. 4222-4246. doi:10.1016/j.watres.2004.07.014
[14] N. Hutnik, A. Matynia, K. Piotrowski and A. Mazienczuk,
“Influence of Copper Ions on the Qquality of Struvite
Crystals Produced in Continuous Reaction Crystallization
Process,” Proceedings of the 38th International Confer-
ence of Slovak Society of Chemical Engineering SSCHE,
Tatranské Matliare, 23-27 May 2011, pp. 318-324.
[15] J. W. Mullin, “Crystallization”, Butterworth–Heinemann,
Oxford, 1993.