Paper Menu >>
Journal Menu >>
 Journal of Software Engineering and Applications, 20 13, 6,34-41 doi:10.4236 / j sea.2013.67B007Published Online July 2013 (http://www.scirp.org/journal/jsea) Copyright © 2013SciR es. JSEA Using Optimized Distributional Parameters as Inputs in a Sequential Unsupervised and Supervised Modeling of Sunspots Data K.Mwitondi1, J. Bugrien2, K. Wang3 1Sheffield HallamUniversity, Department of Computing; 2Statistics Department, BenghaziUniversity; 3Radio and Space Services, Australian Bureau of Meteorology. Email: k.mwitondi@shu.ac.uk, jamal.bugrien@ar.benghazi.edu.ly, K.Wang@bom.gov.au Received June,2013 ABSTRACT Detecting natura lly ar isin g structure s in data iscentral to kno wledge extraction from data. In most applications, the main challenge is in the choice of the appropriate model for exploring the data features. The choice is generally poorly under- stood and any tentative choice may be too restrictive. Growing volumes of data, disparate data sources and modelling techniques entail the need for model optimization via adaptability rather than comparability. We propose a novel two-stage algorithm to modelling continuous data consisting of an unsupervised stage whereby the algorithm searches thro ugh t he da ta for optimal parameter values and a supervised stage that adapts the parameters for predictive mode lling. The method is implemented on the sunspots data with inherently Gaussian distributional properties and assumed bi-modality. Optimal values separating high from lows cycles are obtained via multiple simulations. Early patterns for each recorded cycle reveal that the first 3 years provide a sufficient basis for predicting the peak. Multiple Support Vector Machine runs using repeatedly improved data parameters show that the approach yields greater accuracy and reliability than conventional approaches and provides a good basis for model selectio n. Mo del reliability is establis hed via multiple simulations of this type. Keywords:Clustering; Data Mining; Density Estimatio n; EM Algorithm; S unspots; Supervised M odelling; Support Vector Machines; Unsupervised Modelling 1. Introduction Many real-life problems are tackled via knowledge ex- traction from data – a process typically associated with detecting naturally arising structures in the data. A typi- cal example is the sunspots dataset [11] – an average oscillating sequence of the beginning and ending periods of solar cycles with an approximate periodicity of 11 years [7]. Recorded sunspots span across the first cycle (Ma rch 17 55 to June 1766 ) to the first fe w mont hs of t he current (24th) cycle. Clustered in non-random positions above and below the equator, the spots are generated by interactions between the sun's surface plasma and its magnetic field [19 and 22]. Solar magnetic activity cycles have attracted the attention of scientists for many years. Solar flares, for instance, affect our planet in dif- ferent ways - including ejecting plasma and energetic particles and potentially causing geomagnetic storms and damaging satellites [16]. The paper is motivated by the documented effects of sunspots on terrestrial conditio n s. Correlations between space and terrestrial weather have been indicated in solar studies dating back many years [13, 18 and 20]. Climatic variations in Lapland via co m- plex variations in the atmosphere, lunar gravitation and solar activity have also been explained [11]. This paper will be subjecting sunspots data to a se- quential analysis involving unsupervised and supervised modeling. The two concepts represent the typical data mining problems – data c lustering and cla ssification. T he primary goal of the former is to partition a given dataset with a known or unknown distribution into subgroups in such a way that data points in each group are as homo- geneous as possible while those in different groups are as heterogeneous as possible. The method is typically ap- plied in pro ble ms in which t her e is no clear mathematica l formulation for describing the underlying structures. Various approaches to data clustering have been studied and are well-documented in the literature [21, 17 and 6]. However, determining the number of naturally arising structures in data remains a daunting challenge among the data science community. Many clustering tools in the 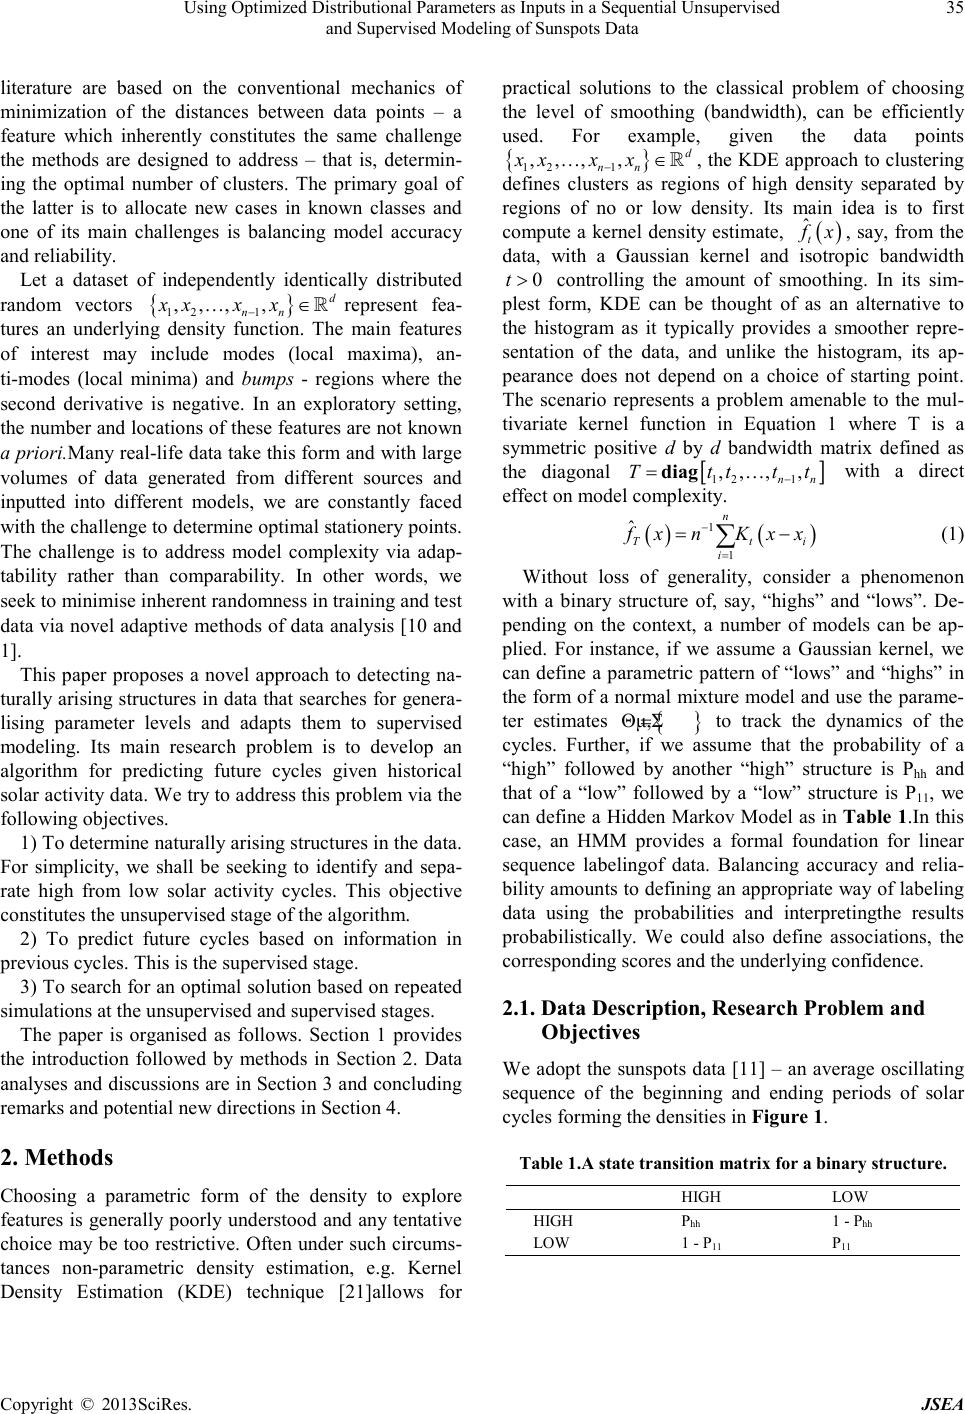 Using Optimized Distributional Parameters as Inputs in a Sequential Unsupervised and Supervised Modeling of Sunspots Data Copyright © 2013SciR es. JSEA 35 literature are based on the conventional mechanics of minimization of the distances between data points – a feature which inherently constitutes the same challenge the methods are designed to address – that is, determin- ing the optimal number of clusters. The primary goal of the latter is to allocate new cases in known classes and one of its main challenges is balancing model accuracy and reliability. Let a dataset of independently identically distributed random vectors { } 12 1 ,,, , d nn xxx x − …∈ represent fea- tures an underlying density function. The main features of interest may include modes (local maxima), an- ti-modes (local minima) and bumps - regions where the second derivative is negative. In an exploratory setting, the number and locations of these features are not known a priori.Many real-life data take this form and with large volumes of data generated from different sources and inputted into different models, we are constantly faced with the challenge to d eter mine op timal stationer y points. The challenge is to address model complexity via adap- tability rather than comparability. In other words, we seek to minimise inherent randomness in tra ini ng and test data via novel ad aptive metho ds of data ana lysis [10 and 1]. This paper proposes a novel approach to detecting na- turally arising structures in data that searches for genera- lising parameter levels and adapts them to supervised modeling. Its main research problem is to develop an algorithm for predicting future cycles given historical solar activity d ata. We tr y to addre ss this proble m via the following objectives. 1) To determine naturally arising s t ruc t ur es i n t he d a ta . For simplicity, we shall be seeking to identify and sepa- rate high from low solar activity cycles. This objective constitutes the unsupervised stage of the algorithm. 2) To predict future cycles based on information in previous c yc l es. T hi s i s the super vised stage. 3) To search for an optimal solution based on repeated simulations at the unsupervis ed and sup ervise d stages. The paper is organised as follows. Section 1 provides the introduction followed by methods in Section 2. Data analyses and discussions are in Section 3 and concluding remarks and p otential new dire c tions in Section 4 . 2. Method s Choosing a parametric form of the density to explore features is generally poorly understood and any tentative choice may be too restr ictive. Often under s uch circ ums- tances non-parametric density estimation, e.g. Kernel Density Estimation (KDE) technique [21]allows for practical solutions to the classical problem of choosing the level of smoothing (bandwidth), can be efficiently used. For example, given the data points { } 12 1 ,,, , d nn xxx x − …∈ , the K DE appro ach to clust ering defines clusters as regions of high density separated by regions of no or low density. Its main idea is to first compute a kernel density estimate, ( ) ˆt fx , say, from the data, with a Gaussian kernel and isotropic bandwidth 0t> controlling the amount of smoothing. In its sim- plest form, KDE can be thought of as an alternative to the histogram as it typically provides a smoother repre- sentation of the data, and unlike the histogram, its ap- pearance does not depend on a choice of starting point. The scenario represents a problem amenable to the mul- tivariate kernel function in Equation 1 where T is a symmetric positive d by d bandwidth matrix defined as the diagonal [ ] 12 1 ,, ,, nn Tttt t − = …diag with a direct effect on model complexity. ( ) ( ) 1 1 ˆn T ti i f xnKxx − = = − ∑ (1) Without loss of generality, consider a phenomenon with a binary structure of, say, “highs” and “lows”. De- pending on the context, a number of models can be ap- plied. For instance, if we assume a Gaussian kernel, we can define a parametric pattern of “lows” and “highs” in the form of a normal mixture model and use the parame- ter estimates { } Θμ,Σ= to track the dynamics of the cycles. Further, if we assume that the probability of a “high” followed by another “high” structure is Phh and that of a “low” followed by a “low” structure is P11, we can define a Hidden Markov Model as in Tabl e 1.In this case, an HMM provides a formal foundation for linear sequence labelingof data. Balancing accuracy and relia- bility amounts to defining an appropriate way of labeling data using the probabilities and interpretingthe results probabilistically. We could also define associations, the corresponding scores and the underlying confidence. 2.1. Data Description, Research Problem and Objectives We adopt the sunspots data [11] – an average oscillating sequence of the beginning and ending periods of solar cycles forming the densities in F igure 1. Table 1.A stat e transition matrix for a binary s tructure. HIGH LOW HIGH Phh 1 - Phh LOW 1 - P11 P11 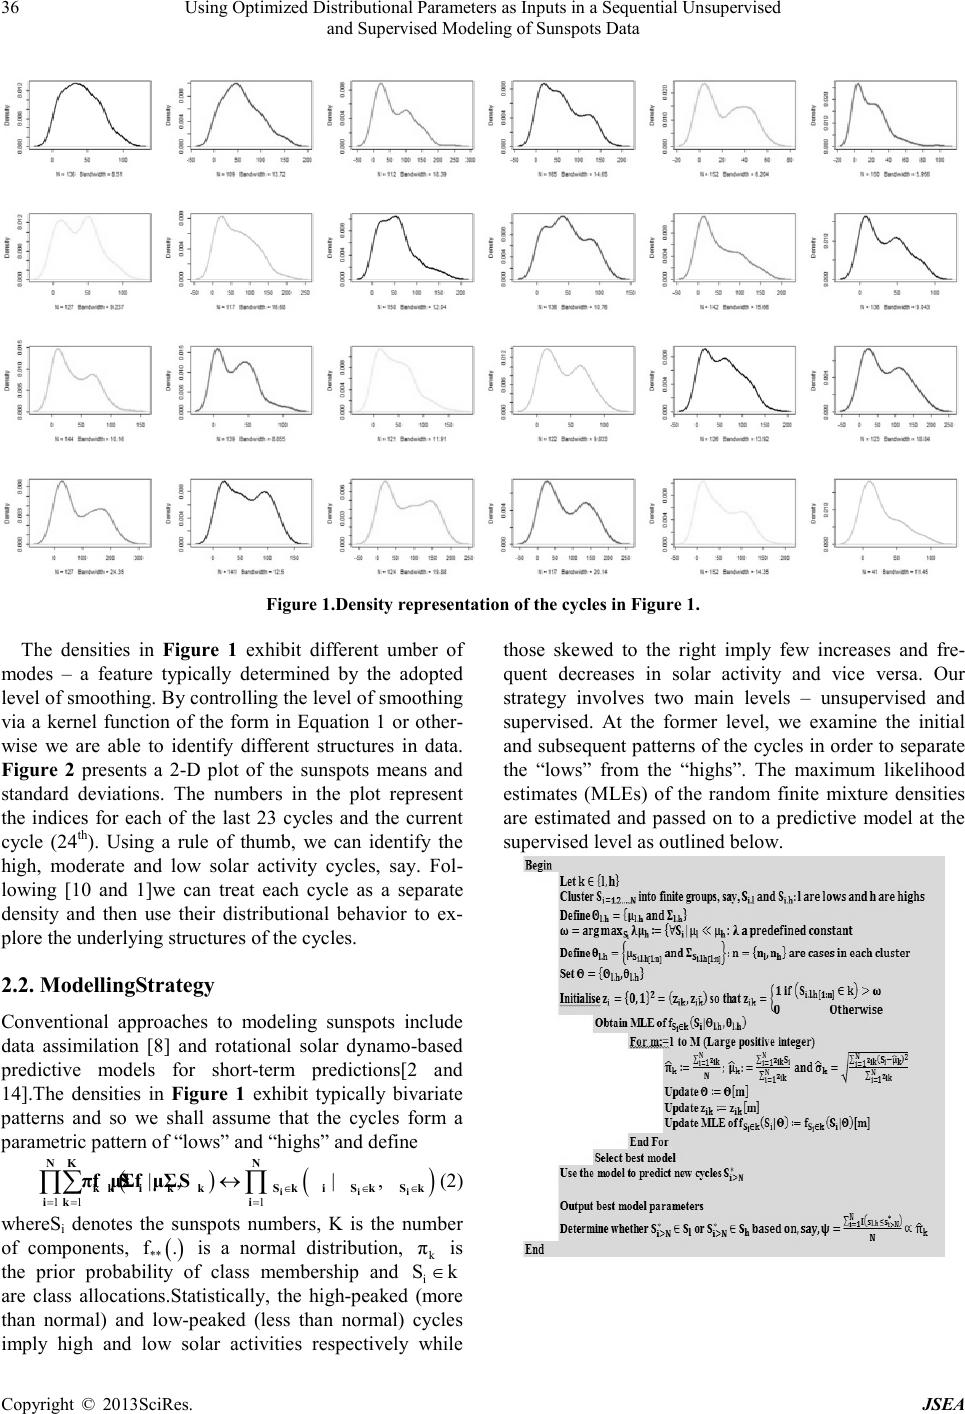 Using Optimized Distributional Parameters as Inputs in a Sequential Unsupervised and Supervised Modeling of Sunspots Data Copyright © 2013SciR es. JSEA 36 Figure 1 .Density representation of the cycles in Fig ure 1. The densities in Figure 1 exhibit different umber of modes – a feature typically determined by the adopted level of s moo t hi ng. By contr olli ng t he l e vel o f smoo t hi ng via a kernel function of the form in Equation 1 or other- wise we are able to identify different structures in data. Figure 2 presents a 2-D plot of the sunspots means and standard deviations. The numbers in the plot represent the indices for each of the last 23 cycles and the current cycle (24th). Using a rule of thumb, we can identify the high, moderate and low solar activity cycles, say. Fol- lowing [10 and 1]we can treat each cycle as a separate density and then use their distributional behavior to ex- plore the underlying structures of the cycle s . 2.2. ModellingStrategy Conventional approaches to modeling sunspots include data assimilation [8] and rotational solar dynamo-based predictive models for short-term predictions[2 and 14].The densities in Figure 1 exhibit typically bivariate patterns and so we shall assume that the cycles form a parametric pattern of “lows” and “highs” and define ( ) ( ) 11 1 |,| , ∈ ∈∈ = == ↔ ∏∑ ∏ i ii NK N kk ik kSk iSk Sk ik i πfSμΣfSμΣ (2) whereSi denotes the sunspots numbers, K is the number of components, ( ) ** f. is a normal distribution, k π is the prior probability of class membership and i Sk ∈ are class allocations.Statistically, the high-peaked (more than normal) and low-peaked (less than normal) cycles imply high and low solar activities respectively while those skewed to the right imply few increases and fre- quent decreases in solar activity and vice versa. Our strategy involves two main levels – unsupervised and supervised. At the former level, we examine the initial and subsequent patterns of the cycles in order to separate the “lows” from the “highs”. The maximum likelihood estimates (MLEs) of the random finite mixture densities are estimated and passed on to a predictive model at the supervised level as outlined below. 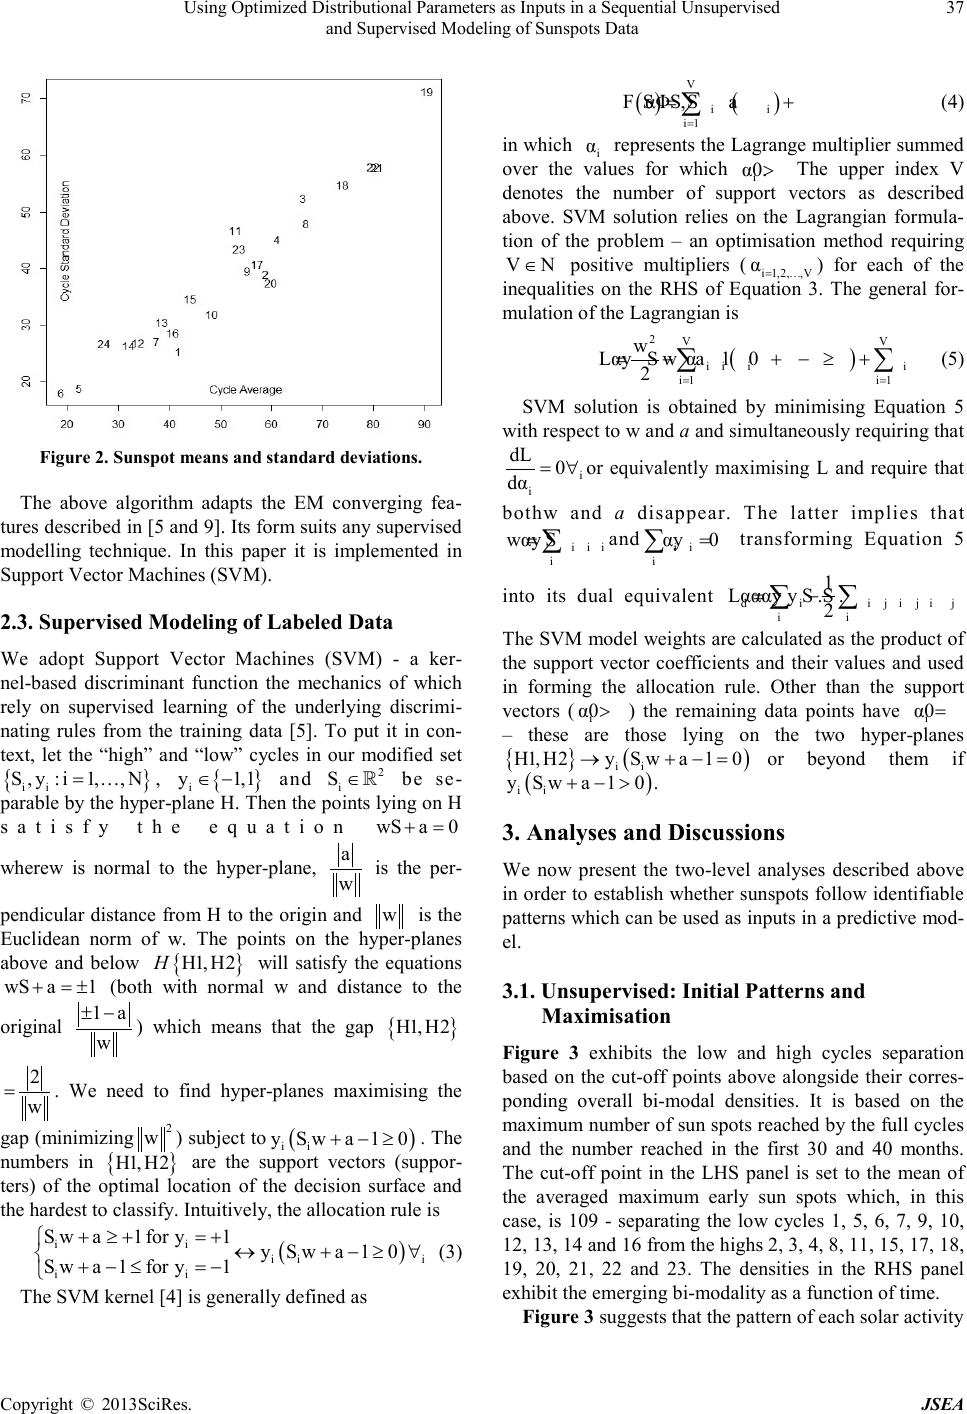 Using Optimized Distributional Parameters as Inputs in a Sequential Unsupervised and Supervised Modeling of Sunspots Data Copyright © 2013SciR es. JSEA 37 Figure 2 . Sunspot means and standard deviations. The above algorithm adapts the EM converging fea- tures described in [5 and 9 ] . Its for m suits an y supervi sed modelling technique. In this paper it is implemented in Support Vector Machines (SVM). 2.3. Supervised Modeling of Labeled Data We adopt Support Vector Machines (SVM) - a ker- nel-based discriminant function the mechanics of which rely on supervised learning of the underlying discrimi- nating rules from the training data [5]. To put it in con- text, let the “high” and “low” cycles in our modified set { } ii S,y :i1,,N= … , { } i y 1,1∈− and 2 i S∈ be se- parable by the hyper-plane H . T hen the poi nts lyi ng on H satisfy the equation wS a0+= wherew is normal to the hyper-plane, a w is the per- pend icular d istance from H t o the or igin and w is the Euclidean norm of w. The points on the hyper-planes above and below { } H1, H2H will satisfy the equations wS a1+=± (both with normal w and distance to the original 1a w ±− ) which means that the gap { } H1, H2 2 w = . We need to find hyper-planes maximising the gap ( minimizing 2 w ) subject to ( ) ii y Swa 10+−≥ . T he numbers in { } H1, H2 are the support vectors (suppor- ters) of the optimal location of the decision surface and the hardest to classify. Intuitively, the allocation rule is ( ) ii ii i ii S wa1fory1y Swa10 S wa1fory1 + ≥+=+ ↔+ −≥∀ + −≤=− (3) The SVM kernel [4] is generally defined as ( )() V ii i1 FSαΦS,S a = = + ∑ (4) in whic h i α represents the Lagrange multiplier summed over the values for which i α0.> The upper index V denotes the number of support vectors as described above. SVM solution relies on the Lagrangian formula- tion of the problem – an optimisation method requiring VN∈ positive multipliers ( i 1,2,,V α = … ) for each of the inequalities on the RHS of Equation 3. The general for- mulation of the Lagr angia n is ( ) 2VV ii ii i1 i1 w LαySwa 10α 2 = = =−+ −≥+ ∑∑ (5) SVM solution is obtained by minimising Equation 5 with respect to w and a and si mu lt ane o usly re qui ring t ha t i i dL 0 dα= ∀ or equivalently maximising L and require that bothw and a disappear. The latter implies that iii i wαyS= ∑ and ii i αy0= ∑ transforming Equation 5 into its dual equivalent dii ji jij ii 1 Lαααyy S .S . 2 = − ∑∑ The SVM model weights are calculated as the product of the support vector coefficients and their values and used in forming the allocation rule. Other than the support vectors (i α0>) the remaining data points have i α0= – these are those lying on the two hyper-planes {} () ii H1, H2ySwa10→ +−= or beyond them if ( ) ii ySwa10 .+−> 3. Analyses and Discussions We now present the two-level analyses described above in order to establish whether sunspots follow identifiable patterns which can be used as inputs in a predictive mod- el. 3.1. Unsupervised: Initia l Patterns and Maximisation Figure 3 exhibits the low and high cycles separation based on the cut-off points above alongside their corres- ponding overall bi-modal densities. It is based on the maximum number of sun spots reached by the full cycles and the number reached in the first 30 and 40 months. The cut-off point in the LHS panel is set to the mean of the averaged maximum early sun spots which, in this case, is 109 - separating the low cycles 1, 5, 6, 7, 9, 10, 12, 13, 14 and 16 from the highs 2, 3, 4, 8, 11, 15, 17, 18, 19, 20, 21, 22 and 23. The densities in the RHS panel exhibit the eme rging bi-moda lity as a function of ti me. Figure 3 suggests that the pattern of each solar activity 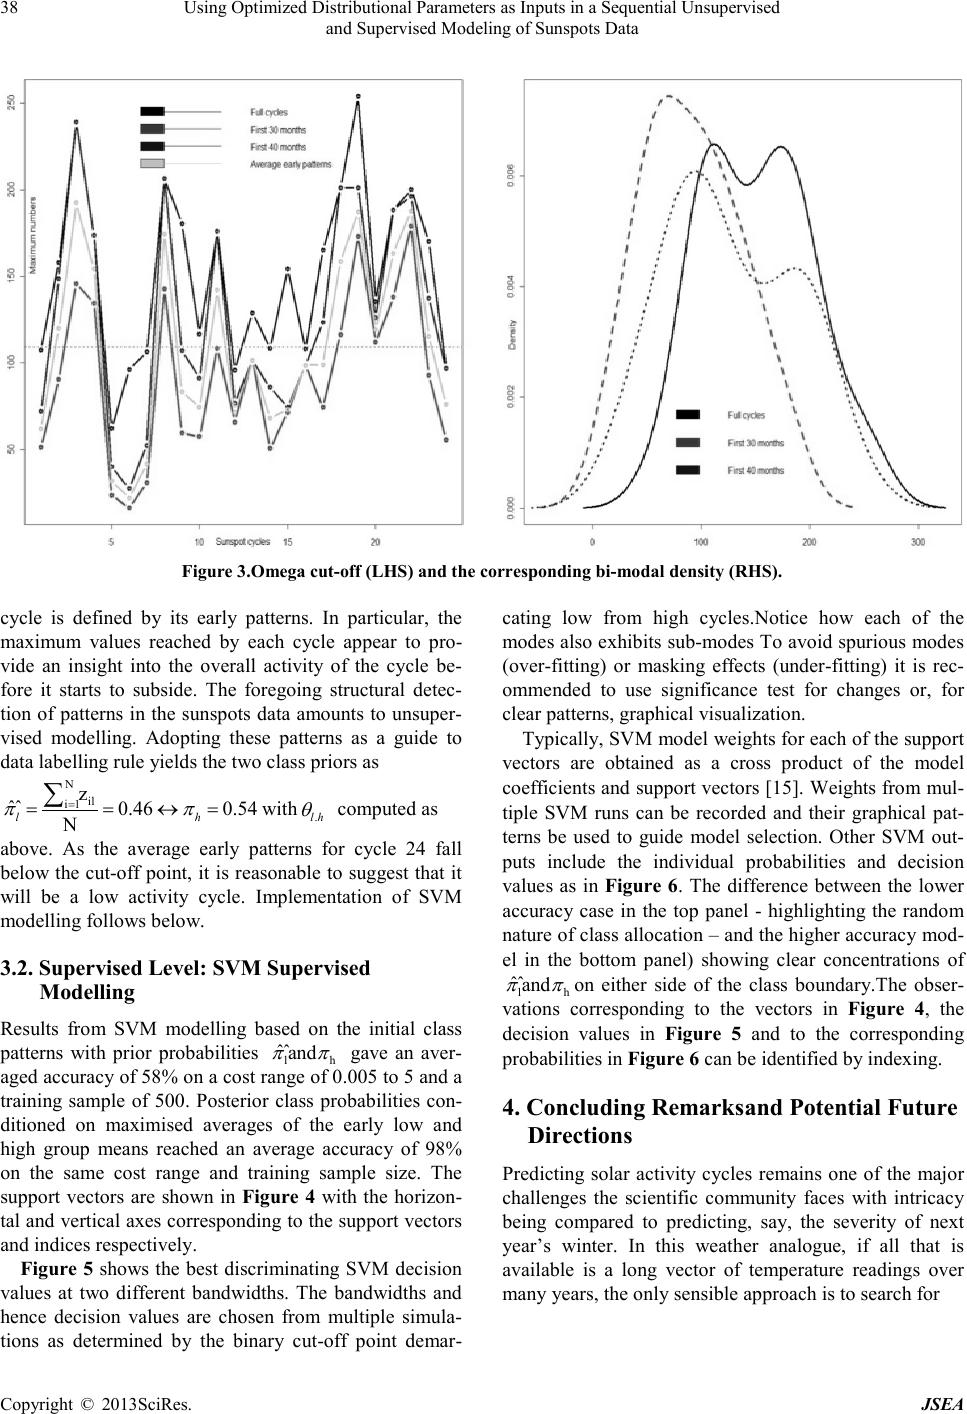 Using Optimized Distributional Parameters as Inputs in a Sequential Unsupervised and Supervised Modeling of Sunspots Data Copyright © 2013SciR es. JSEA 38 Figure 3 .Omega cut-off (LHS) and the corresponding bi-mo dal density (RHS). cycle is defined by its early patterns. In particular, the maximum values reached by each cycle appear to pro- vide an insight into the overall activity of the cycle be- fore it starts to subside. The foregoing structural detec- tion of patterns in the sunspots data amounts to unsuper- vised modelling. Adopting these patterns as a guide to data labe lling rule yields the two class p riors as N il i1 z ˆˆ 0.46 0.54 N lh ππ = ==↔= ∑ with .lh θ computed as above. As the average early patterns for cycle 24 fall below the cut-off point, it is reasonable to suggest that it will be a low activity cycle. Implementation of SVM modelling follows belo w. 3.2. Supervised Level: SVM Supervised Modelling Results from SVM modelling based on the initial class patterns with prior probabilities lh ˆˆand ππ gave an aver- aged accuracy of 58% on a cost range of 0.005 to 5 and a training sample of 500. Posterior class probabilities con- ditioned on maximised averages of the early low and high group means reached an average accuracy of 98% on the same cost range and training sample size. The support vectors are shown in Figure 4 with the horizon- tal and vertical axes corresponding to the support vectors and indices respectively. Figure 5 shows the best discriminating SVM decision values at two different bandwidths. The bandwidths and hence decision values are chosen from multiple simula- tions as determined by the binary cut-off point demar- cating low from high cycles.Notice how each of the modes also exhibits sub-modes To avoid spurious modes (over-fitting) or masking effects (under-fitting) it is rec- ommended to use significance test for changes or, for clear patterns, graphical visualization. Typically, SVM model weights for each of the support vectors are obtained as a cross product of the model coefficients and support vectors [15]. Weight s fro m mul- tiple SVM runs can be recorded and their graphical pat- terns be used to guide model selection. Other SVM out- puts include the individual probabilities and decision values as in Figure 6. The difference between the lower accuracy case in the top panel - highlighting the random nature of class allocation – and the higher accuracy mod- el in the bottom panel) showing clear concentrations of lh ˆˆand ππ on either side of the class boundary.The obser- vations corresponding to the vectors in Figure 4, the decision values in Figure 5 and to the corresponding prob abilities in Figure 6 can be identified by indexing. 4. Concluding Remarksand Potential Fut ure Directions Predicting solar activity cycles remains one of the major challenges the scientific community faces with intricacy being compared to predicting, say, the severity of next year’s winter. In this weather analogue, if all that is available is a long vector of temperature readings over many years, the only sensible approach is to search for 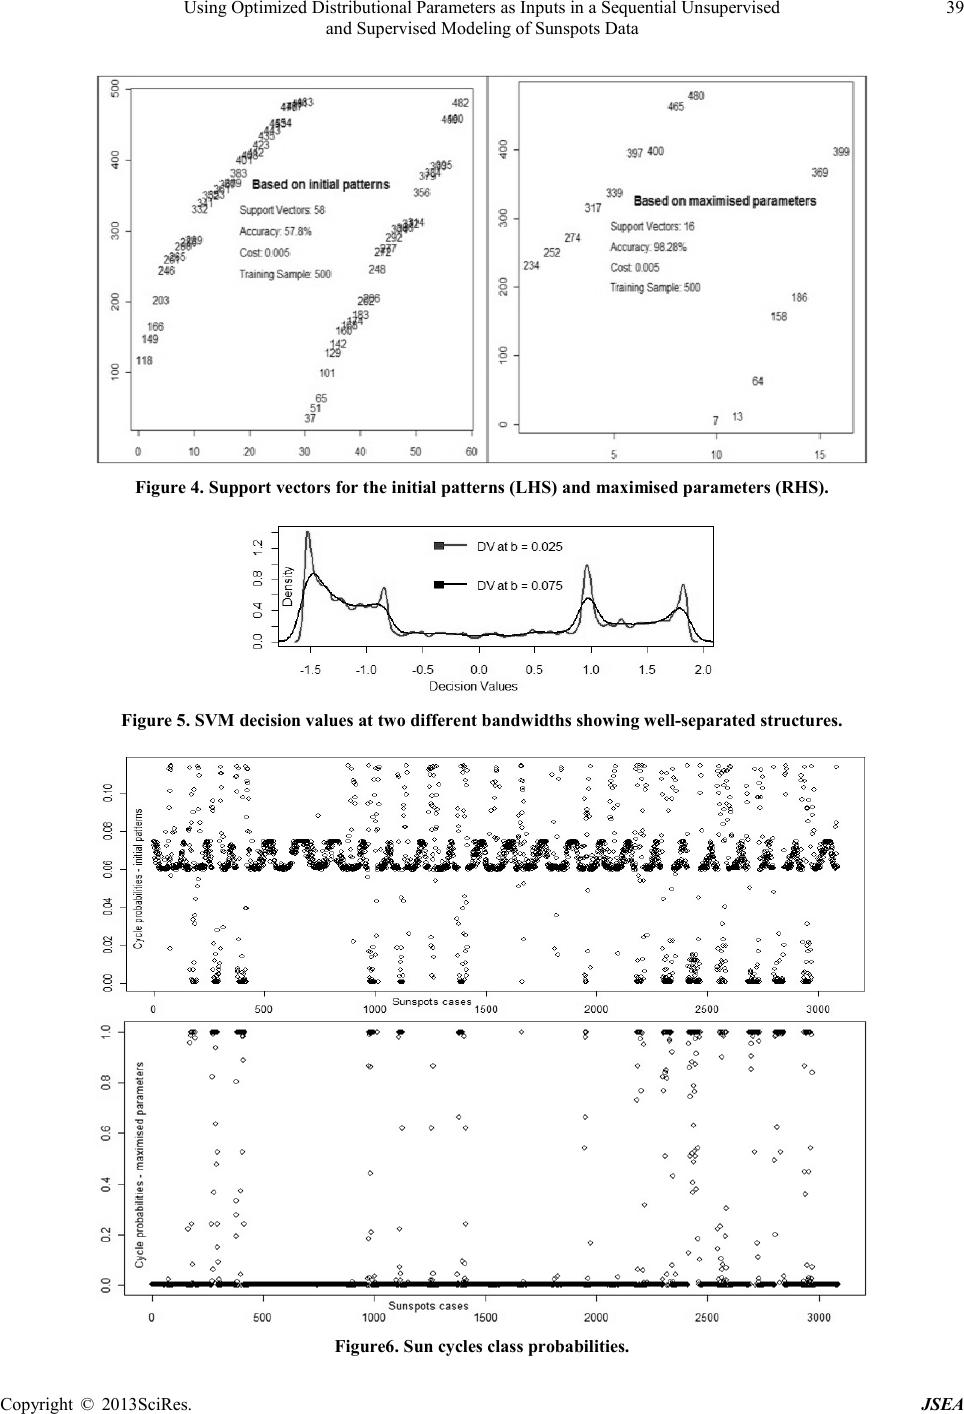 Using Optimized Distributional Parameters as Inputs in a Sequential Unsupervised and Supervised Modeling of Sunspots Data Copyright © 2013SciR es. JSEA 39 Figure 4 . Support vectors for the initial patterns (LHS) and maximised parameters (RHS). Figure 5 . S VM decision values at two different bandwidths sho wing wel l-separated structures. Figure6 . Sun cycles class probabilities. 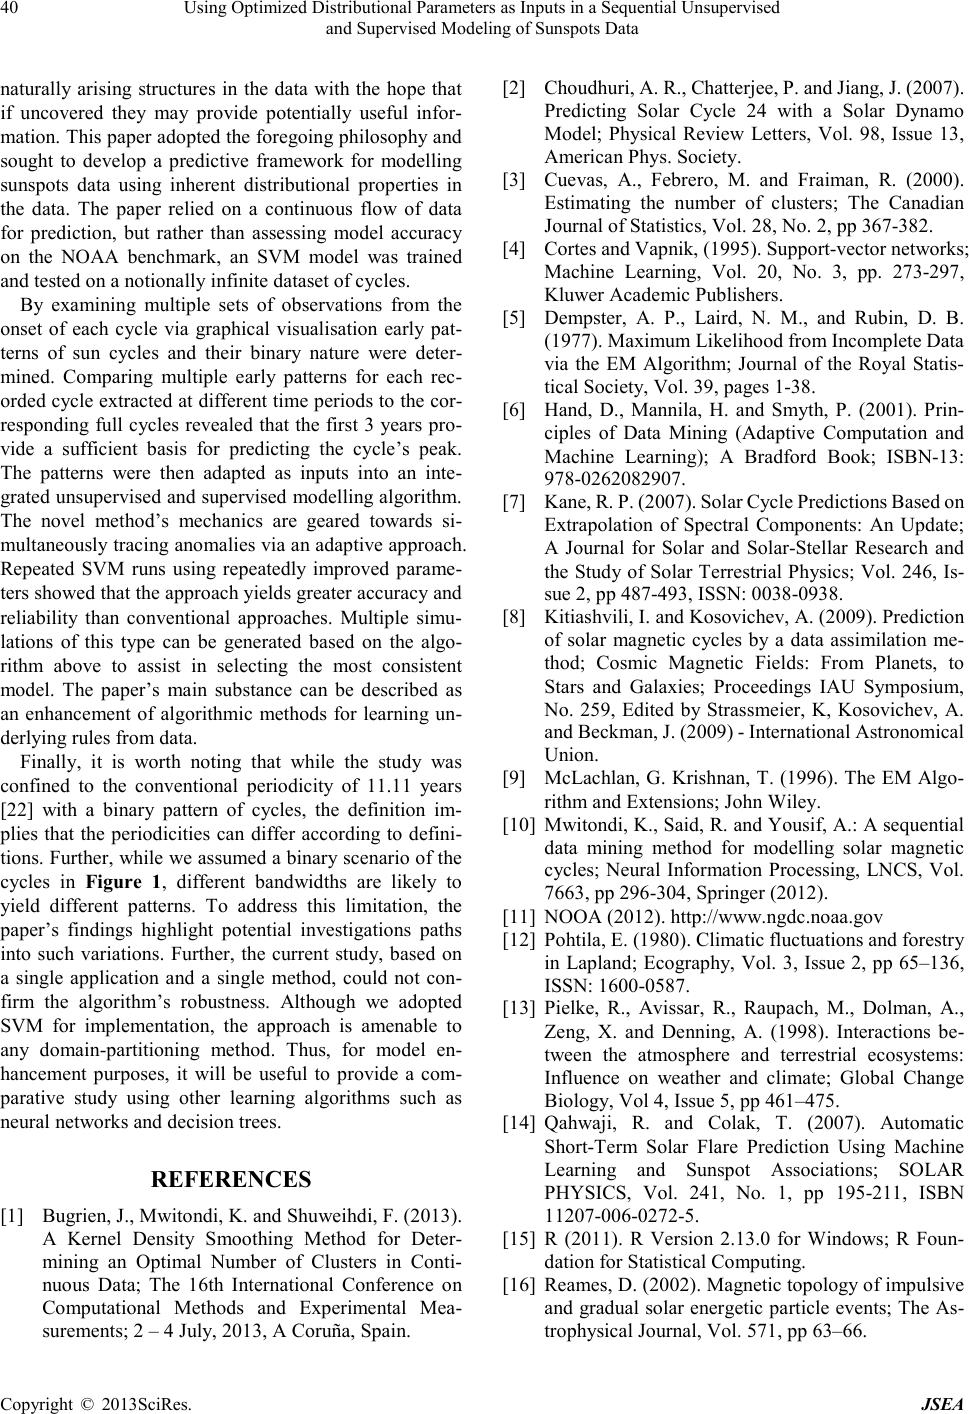 Using Optimized Distributional Parameters as Inputs in a Sequential Unsupervised and Supervised Modeling of Sunspots Data Copyright © 2013SciR es. JSEA 40 naturally arising structures in the data with the hope that if uncovered they may provide potentially useful infor- mation. This paper adopted the foregoing philosophy and sought to develop a predictive framework for modelling sunspots data using inherent distributional properties in the data. The paper relied on a continuous flow of data for prediction, but rather than assessing model accuracy on the NOAA benchmark, an SVM model was trained and tested on a notionally infinite dataset of cycl es. By examining multiple sets of observations from the onset of each cycle via graphical visualisation early pat- terns of sun cycles and their binary nature were deter- mined. Comparing multiple early patterns for each rec- orded cycle extracted at different time periods to the cor- responding full c ycles revealed that the first 3 years pro- vide a sufficient basis for predicting the cycle’s peak. The patterns were then adapted as inputs into an inte- grate d unsup ervi sed and supervi sed mod elli ng algo rithm. The novel method’s mechanics are geared towards si- multaneously tracing anomalies via an adaptive approach. Repeated SVM runs using repeatedly improved parame- ters showed that the approach yields greater accuracy and reliability than conventional approaches. Multiple simu- lations of this type can be generated based on the algo- rithm above to assist in selecting the most consistent model. The paper’s main substance can be described as an enhancement of algorithmic methods for learning un- derlying rule s from data. Finally, it is worth noting that while the study was confined to the conventional periodicity of 11.11 years [22] with a binary pattern of cycles, the definition im- plies that the periodicities can differ according to defini- tions. Further, while we assumed a binary scenario of the cycles in Figure 1, different bandwidths are likely to yield different patterns. To address this limitation, the paper’s findings highlight potential investigations paths into such variations. Further, the current study, based on a single application and a single method, could not con- firm the algorithm’s robustness. Although we adopted SVM for implementation, the approach is amenable to any domain-partitioning method. Thus, for model en- hancement purposes, it will be useful to provide a com- parative study using other learning algorithms such as neural networks and decision trees. REFERENCES [1] Bugrie n, J. , Mwit ondi, K. and Shuweihdi, F. (2013). A Kernel Density Smoothing Method for Deter- mining an Optimal Number of Clusters in Conti- nuous Data; The 16th International Conference on Computational Methods and Experimental Mea- surement s; 2 – 4 July, 2013, A Coruña, Spain. [2] Choudhuri , A. R., Chatterjee, P. and Jiang, J. (2007). Predicting Solar Cycle 24 with a Solar Dynamo Model; Physical Review Letters, Vol. 98, Issue 13, American Phys. Society. [3] Cuevas, A., Febrero, M. and Fraiman, R. (2000). Estimating the number of clusters; The Canadian Journal of Statistics, Vol. 28, No. 2, pp 367-382. [4] Cort es a n d V apn i k , (1995). Su ppor t-vector networks; Machine Learning, Vol. 20, No. 3, pp. 273-297, Kluwer Academic Publishers. [5] Dempster, A. P., Laird, N. M., and Rubin, D. B. (1977). Ma x imum Lik el ih ood from In complete Data via the EM Algorithm; Journal of the Royal Statis- tical Society, Vol. 39, pages 1-38. [6] Hand, D., Mannila, H. and Smyth, P. (2001). Prin- ciples of Data Mining (Adaptive Computation and Machine Learning); A Bradford Book; ISBN-13: 978-0262082907. [7] Kane, R. P. (2007). Solar Cy cle Predictions Based on Extrapolation of Spectral Components: An Update; A Journal for Solar and Solar-Stellar Research and the Study of Solar Terrestrial Physics; Vol. 246, Is- sue 2, pp 487-493, ISSN: 0038-0938. [8] Kitiashvili, I. and Kosovichev, A. (2009). Prediction of solar magnetic cycles by a data assimilation me- thod; Cosmic Magnetic Fields: From Planets, to Stars and Galaxies; Proceedings IAU Symposium, No. 259, Edited by Strassmeier, K, Kosovichev, A. and Beckman, J. ( 2009) - International Astronomical Union. [9] McLachlan, G. Krishnan, T. (1996). The EM Algo- rithm and Extensions; John W iley. [10] Mwitondi, K., Said, R. and Yousif, A.: A sequential data mining method for modelling solar magnetic cycles; Neural Information Processing, LNCS, Vol. 7663, pp 296-304, Springer (2012). [11] NOOA (2012). http://www.ngdc.noaa.gov [12] Pohtila, E. (1980). Climatic fluctuations and forestry in Lapland; Ecography, Vol. 3, Issue 2, pp 65–136, ISSN: 1600-0587. [13] Pielke, R., Avissar, R., Raupach, M., Dolman, A., Zeng, X. and Denning, A. (1998). Interactions be- tween the atmosphere and terrestrial ecosystems: Influence on weather and climate; Global Change Biology, Vol 4, Issue 5, pp 461–475. [14] Qahwaji, R. and Colak, T. (2007). Automatic Shor t-Term Solar Flare Prediction Using Machine Learning and Sunspot Associations; SOLAR PHYSICS, Vol. 241, No. 1, pp 195-211, ISBN 11207-006-0272-5. [15] R (2011). R Version 2.13.0 for Windows; R Foun- dation for Statistical Computing. [16] Reames, D. (2002). Magnetic topology of impulsive and gradual solar energetic particle events; The As- trophysical Journal, Vol. 571, pp 63–66.  Using Optimized Distributional Parameters as Inputs in a Sequential Unsupervised and Supervised Modeling of Sunspots Data Copyright © 2013SciR es. JSEA 41 [17] Roberts, S. J.: Parametric and Non-parametric Un- supervised Cluster An alysis, Pattern R ecognition, 30, 5, pp 261-272 (1997). [18] Rycroft, M. J, Israelsson, S. and Price, C. (2000). The global atmospheric electric circui t, solar activity and climate change; Journal of Atmospheric and Solar-Terrestrial Physics, Vol. 62, Issues 17–18, pp 1563–1576. [19] Schwabe, S.H. (1843). AstronomischeNachrichten, 20, No. 495, 234-235 [20] Siscoe, G. L. (1978). Solar–terrestrial influences on weather and climate; Climatology Supplement, Na- ture, Vol. 276, pp 348-352. [21] Silverman, B. W. (1981). Using Kernel Density Estimates to Investigate Multimodality, Journal of the Royal Stati stica l Society, B , 43, pp 97-99. [22] Wolf, J. R. (1852). New studies of the period of Sunspots and their meanings; Communications of Natural History; Society in Bern, 255, pp 249-270. |