S. S. CHEN ET AL.
Copyright © 2013 SciRes. ENG
son with the true model. Here we configure a typical
double-peak T2 spectrum as a model, and then we obtain
the noiseless echo string by forward modeling. The algo-
rithm is developed and the codes are written in Matlab,
you can obtain the codes by requesting the first author.
The algorithms can take the users inputs : number of echo
string, number of pre-assigned relaxation time constants,
SNR of the measured data.
Those procedures can use the noiseless echoes as input
signals, and relaxation inversion spectrums are the output
of the algorithms. Compared with the configured spec-
trum, we can test the accuracy of algorithm. Because
noise is one of the important factors affecting the inver-
sion precision, SNR effect is studied by creating the si-
mulated data which is added Gaussian white noise with
SNR level from 10 through 100. Those algorithms are
run on the simulated data to obtain the computed distri-
butions. Meanw hile for experimental validation of the
methods, we collected three groups of spin-echo signals
produced by yoghurt and oils in PQ-001 NMR analyzer
in our laboratory We must take into account the problem
that the abscissa of T2 spectra is more than three orders
of magnitude (T2min = 0.1 ms and T2max = 10000 ms). As
time increases, the signal will attenuate to none and the
T2 component will reduce too. Thus we choose with lo-
garithms equally spaced from 0.1 ms to 10000 ms [11-
13].
4. Results
4.1. Simulated Ideal Model
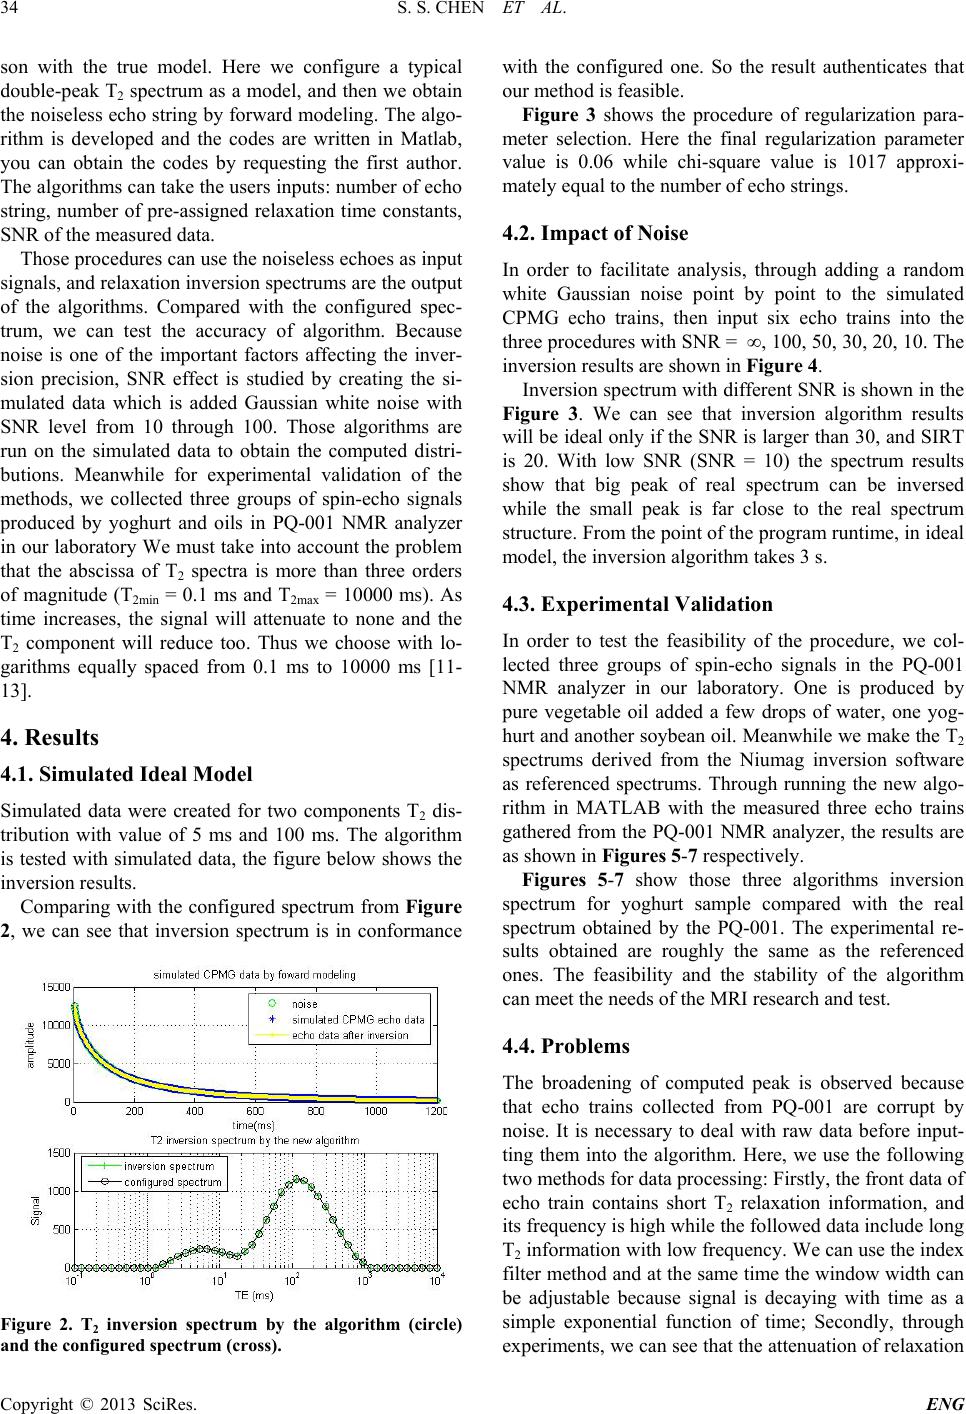
Simulated data were created for two components T2 dis-
tribution with value of 5 ms and 100 ms. The algorithm
is tested with simulated data, the figure below shows the
inversi o n re s ults.
Comparing with the configured spectrum from Fig ure
2, we can see that inversion spectrum is in conformance
Figure 2. T2 inversion spectrum by the algorithm (circle)
and the confi gu red spectrum (cross).
with the configured one. So the result authenticates that
our method is feasible.
Figure 3 shows the procedure of regularization para-
meter selection. Here the final regularization parameter
value is 0.06 while chi-square value is 1017 approxi-
mately equal to the number of echo strings.
4.2. Impact of Noise
In order to facilitate analysis, through adding a random
white Gaussian noise point by point to the simulated
CPMG echo trains, then input six echo trains into the
three procedures with SNR = ∞, 100, 50, 30, 20, 10. The
inversi o n re s ults are shown in Figure 4.
Inversion spectrum with different SNR is shown in the
Figure 3. We can see that inversion algorithm results
will be ideal only if the SNR is larger th an 30, and SIRT
is 20. With low SNR (SNR = 10) the spectrum results
show that big peak of real spectrum can be inversed
while the small peak is far close to the real spectrum
structure. From the point of the program runtime, in ideal
model, the inversion algorithm takes 3 s.
4.3. Experimental Validation
In order to test the feasibility of the procedure, we col-
lected three groups of spin-echo signals in the PQ-001
NMR analyzer in our laboratory. One is produced by
pure vegetable oil added a few drops of water, one yog-
hurt and another soybean oil. Meanwhile we make the T2
spectrums derived from the Niumag inversion software
as referenced spectrums. Through running the new algo-
rithm in MATLAB with the measured three echo trains
gathered from the PQ-001 NMR analyz er, the results are
as shown in Figures 5-7 respectively.
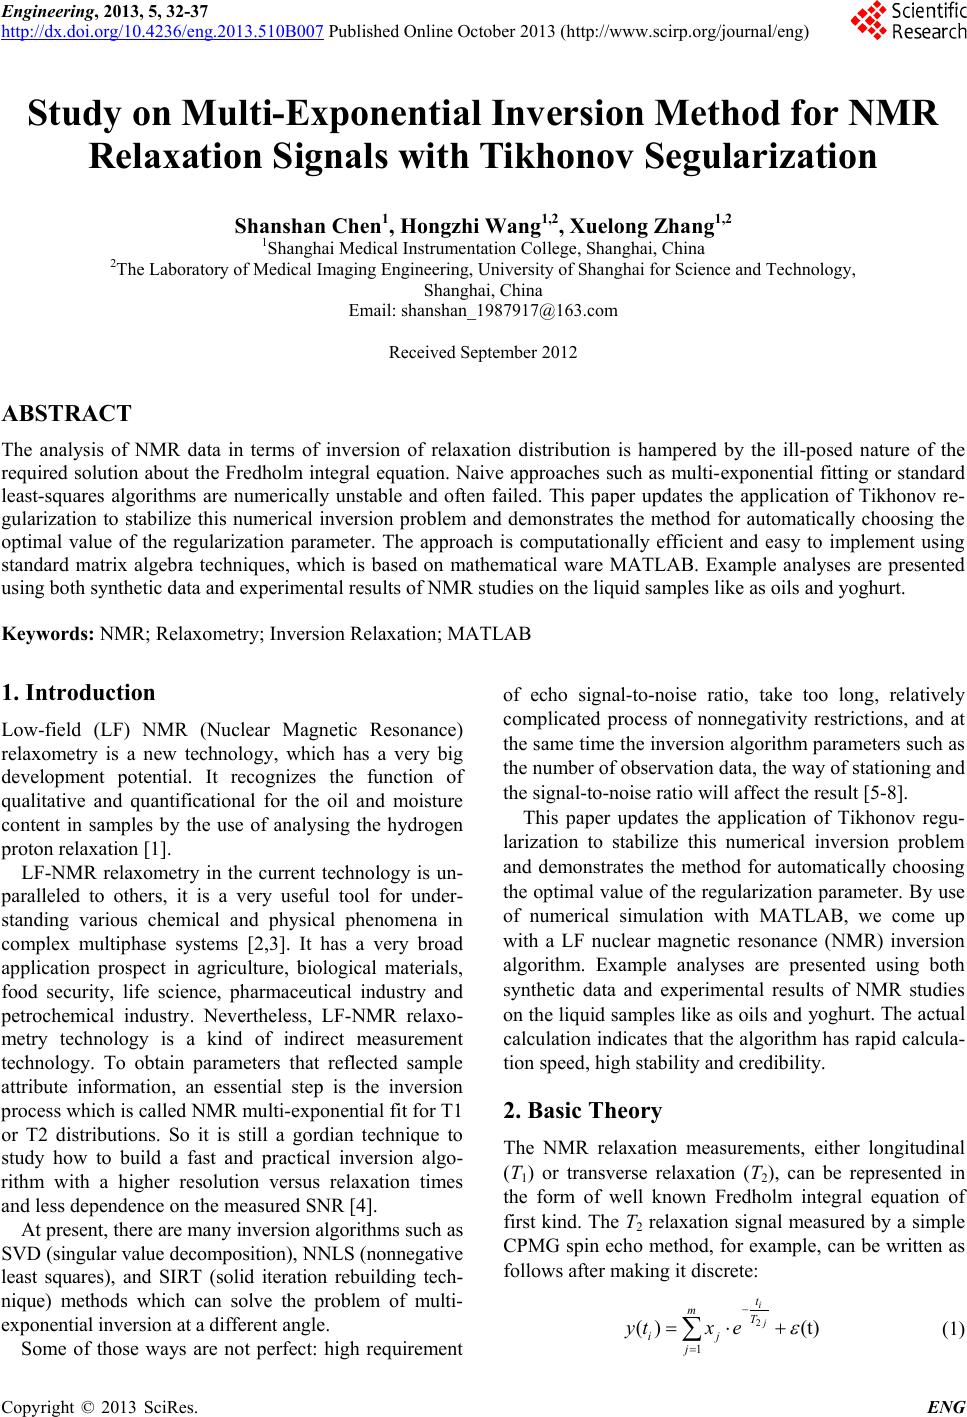
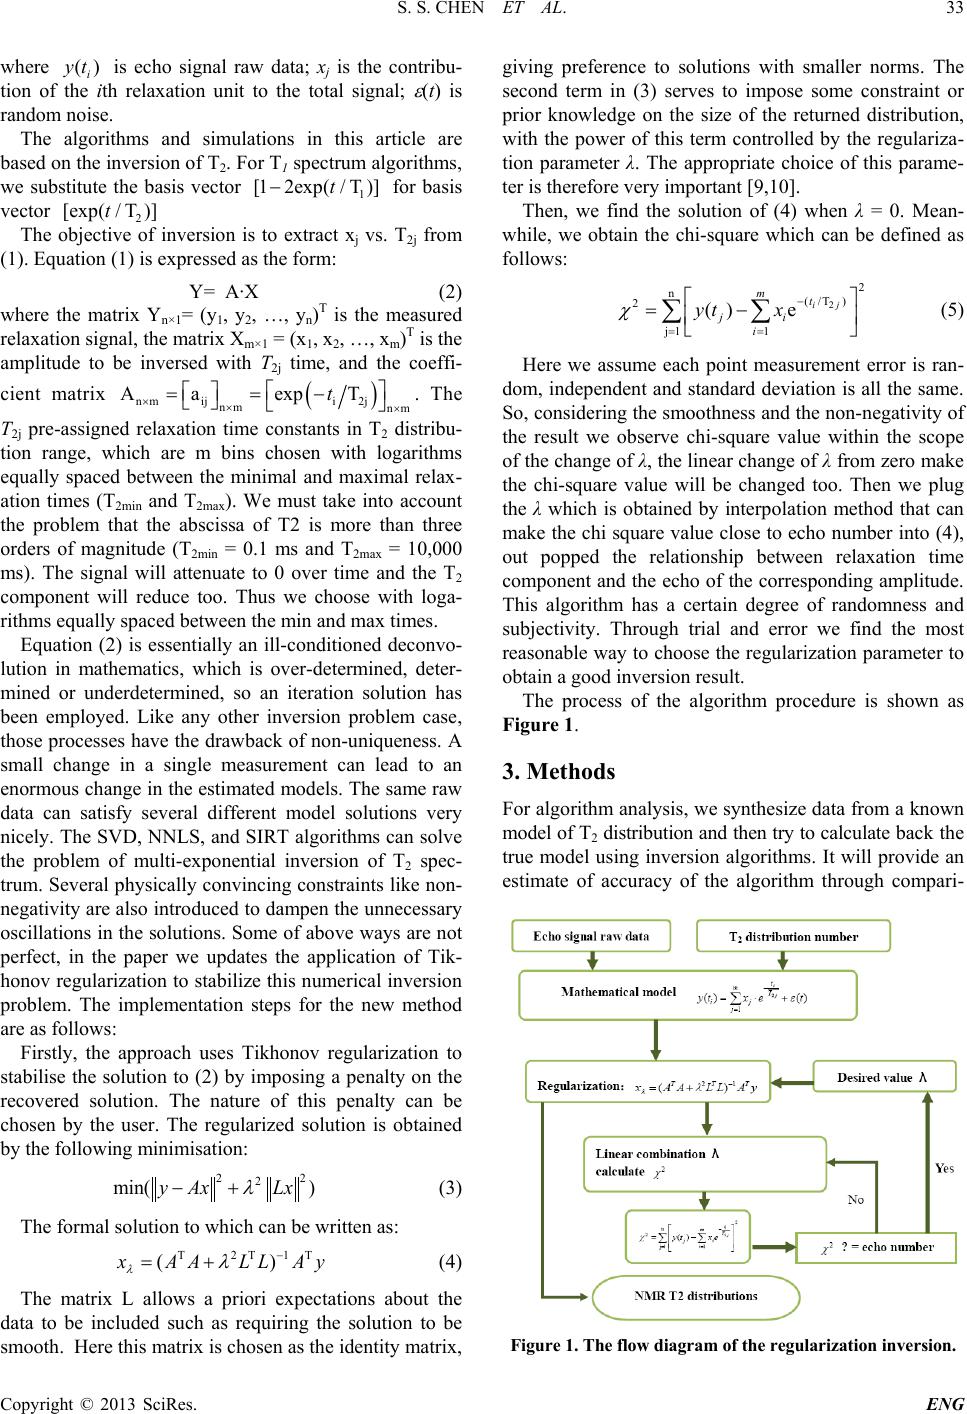
Figures 5-7 show those three algorithms inversion
spectrum for yoghurt sample compared with the real
spectrum obtained by the PQ-001. The experimental re-
sults obtained are roughly the same as the referenced
ones. The feasibility and the stability of the algorithm
can meet the needs of the MRI research and test.
4.4. Problems
The broadening of computed peak is observed because
that echo trains collected from PQ-001 are corrupt by
noise. It is necessary to deal with raw data before input-
ting them into the algorithm. Here, we use the following
two methods for data processing: Firstly, the front data of
echo train contains short T2 relaxation information, and
its frequency is high while the followed data include long
T2 information with low frequency. We can use the index
filter method and at the same time the window width can
be adjustable because signal is decaying with time as a
simple exponential function of time; Secondly, through
experiments, we can see that the attenuation of relaxation