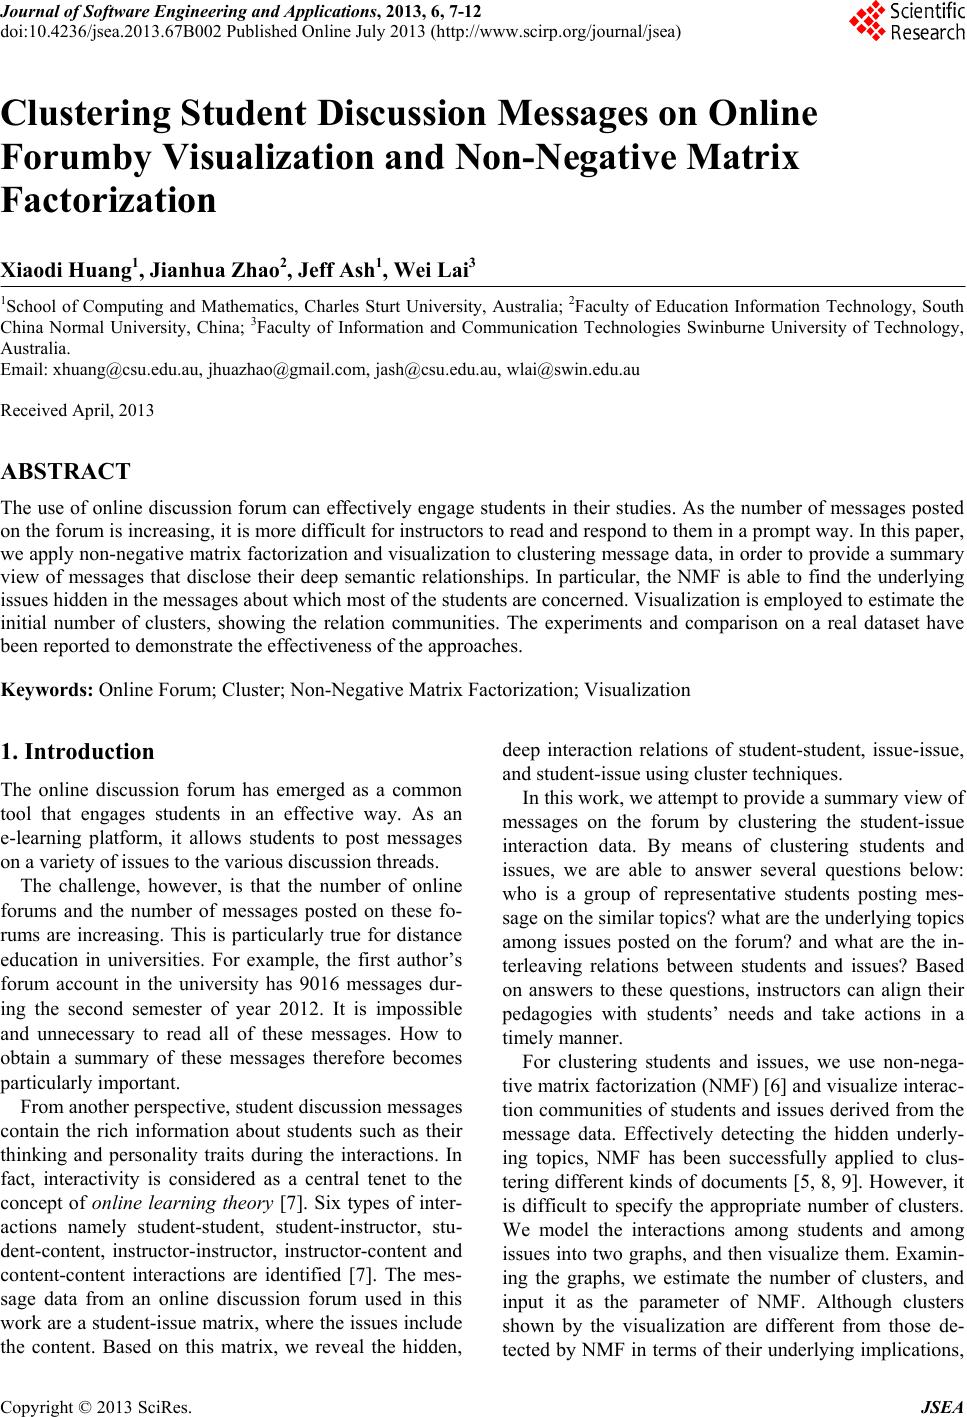
 Journal of Software Engineering and Applications, 2013, 6, 7-12 doi:10.4236/jsea.2013 .67B002 Published Online July 2013 (http://www.scirp.org/journal/jsea) Clustering Student Discussion Messages on Online Forumby Visualization and Non-Negative Matrix Factorization Xiaodi Huang1, Jianhua Zhao2, Jeff Ash1, Wei Lai3 1School of Computing and Mathematics, Charles Sturt University, Australia; 2Faculty of Education Information Technology, South China Normal University, China; 3Faculty of Information and Communication Technologies Swinburne University of Technology, Australia. Email: xhuang@csu.edu . au, jhuazhao@gmail.com, jash@csu.edu.au, wlai@swin.edu.au Received April, 2013 ABSTRACT The use of online discussion forum can effectively engage students in their studies. As the number of messages posted on the forum is increasing, it is more difficult for instructors to read and respond to th em in a prompt way. In this paper, we apply non-negativ e matrix factorization and visualization to clustering message data, in order to provide a summary view of messages that disclose their deep semantic relationships. In particular, the NMF is able to find the underlying issues hidden in the messages about which most of the students are concerned. Visualization is employed to estimate the initial number of clusters, showing the relation communities. The experiments and comparison on a real dataset have been reported to demonstrate the effectiveness of the approaches. Keywords: Online Forum; Cluster; Non-Negative Matrix Factorization; Visualization 1. Introduction The online discussion forum has emerged as a common tool that engages students in an effective way. As an e-learning platform, it allows students to post messages on a variety of issues to the various discussion threads. The challenge, however, is that the number of online forums and the number of messages posted on these fo- rums are increasing. This is particularly true for distance education in universities. For example, the first author’s forum account in the university has 9016 messages dur- ing the second semester of year 2012. It is impossible and unnecessary to read all of these messages. How to obtain a summary of these messages therefore becomes particularly important. From another perspective, student discussion messages contain the rich information about students such as their thinking and personality traits during the interactions. In fact, interactivity is considered as a central tenet to the concept of online learning theory [7]. Six types of inter- actions namely student-student, student-instructor, stu- dent-content, instructor-instructor, instructor-content and content-content interactions are identified [7]. The mes- sage data from an online discussion forum used in this work are a student-issue matrix, where the issues include the content. Based on this matrix, we reveal the hidden, deep interaction relations of student-student, issue-issue, and student-issue using cluster techniques. In this work, we attempt to p rov ide a su mmary v iew of messages on the forum by clustering the student-issue interaction data. By means of clustering students and issues, we are able to answer several questions below: who is a group of representative students posting mes- sage on the similar topics? what are the underlying topics among issues posted on the forum? and what are the in- terleaving relations between students and issues? Based on answers to these questions, instructors can align their pedagogies with students’ needs and take actions in a timely manner. For clustering students and issues, we use non-nega- tive matrix factorization (NMF) [6] and visualize interac- tion communities of students and issu es derived from the message data. Effectively detecting the hidden underly- ing topics, NMF has been successfully applied to clus- tering different kinds of documents [5, 8, 9]. However, it is difficult to specify the appropriate number of clusters. We model the interactions among students and among issues into two graphs, and then visualize them. Examin- ing the graphs, we estimate the number of clusters, and input it as the parameter of NMF. Although clusters shown by the visualization are different from those de- tected by NMF in terms of their underlying implications, Copyright © 2013 SciRes. JSEA 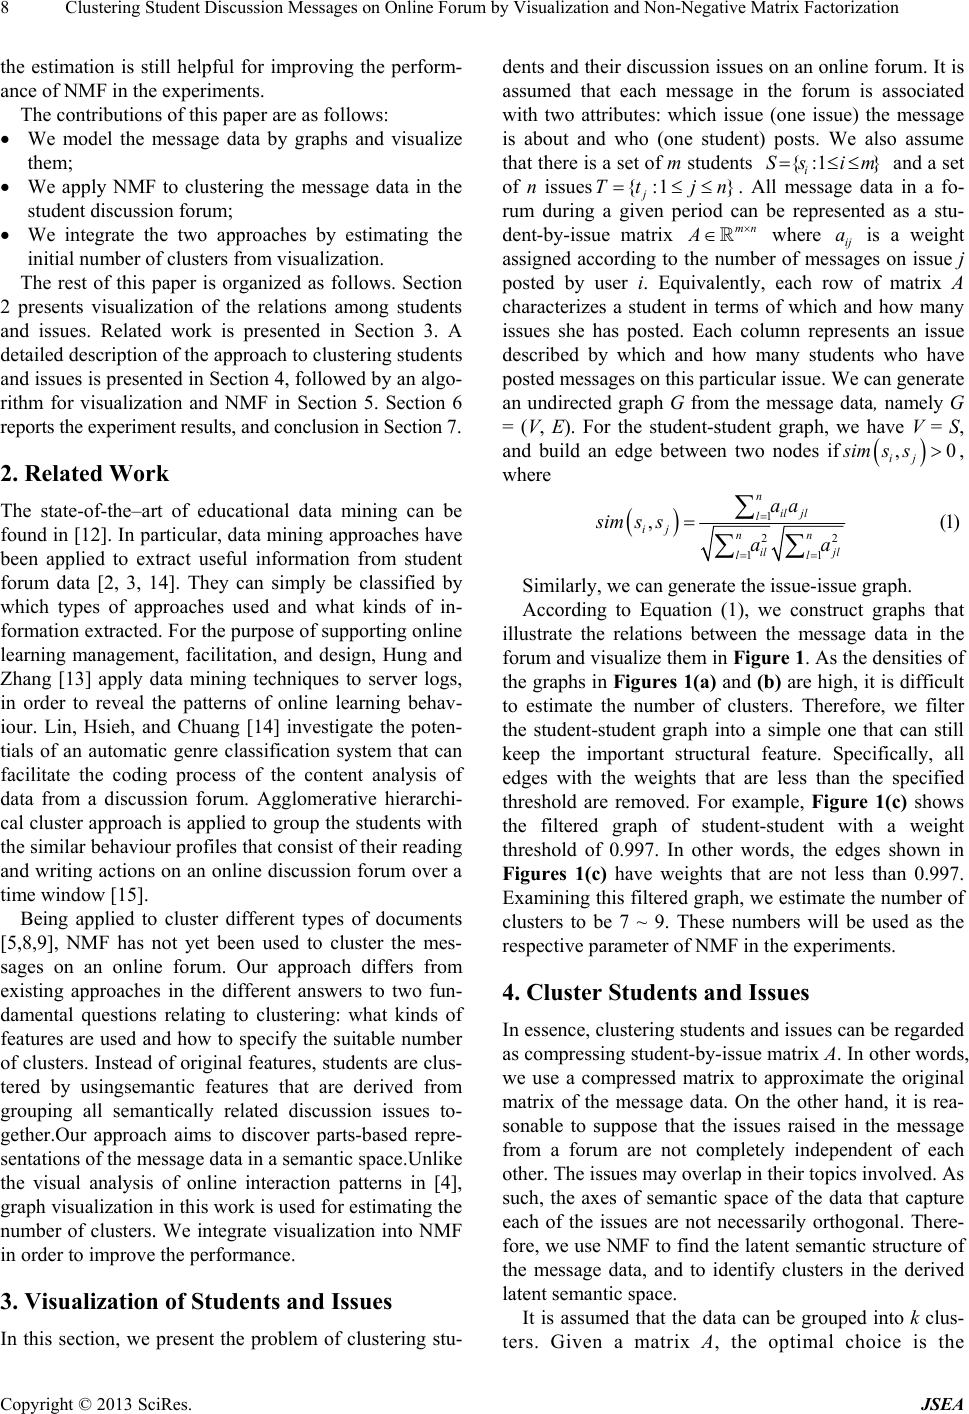 Clusterin g Student Discussion Messages on On line Forum by Visualiz a tion and Non-Negative Matrix Factorization 8 the estimation is still helpful for improving the perform- ance of NMF in the experiments. The contributions of this paper are as follows: We model the message data by graphs and visualize them; We apply NMF to clustering the message data in the student di sc ussion for um; We integrate the two approaches by estimating the initial number of clusters from visualization. The rest of this paper is organized as follows. Section 2 presents visualization of the relations among students and issues. Related work is presented in Section 3. A detailed description of the approach to clustering students and issues is presented in Section 4, follo wed by an algo- rithm for visualization and NMF in Section 5. Section 6 reports the experiment result s, and conclusion i n Section 7. 2. Related Work The state-of-the–art of educational data mining can be found in [12]. In particular, data mining approaches have been applied to extract useful information from student forum data [2, 3, 14]. They can simply be classified by which types of approaches used and what kinds of in- formation extracted. For the purpose of supporting online learning management, facilitation, and design, Hung and Zhang [13] apply data mining techniques to server logs, in order to reveal the patterns of online learning behav- iour. Lin, Hsieh, and Chuang [14] investigate the poten- tials of an automatic genre classification system that can facilitate the coding process of the content analysis of data from a discussion forum. Agglomerative hierarchi- cal cluster approach is applied to group the students with the similar behaviour profiles that consist of their reading and writing actions on an online discu ssion forum over a time window [15]. Being applied to cluster different types of documents [5,8,9], NMF has not yet been used to cluster the mes- sages on an online forum. Our approach differs from existing approaches in the different answers to two fun- damental questions relating to clustering: what kinds of features ar e used and how to specify the suitable number of clusters. Instead of original features, students are clus- tered by usingsemantic features that are derived from grouping all semantically related discussion issues to- gether.Our approach aims to discover parts-based repre- sentations of the message data in a semantic space.Unlike the visual analysis of online interaction patterns in [4], graph visu alization in th is work is us ed for esti mating th e number of clusters. We integrate visualization into NMF in order to improve the performance. 3. Visualization of Students and Issues In this section, we present the problem of clustering stu- dents and their discussion issues on an online forum. It is assumed that each message in the forum is associated with two attributes: which issue (one issue) the message is about and who (one student) posts. We also assume that there is a set of m students and a set of n issues{:1 } i Ss im {:1 } j Tt jn . All message data in a fo- rum during a given period can be represented as a stu- dent-by-issue matrix mn where ij is a weight assigned according to the number of messages on issue j posted by user i. Equivalently, each row of matrix A characterizes a student in terms of which and how many issues she has posted. Each column represents an issue described by which and how many students who have posted messages on this particular issue. We can generate an undirected graph G from the message data, namely G = (V, E). For the student-student graph, we have V = S, and build an edge between two nodes if a ,0 ij ssim s, where 1 22 11 ,( n il jl l ij nn il jl ll aa sim ssaa 1) Similarly, we can generate the issue-issue graph. According to Equation (1), we construct graphs that illustrate the relations between the message data in the forum and visualize them in Figure 1. As the densities of the graphs in Figures 1(a) and (b) are high, it is difficult to estimate the number of clusters. Therefore, we filter the student-student graph into a simple one that can still keep the important structural feature. Specifically, all edges with the weights that are less than the specified threshold are removed. For example, Figure 1(c) shows the filtered graph of student-student with a weight threshold of 0.997. In other words, the edges shown in Figures 1(c) have weights that are not less than 0.997. Examining this filtered graph, we estimate the number of clusters to be 7 ~ 9. These numbers will be used as the respective parameter of NMF in the experiments. 4. Cluster Students and Issues In essence, clustering students and issues can be regarded as compressing student-by-issue matrix A. In other words, we use a compressed matrix to approximate the original matrix of the message data. On the other hand, it is rea- sonable to suppose that the issues raised in the message from a forum are not completely independent of each other. The issues may overlap in their topics involved. As such, the axes of semantic space of the data that capture each of the issues are not necessarily orthogonal. There- fore, we use NMF to find the latent semantic structure of the message data, and to identify clusters in the derived latent semantic space. It is assumed that the data can be grouped into k clus- ters. Given a matrix A, the optimal choice is the Copyright © 2013 SciRes. JSEA 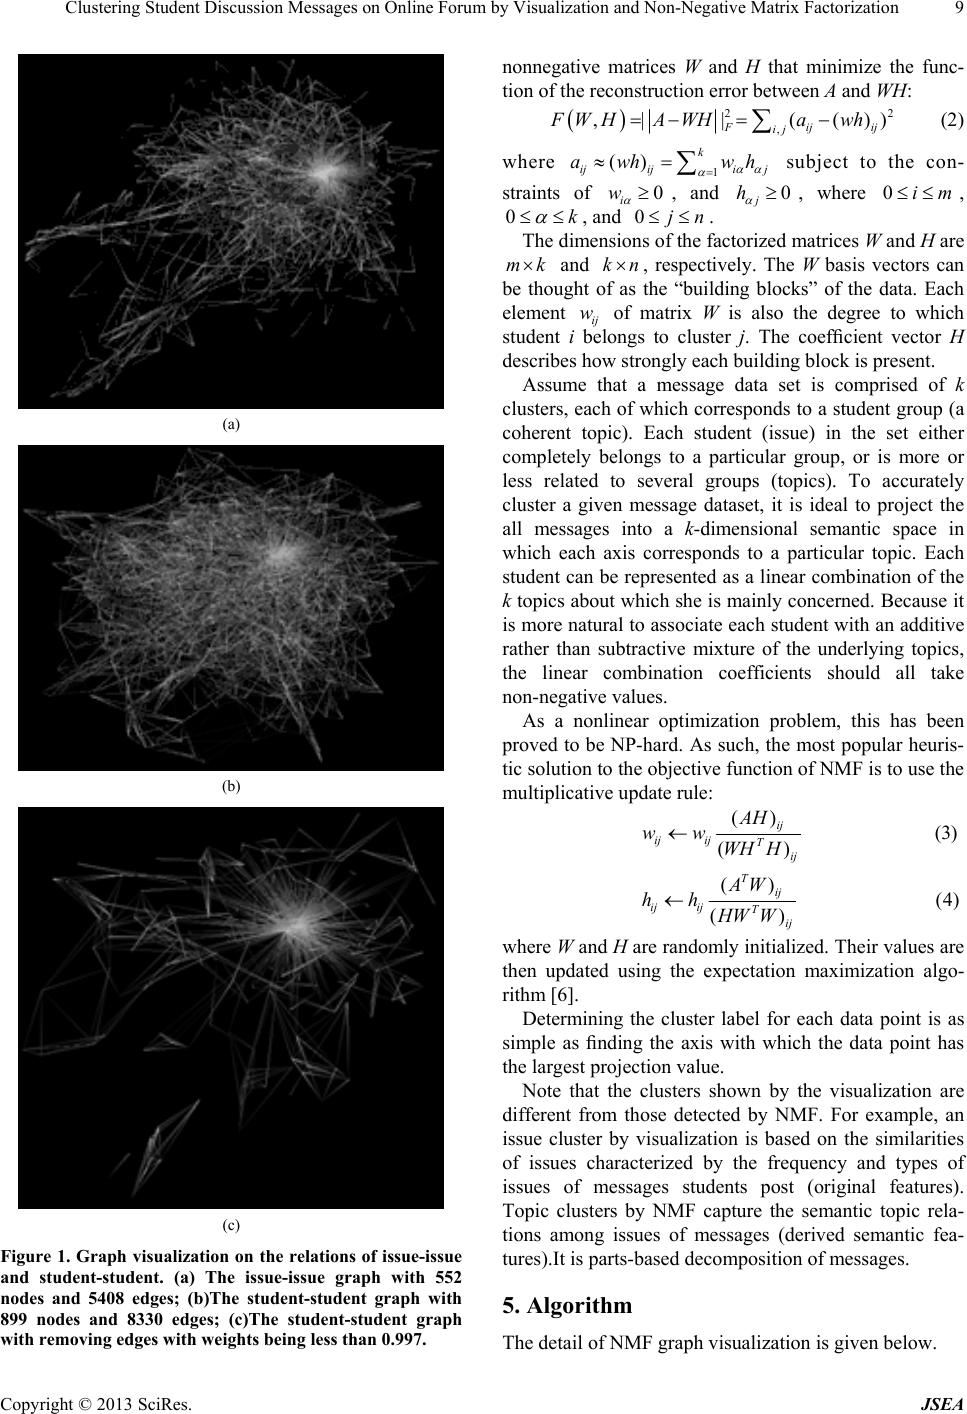 Clusterin g Student Discuss ion Messages on Online Forum by Visualiz ation and Non-N egative Matrix Factorization 9 (a) (b) (c) Figure 1. Graph visualization on the relations of issue-issue and student-student. (a) The issue-issue graph with 552 nodes and 5408 edges; (b)The student-student graph with 899 nodes and 8330 edges; (c)The student-student graph with removing edges with weights being less than 0.997. nonnegative matrices W and H that minimize the func- tion of the reconstruction error betwee n A and WH: 22 , ,|| (()) Fij ij FWHA WHawh ij (2) where 1 () k ijiji j awh wh subject to the con- straints of , and , where 00 i w 0 j h im , 0k , and 0jn . The dimensions of the factorized matrices W and H are mk and kn , respectively. The W basis vectors can be thought of as the “building blocks” of the data. Each element ij of matrix W is also the degree to which student i belongs to cluster j. The coefficient vector H describes how strongly eac h b uilding block is present. w Assume that a message data set is comprised of k clusters, each of which corresponds to a student group (a coherent topic). Each student (issue) in the set either completely belongs to a particular group, or is more or less related to several groups (topics). To accurately cluster a given message dataset, it is ideal to project the all messages into a k-dimensional semantic space in which each axis corresponds to a particular topic. Each student can be represented as a linear combination of the k topics about which she is mainly concerned. Because it is more natural to associate each student with an additive rather than subtractive mixture of the underlying topics, the linear combination coefficients should all take non-negative values. As a nonlinear optimization problem, this has been proved to be NP-hard. As such, the most popular heuris- tic solution to the objective function of NMF is to use the multiplicative update rule: () (3) () () (4) () ij ij ijTij Tij ij ijTij AH ww WH H AW hh HW W where W and H are randomly initialized. Their values are then updated using the expectation maximization algo- rithm [6]. Determining the cluster label for each data point is as simple as finding the axis with which the data point has the largest projection value. Note that the clusters shown by the visualization are different from those detected by NMF. For example, an issue cluster by visualization is based on the similarities of issues characterized by the frequency and types of issues of messages students post (original features). Topic clusters by NMF capture the semantic topic rela- tions among issues of messages (derived semantic fea- tures).It is parts-based decomposition of messages. 5. Algorithm The detail of NMF graph visualization is given below. Copyright © 2013 SciRes. JSEA 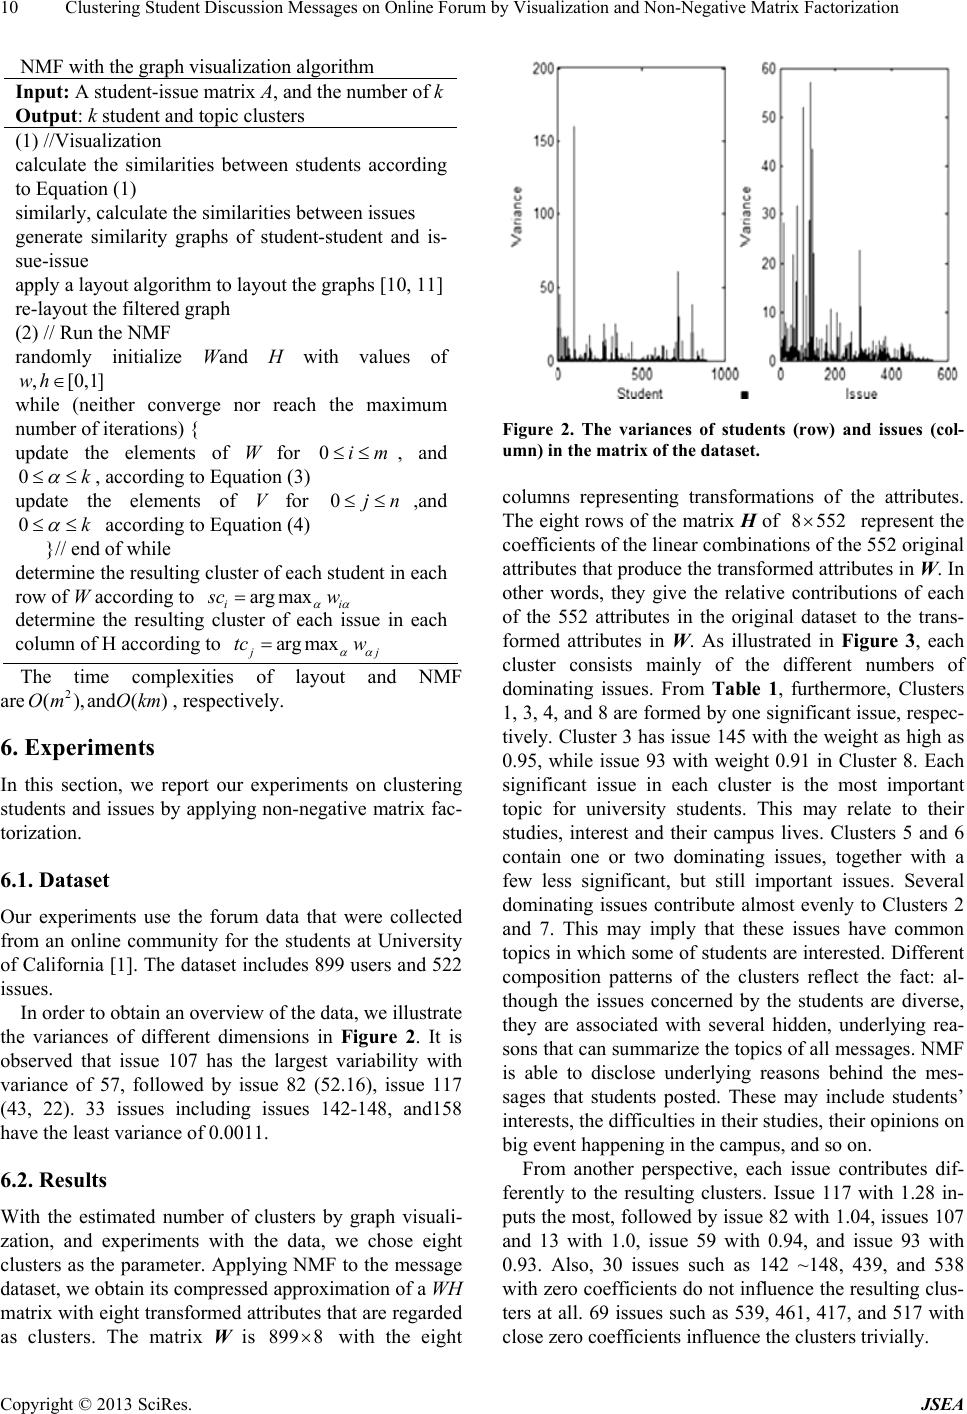 Clusterin g Student Discussion Messages on On line Forum by Visualiz a tion and Non-Negative Matrix Factorization 10 NMF with the graph visualization algorithm Input: A student-issue matrix A, and the number of k Output: k student and topic clusters (1) //Visualization calculate the similarities between students according to Equation (1) similarly, calculate the similarities between issues generate similarity graphs of student-student and is- sue-issue apply a layout algorithm to layout the graphs [10, 11] re-layout the filtered graph (2) // Run the NMF randomly initialize Wand H with values of ,[0,1wh] while (neither converge nor reach the maximum number of iterations) { update the elements of W for , and 0im 0k , according to Equation (3) update the elements of V for 0,and jn 0k according to Equation (4) }// end of while determine the resulting cluster of each student in each row of W according to argmax ii cw determine the resulting cluster of each issue in each column of H according to argm ax j tc w The time complexities of layout and NMF are , respectively. 2 (),and()Om Okm 6. Experiments In this section, we report our experiments on clustering students and issues by applying non-negative matrix fac- torization. 6.1. Dataset Our experiments use the forum data that were collected from an online community for the students at University of California [1]. The dataset includes 899 us ers and 522 issues. In order to obtain an overview of the data, we illustrate the variances of different dimensions in Figure 2. It is observed that issue 107 has the largest variability with variance of 57, followed by issue 82 (52.16), issue 117 (43, 22). 33 issues including issues 142-148, and158 have the least variance of 0.0011. 6.2. Results With the estimated number of clusters by graph visuali- zation, and experiments with the data, we chose eight clusters as the parameter. Applying NMF to the message dataset, we obtain its compressed approximation of a WH matrix with eight transformed attributes that are regarded as clusters. The matrix W is 89 with the eight 9 8 Figure 2. The variances of students (row) and issues (col- umn) in the matrix of the dataset. columns representing transformations of the attributes. The eight rows of the matrix H of represent the coefficients of the linear combinations of the 552 original attributes that produce the transformed attributes in W. In other words, they give the relative contributions of each of the 552 attributes in the original dataset to the trans- formed attributes in W. As illustrated in Figure 3, each cluster consists mainly of the different numbers of dominating issues. From Table 1, furthermore, Clusters 1, 3, 4, and 8 are formed by one significant issue, respec- tively. Cluster 3 has issue 145 with the weight as high as 0.95, while issue 93 with weight 0.91 in Cluster 8. Each significant issue in each cluster is the most important topic for university students. This may relate to their studies, interest and their campus lives. Clusters 5 and 6 contain one or two dominating issues, together with a few less significant, but still important issues. Several dominating issues contribute almost evenly to Clusters 2 and 7. This may imply that these issues have common topics in which some of students are interested. Different composition patterns of the clusters reflect the fact: al- though the issues concerned by the students are diverse, they are associated with several hidden, underlying rea- sons that can summarize the topics of all messages. NMF is able to disclose underlying reasons behind the mes- sages that students posted. These may include students’ interests, the difficulties in their studies, their opinions on big event happening in the campus, and so on. 8552 From another perspective, each issue contributes dif- ferently to the resulting clusters. Issue 117 with 1.28 in- puts the most, followed by issue 82 with 1.04, issues 107 and 13 with 1.0, issue 59 with 0.94, and issue 93 with 0.93. Also, 30 issues such as 142 ~148, 439, and 538 with zero coefficients do not influence the resulting clus- ters at all. 69 issues such as 539, 461, 417, and 517 with close zero coefficients influence the clusters trivially. Copyright © 2013 SciRes. JSEA 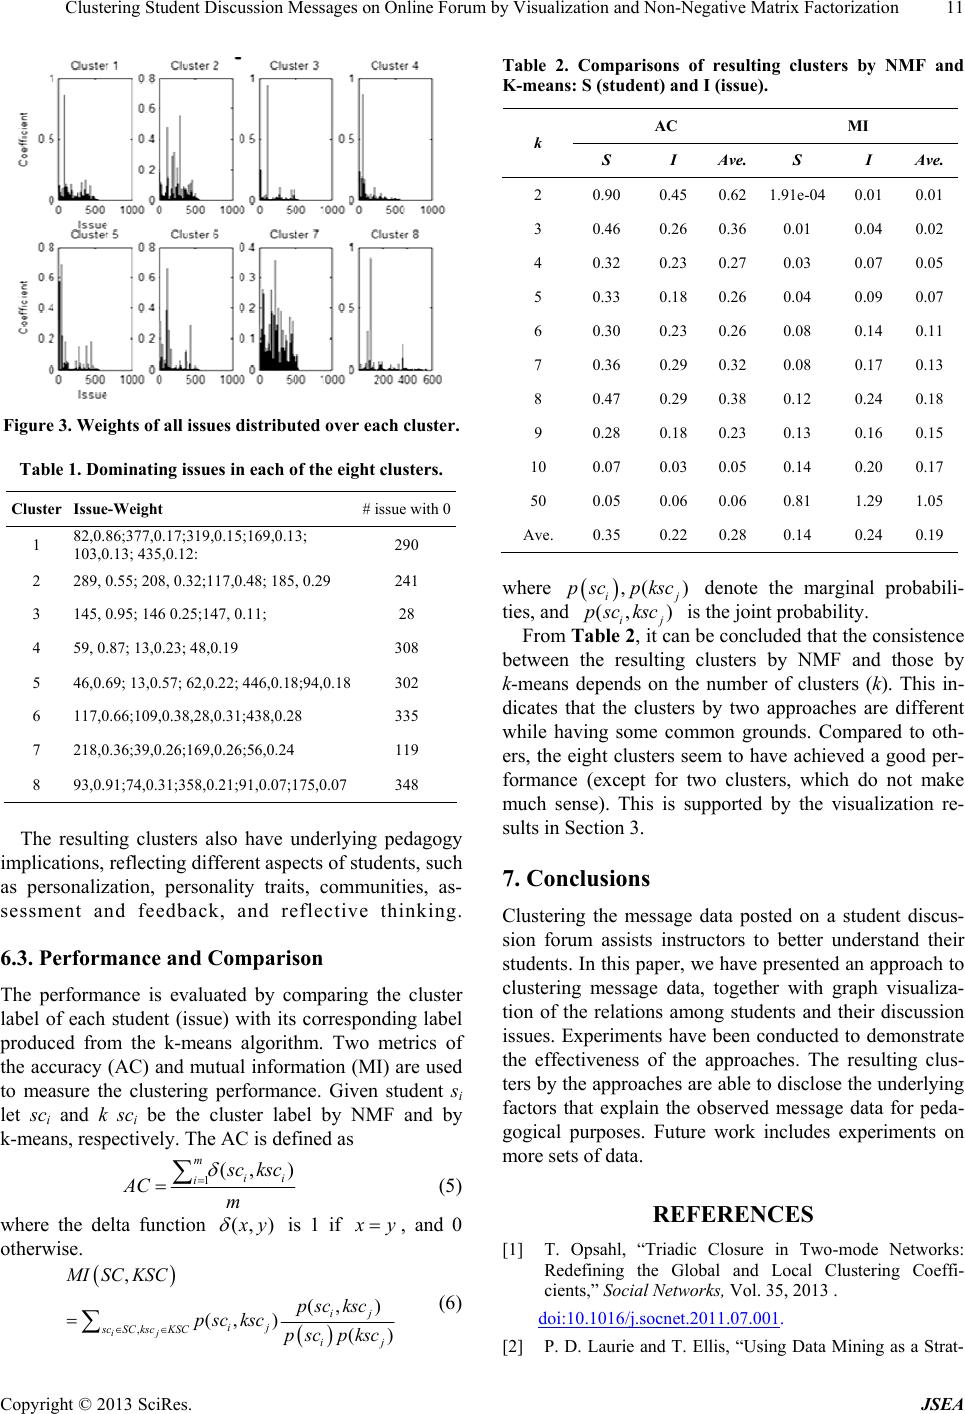 Clusterin g Student Discuss ion Messages on Online Forum by Visualiz ation and Non-N egative Matrix Factorization 11 Figure 3. Weights of all issues distributed over each cluster. Table 1. Dominating issues in each of the eight clusters. Cluster Issue-Weight # issue with 0 1 82,0.86;377,0.17;319,0.15;169,0.13; 103,0.13; 435,0.12: 290 2 289, 0.55; 208, 0.32;117,0.48; 185, 0.29 241 3 145, 0.95; 146 0.25;147, 0.11; 28 4 59, 0.87; 13,0.23; 48,0.19 308 5 46,0.69; 13,0.57; 62,0.22; 446,0.18;94,0.18 302 6 117,0.66;109,0.38,28,0.31;438,0.28 335 7 218,0.36;39,0.26;169,0.26;56,0.24 119 8 93,0.91;74,0.31;358,0.21;91,0.07;175,0.07 348 The resulting clusters also have underlying pedagogy implications, reflecting different aspects of students, such as personalization, personality traits, communities, as- sessment and feedback, and reflective thinking. 6.3. Performance and Comparison The performance is evaluated by comparing the cluster label of each student (issue) with its corresponding label produced from the k-means algorithm. Two metrics of the accuracy (AC) and mutual information (MI) are used to measure the clustering performance. Given student si let sci and k sci be the cluster label by NMF and by k-means, respectively. The AC is defined as 1(, ) m ii i cksc AC m (5) where the delta function (,) y is 1 if y, and 0 otherwise. , , (, ) (, )() ij ij ij scSC kscKSCij MISC KSC psc ksc psc kscpsc pksc (6) Table 2. Comparisons of resulting clusters by NMF and K-means: S (student) and I (issue). AC MI k S I Ave. S I Ave. 2 0.90 0.45 0.62 1.91e-04 0.01 0.01 3 0.46 0.26 0.36 0.01 0.04 0.02 4 0.32 0.23 0.27 0.03 0.07 0.05 5 0.33 0.18 0.26 0.04 0.09 0.07 6 0.30 0.23 0.26 0.08 0.14 0.11 7 0.36 0.29 0.32 0.08 0.17 0.13 8 0.47 0.29 0.38 0.12 0.24 0.18 9 0.28 0.18 0.23 0.13 0.16 0.15 10 0.07 0.03 0.05 0.14 0.20 0.17 50 0.05 0.06 0.06 0.81 1.29 1.05 Ave. 0.35 0.22 0.28 0.14 0.24 0.19 where ,() i pscpksc (, ) ij psc kscj denote the marginal probabili- ties, and is the joint probability. From Table 2, it can be concluded that the consistence between the resulting clusters by NMF and those by k-means depends on the number of clusters (k). This in- dicates that the clusters by two approaches are different while having some common grounds. Compared to oth- ers, the eight clusters seem to have achieved a good per- formance (except for two clusters, which do not make much sense). This is supported by the visualization re- sults in Section 3. 7. Conclusions Clustering the message data posted on a student discus- sion forum assists instructors to better understand their students. In this paper, we have presented an approach to clustering message data, together with graph visualiza- tion of the relations among students and their discussion issues. Experiments have been conducted to demonstrate the effectiveness of the approaches. The resulting clus- ters by the approaches are able to disclose the underlying factors that explain the observed message data for peda- gogical purposes. Future work includes experiments on more sets of data. REFERENCES [1] T. Opsahl, “Triadic Closure in Two-mode Networks: Redefining the Global and Local Clustering Coeffi- cients,” Social Networks, Vol. 35, 2013 . doi:10.1016/j.socnet.2011.07.001. [2] P. D. Laurie and T. Ellis, “Using Data Mining as a Strat- Copyright © 2013 SciRes. JSEA  Clusterin g Student Discussion Messages on On line Forum by Visualiz a tion and Non-Negative Matrix Factorization Copyright © 2013 SciRes. JSEA 12 egy for Assessing Asynchronous Ddiscussion Forums,” Computers & Education, Vol. 45, No. 1, 2005, pp. 141-160. doi:10.1016/j.compedu.2004.05.003 [3] N. Lia and D. D. Wub, “Using Text Mining and Senti- ment Analysis for Online Forums Hotspot Detection and Forecast,” Decision Support Systems, Vol. 48, No. 2, 2010, pp. 354-368. doi:10.1016/j.dss.2009.09.003 [4] A. Silva, “Visual Analysis of Online In teractions through Social Network Patterns,” IEEE 12th International Con- ference on Advanced Learning Technologies (ICALT), 2012, pp. 639- 641. [5] X. Huang, X. Zheng, W. Yuan, F. Wang and S. Zhu, “En- hanced Clustering of Biomedical Documents Using En- semble Non-negative Matrix Factorization”, Information Sciences, Vol. 181, No.11, 2011, pp. 2293-2302. doi:10.1016/j.ins.2011.01.029 [6] D. D. Lee, H. S. Seung, “Learning the parts of ob jects by non-negative matrix factorization”, Nature, 401, 1999, pp.788-791. doi:10.1038/44565 [7] T. Anderson, towards a theory of online learning. In T. Anderson, & F. Elloumi (Eds.), Theory and practice of online learning, pp. 33-60, 2004, Athabasca University Press. [8] W. Xu, X. Liu and Y. Gong, “Document clu stering based on non-neg ative matrix facto rization”, Pro ceedings of the 26th annual intern ational ACM SIGIR conference on Re- search and developmen t in in formation retriev al, 2003 , pp . 267-273. [9] C. Ding, T. Li and W. Peng, “Orthogonal nonnegative matrix t-factorizations for clustering”, Proceedings of the 12th ACM SIGKDD international conference on Knowl- edge discovery and data mining, 2006, pp. 126-135. doi:10.1145/1150402.1150420 [10] X. Huang and W. Lai, “Clustering Graphs for Visualiza- tion via Node Similarities”, Journal of Visual Languages and Computing, Vol.17, No.3, 2006, pp. 225-253. doi:10.1016/j.jvlc.2005.10.003 [11] X. Huang, W. Lai, A. S. M. Sajeev and J. Gao, “A New Algorithm to Remove Overlapping Nodes in Graph Lay- out”, Information Sciences, Vol. 177, No. 14, 2007, pp. 2821-2844. doi:10.1016/j.ins.2007.02.016 [12] C. R. Romero and S. Ventura, “Educational Data Mining: A Review of the State of the Art.” IEEE Transactions on Systems, Man and Cybernetics, Part C: Applications an- dReviewsVol.40, No.6, 2010, pp. 601–618. [13] J. Hung and K. Zhang, “Revealing online learning be- haviours and activity patterns and making predictions with data mining techniques in online teaching” MER- LOT Journal of Online Learning and Teaching, Vol.4, No.4, 2008. [14] F.-R. Lin, L.-S. Hsieh and &F.-T. Chuang, “Discovering genres of online discussion threads via text mining”, Computers &Education, Vol.52, No.2, 2009, pp.481-495. doi:10.1016/j.compedu.2008.10.005 [15] G. Codo, D. Garcia, E. Santamaria, J. A. Moran, J. Mel- enchon and C. Monzo, “Modelling students’ activity in online discussion forms: a strategy based on time series and agglomerative hierarchical clustering”, Proceedings of Educational Data Mining, pp.253-258, 2011.
|