Open Journal of Geology, 2013, 3, 34-37
doi:10.4236/ojg.2013.32B008 Published Online April 2013 (http://www.scirp.org/journal/ojg)
Electrical Resistivity Survey in Bukit Bunuh, Malaysia for
Subsurface Structure of Meteorite Impact Study
Mark Jinmin1*, Rosli Saad1, Mokhtar Saidin2, Andy A. Bery1
1Geophysics Section, School of Physics, Universiti Sains Malaysia, Penang, Malaysia
2Centre for Global Archaeological Research, Universiti Sains Malaysia, Penang, Malaysia
Email: markjinmin@yahoo.co.uk
Received 2013
ABSTRACT
An electrical resistivity tomography (ERT) study was conducted at Bukit Bunuh, Lenggong Perak (Malaysia). The
study is to justify the features and environmental subsurface geological structure which is due to the meteorite impact.
The ERT survey used resistivity equipments comprises of 4 survey lines with 5 m electrode intervals, covering an area
of approximately 64 km2. The survey lines were carried out using ‘roll-along’ technique. The data were processed and
analysed using RES2DINV, Excel and Surfer software in order to produce electrical resistivity tomography for qualita-
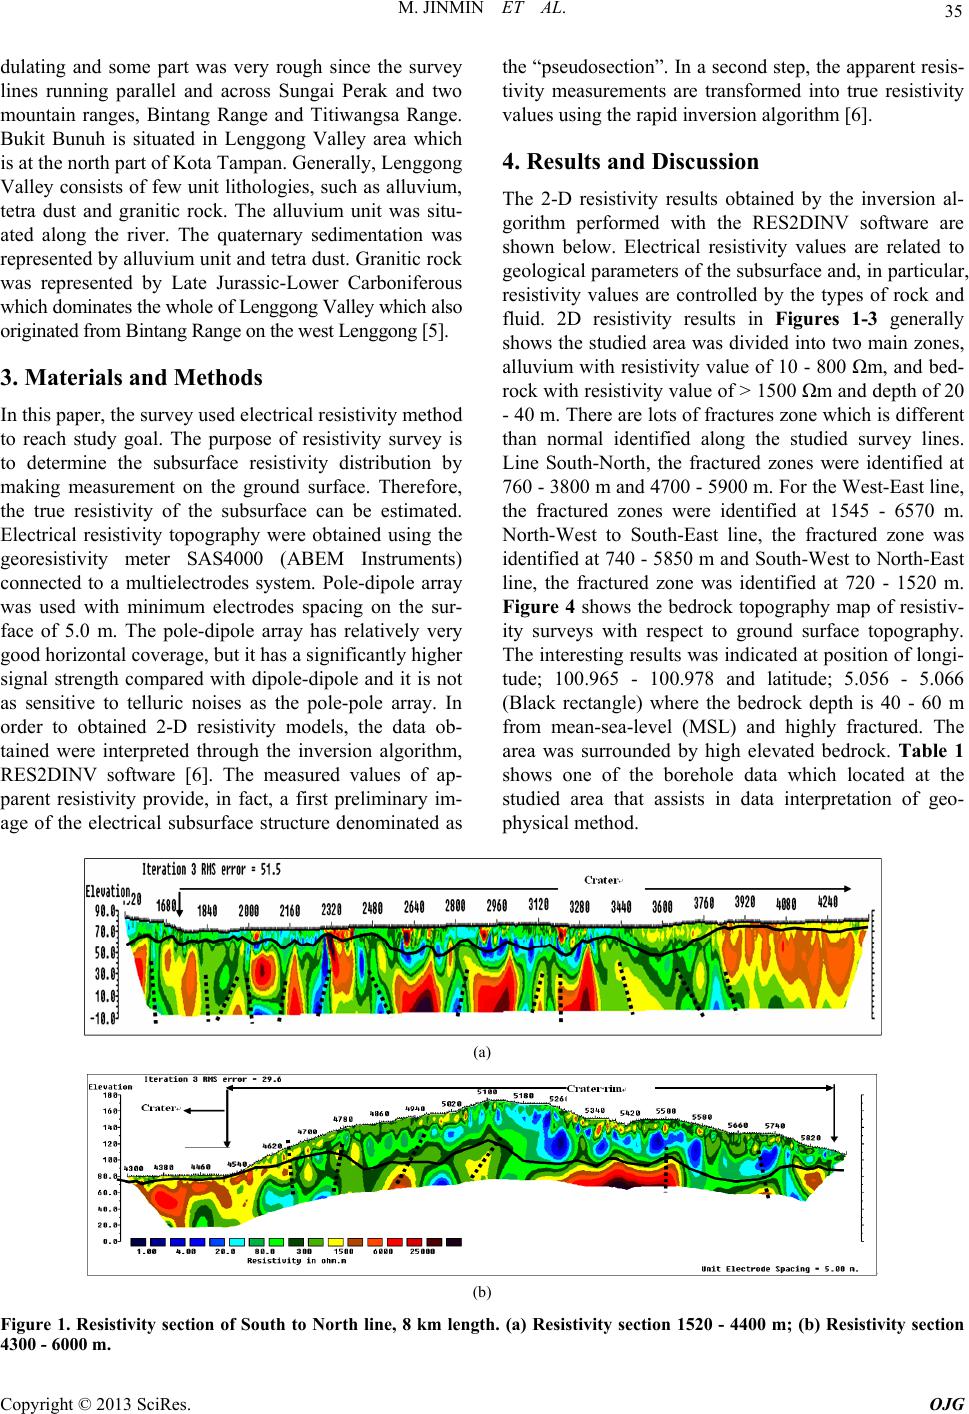
tive interpretations. The results show the variation of resistivity value and faults. The 2-D resistivity results generally
show the study area was divided into two main zones, alluvium with resistivity value of 10 - 800 Ωm, and bedrock with
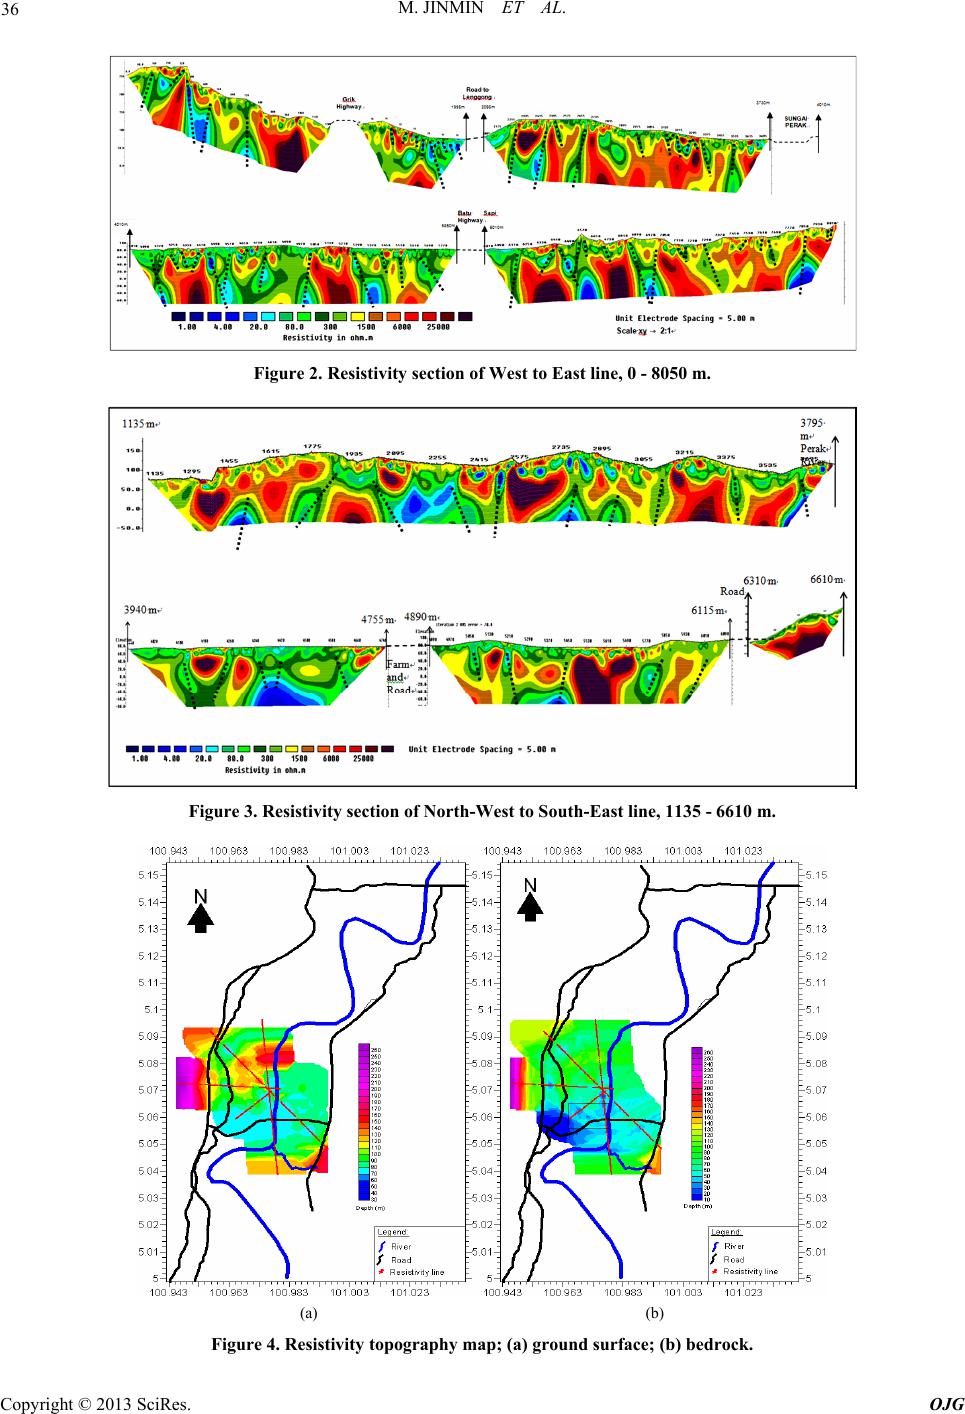
resistivity value of > 1500 Ωm and depth of 20 - 40 m. There are lots of fractured zones which are different than normal,
identified along the survey lines. The South-North line shows the fractured zones were identified at 760 - 3800 m and
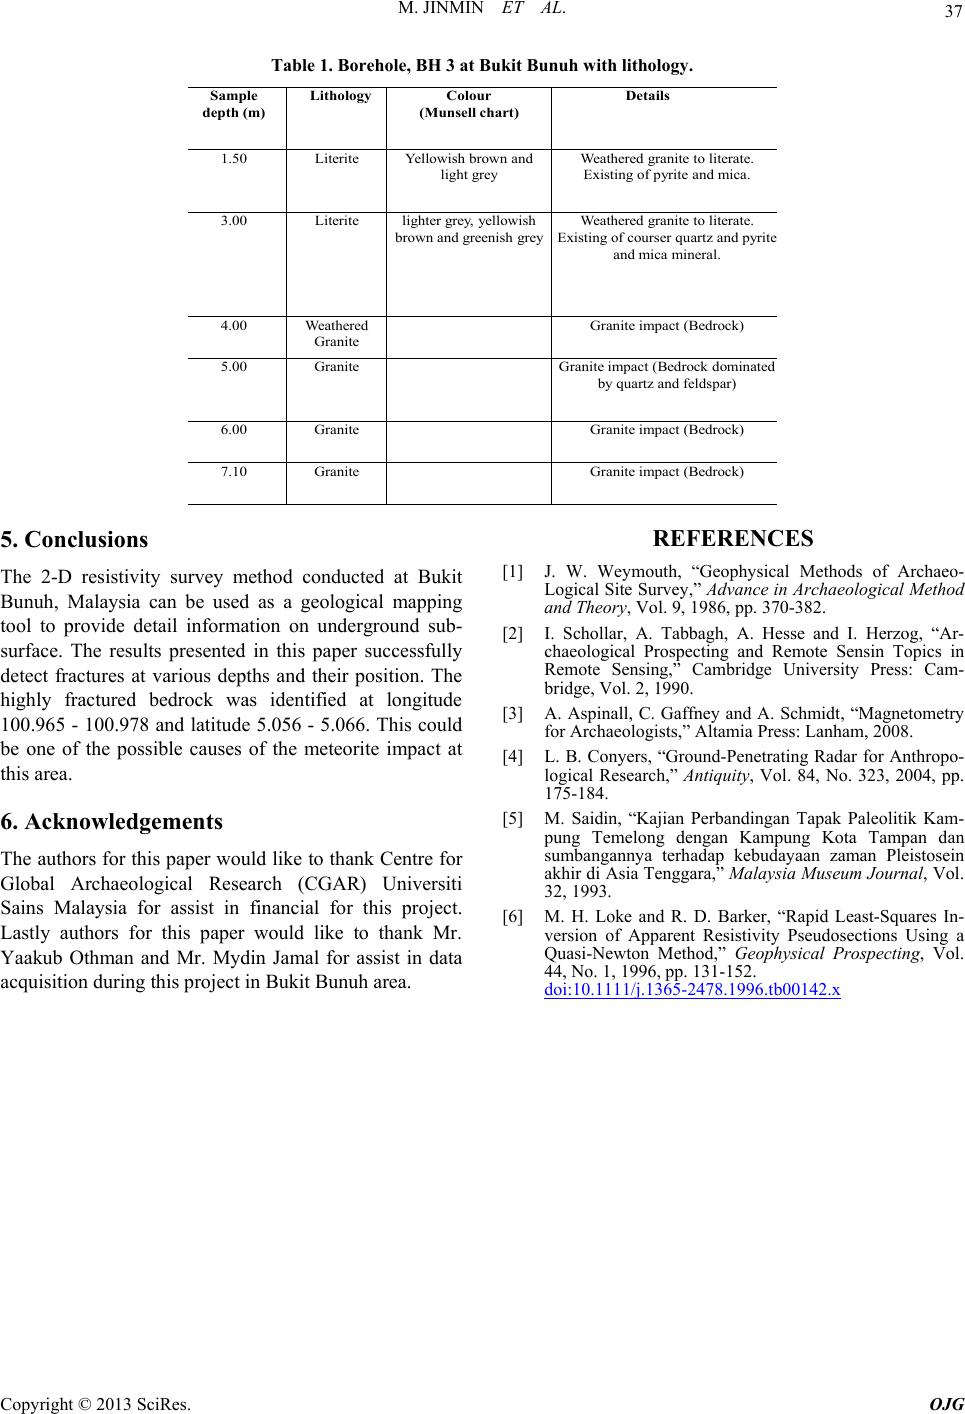
4700 - 5900 m. The West-East line, the fractured zone was identified at 1545 - 6570 m and North-West to South-East
line, the fractured zone was identified at 740 - 5850 m. Meanwhile, South-West to North-East line, the fractured zone
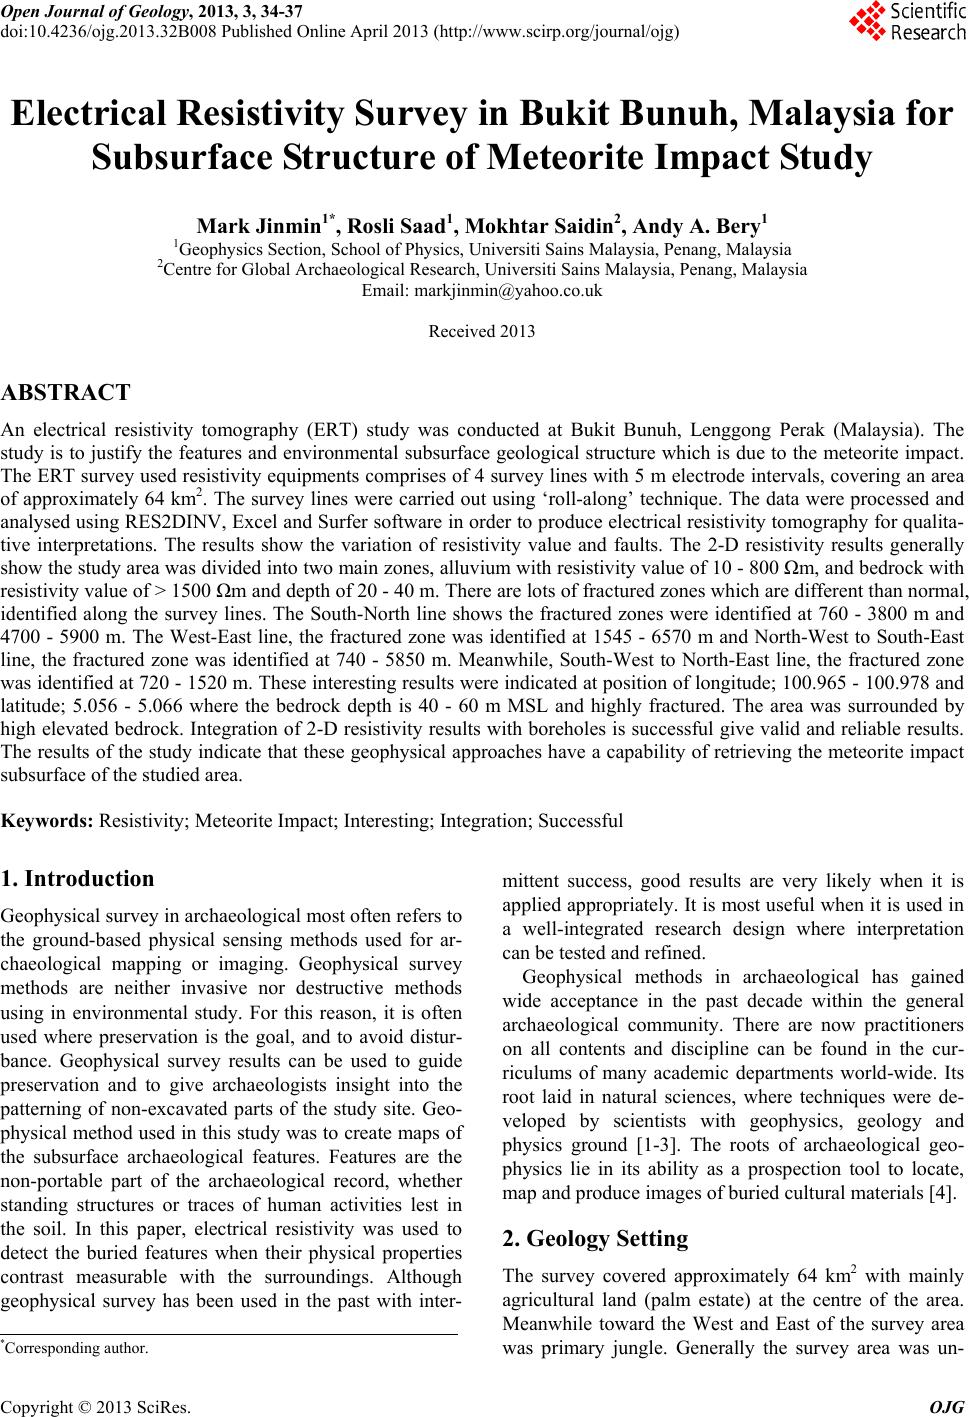
was identified at 720 - 1520 m. These interesting results were indicated at position of longitude; 100.965 - 100.978 and
latitude; 5.056 - 5.066 where the bedrock depth is 40 - 60 m MSL and highly fractured. The area was surrounded by
high elevated bedrock. Integration of 2-D resistivity results with boreholes is successful give valid and reliable results.
The results of the study indicate that these geophysical approaches have a capability of retrieving the meteorite impact
subsurface of the studied area.
Keywords: Resistivity; Meteorite Impact; Interesting; Integration; Successful
1. Introduction
Geophysical survey in archaeological most often refers to
the ground-based physical sensing methods used for ar-
chaeological mapping or imaging. Geophysical survey
methods are neither invasive nor destructive methods
using in environmental study. For this reason, it is often
used where preservation is the goal, and to avoid distur-
bance. Geophysical survey results can be used to guide
preservation and to give archaeologists insight into the
patterning of non-excavated parts of the study site. Geo-
physical method used in this study was to create maps of
the subsurface archaeological features. Features are the
non-portable part of the archaeological record, whether
standing structures or traces of human activities lest in
the soil. In this paper, electrical resistivity was used to
detect the buried features when their physical properties
contrast measurable with the surroundings. Although
geophysical survey has been used in the past with inter-
mittent success, good results are very likely when it is
applied appropriately. It is most useful when it is used in
a well-integrated research design where interpretation
can be tested and refined.
Geophysical methods in archaeological has gained
wide acceptance in the past decade within the general
archaeological community. There are now practitioners
on all contents and discipline can be found in the cur-
riculums of many academic departments world-wide. Its
root laid in natural sciences, where techniques were de-
veloped by scientists with geophysics, geology and
physics ground [1-3]. The roots of archaeological geo-
physics lie in its ability as a prospection tool to locate,
map and produce images of buried cultural materials [4].
2. Geology Setting
The survey covered approximately 64 km2 with mainly
agricultural land (palm estate) at the centre of the area.
Meanwhile toward the West and East of the survey area
was primary jungle. Generally the survey area was un-
*Corresponding author.
Copyright © 2013 SciRes. OJG