Paper Menu >>
Journal Menu >>
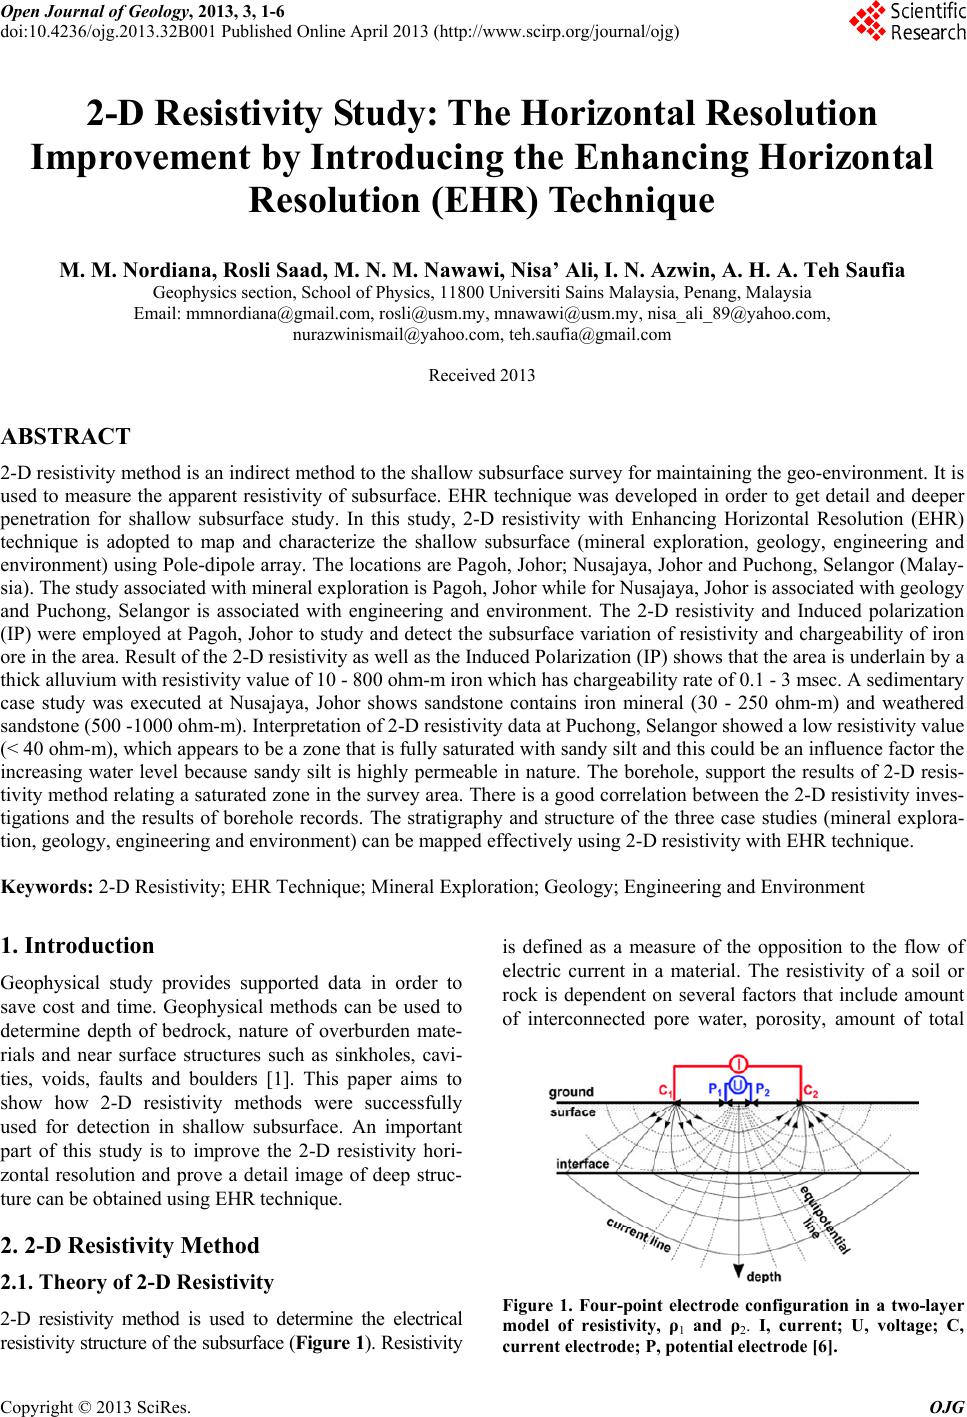 Open Journal of Geology, 2013, 3, 1-6 doi:10.4236/ojg.2013.32B001 Published Online April 2013 (http://www.scirp.org/journal/ojg) 2-D Resistivity Study: The Horizontal Resolution Improvement by Introducing the Enhancing Horizontal Resolution (EHR) Technique M. M. Nordiana, Rosli Saad, M. N. M. Nawawi, Nisa’ Ali, I. N. Azwin, A. H. A. Teh Saufia Geophysics section, School of Physics, 11800 Universiti Sains Malaysia, Penang, Malaysia Email: mmnordiana@gmail.com, rosli@usm.my, mnawawi@usm.my, nisa_ali_89@yahoo.com, nurazwinismail@yahoo.com, teh.saufia@gmail.com Received 2013 ABSTRACT 2-D resistivity method is an indirect method to the shallow subsurface survey for maintaining the geo-environment. It is used to measure the apparent resistivity of subsurface. EHR technique was developed in order to get detail and deeper penetration for shallow subsurface study. In this study, 2-D resistivity with Enhancing Horizontal Resolution (EHR) technique is adopted to map and characterize the shallow subsurface (mineral exploration, geology, engineering and environment) using Pole-dipole array. The locations are Pagoh, Johor; Nusajaya, Johor and Puchong, Selangor (Malay- sia). The study associated with mineral exploration is Pagoh, Johor while for Nusajaya, Johor is associated with geology and Puchong, Selangor is associated with engineering and environment. The 2-D resistivity and Induced polarization (IP) were employed at Pagoh, Johor to study and detect the subsurface variation of resistivity and chargeability of iron ore in the area. Result of the 2-D resistivity as well as the Induced Polarization (IP) shows that the area is underlain by a thick alluvium with resistivity value of 10 - 800 ohm-m iron which has chargeability rate of 0.1 - 3 msec. A sedimentary case study was executed at Nusajaya, Johor shows sandstone contains iron mineral (30 - 250 ohm-m) and weathered sandstone (500 -1000 ohm-m). Interpretation of 2-D resistivity data at Puchong, Selangor showed a low resistivity value (< 40 ohm-m), which appears to be a zone that is fully saturated with sandy silt and this could be an influence factor the increasing water level because sandy silt is highly permeable in nature. The borehole, support the results of 2-D resis- tivity method relating a saturated zone in the survey area. There is a good correlation between the 2-D resistivity inves- tigations and the results of borehole records. The stratigraphy and structure of the three case studies (mineral explora- tion, geology, engineering and environment) can be mapped effectively using 2-D resistivity with EHR technique. Keywords: 2-D Resistivity; EHR Technique; Mineral Exploration; Geology; Engineering and Environment 1. Introduction Geophysical study provides supported data in order to save cost and time. Geophysical methods can be used to determine depth of bedrock, nature of overburden mate- rials and near surface structures such as sinkholes, cavi- ties, voids, faults and boulders [1]. This paper aims to show how 2-D resistivity methods were successfully used for detection in shallow subsurface. An important part of this study is to improve the 2-D resistivity hori- zontal resolution and prove a detail image of deep struc- ture can be obtained using EHR technique. 2. 2-D Resistivity Method 2.1. Theory of 2-D Resistivity 2-D resistivity method is used to determine the electrical resistivity structure of the subsurface (Figure 1). Resistivity is defined as a measure of the opposition to the flow of electric current in a material. The resistivity of a soil or rock is dependent on several factors that include amount of interconnected pore water, porosity, amount of total Figure 1. Four-point electrode configuration in a two-layer model of resistivity, ρ1 and ρ2. I, current; U, voltage; C, current electrode; P, potential electrode [6]. Copyright © 2013 SciRes. OJG 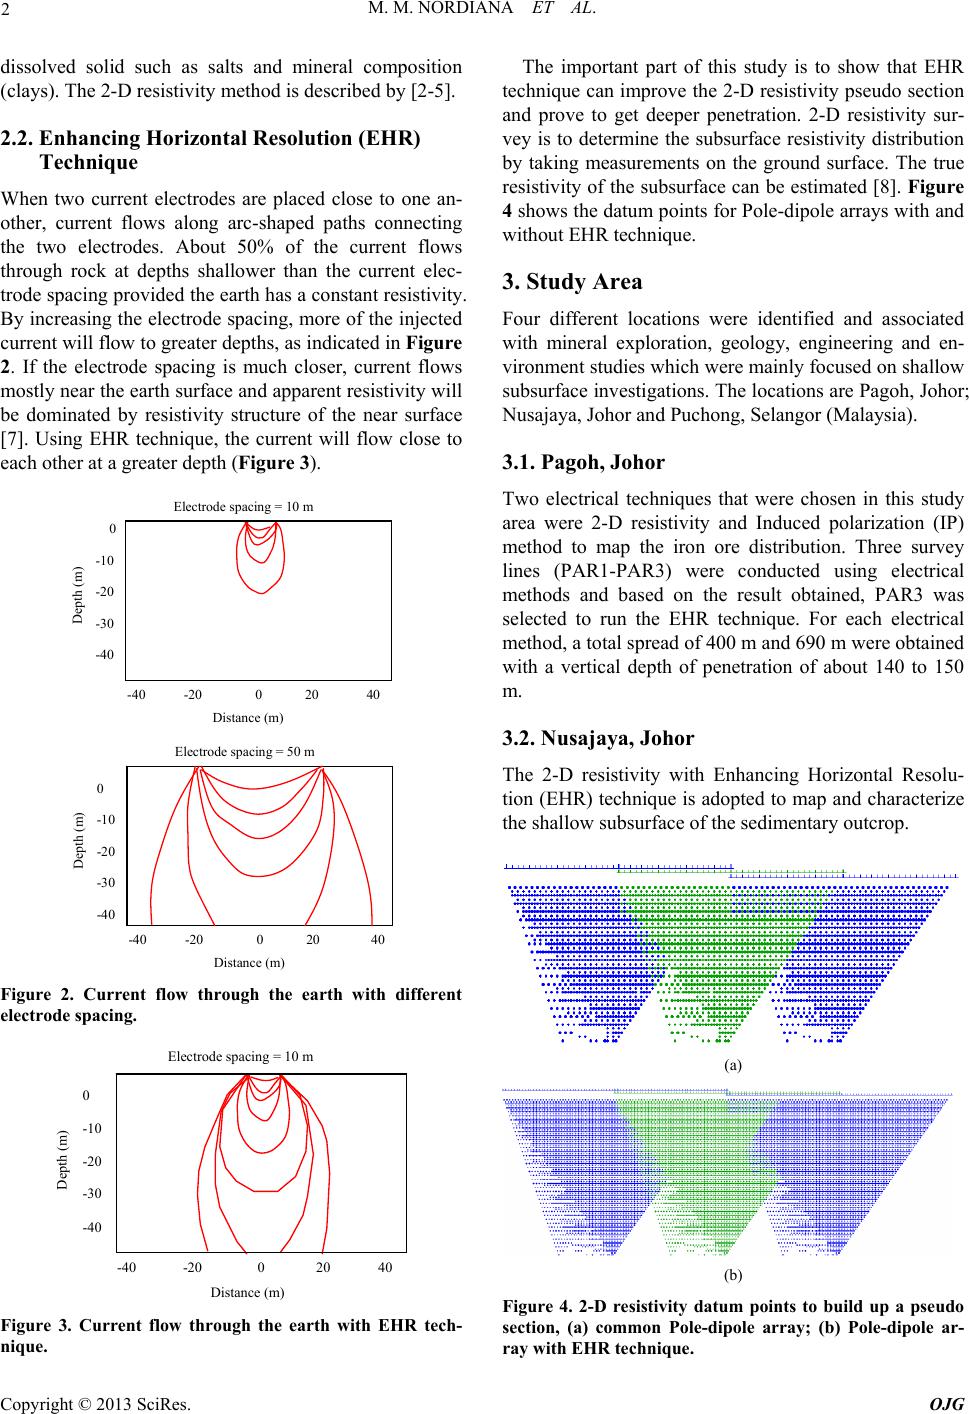 M. M. NORDIANA ET AL. 2 dissolved solid such as salts and mineral composition (clays). The 2-D resistivity method is described by [2-5]. 2.2. Enhancing Horizontal Resolution (EHR) Technique When two current electrodes are placed close to one an- other, current flows along arc-shaped paths connecting the two electrodes. About 50% of the current flows through rock at depths shallower than the current elec- trode spacing provided the earth has a constant resistivity. By increasing the electrode spacing, more of the injected current will flow to greater depths, as indicated in Figure 2. If the electrode spacing is much closer, current flows mostly near the earth surface and apparent resistivity will be dominated by resistivity structure of the near surface [7]. Using EHR technique, the current will flow close to each other at a greater depth (Figure 3). Electrode spacing = 10 m Depth (m) 0 -10 -20 -30 -40 -40 -20 0 20 40 Distance (m) Distance (m) Electrode spacing = 50 m Depth (m) 0 -10 -20 -30 -40 -40 -20 0 20 40 Figure 2. Current flow through the earth with different electrode spacing. Electrode spacing = 10 m Depth (m) 0 -10 -20 -30 -40 -40 -20 0 20 40 Distance (m) Figure 3. Current flow through the earth with EHR tech- nique. The important part of this study is to show that EHR technique can improve the 2-D resistivity pseudo section and prove to get deeper penetration. 2-D resistivity sur- vey is to determine the subsurface resistivity distribution by taking measurements on the ground surface. The true resistivity of the subsurface can be estimated [8]. Figure 4 shows the datum points for Pole-dipole arrays with and without EHR technique. 3. Study Area Four different locations were identified and associated with mineral exploration, geology, engineering and en- vironment studies which were mainly focused on shallow subsurface investigations. The locations are Pagoh, Johor; Nusajaya, Johor and Puchong, Selangor (Malaysia). 3.1. Pagoh, Johor Two electrical techniques that were chosen in this study area were 2-D resistivity and Induced polarization (IP) method to map the iron ore distribution. Three survey lines (PAR1-PAR3) were conducted using electrical methods and based on the result obtained, PAR3 was selected to run the EHR technique. For each electrical method, a total spread of 400 m and 690 m were obtained with a vertical depth of penetration of about 140 to 150 m. 3.2. Nusajaya, Johor The 2-D resistivity with Enhancing Horizontal Resolu- tion (EHR) technique is adopted to map and characterize the shallow subsurface of the sedimentary outcrop. (a) (b) Figure 4. 2-D resistivity datum points to build up a pseudo section, (a) common Pole-dipole array; (b) Pole-dipole ar- ray with EHR technique. Copyright © 2013 SciRes. OJG 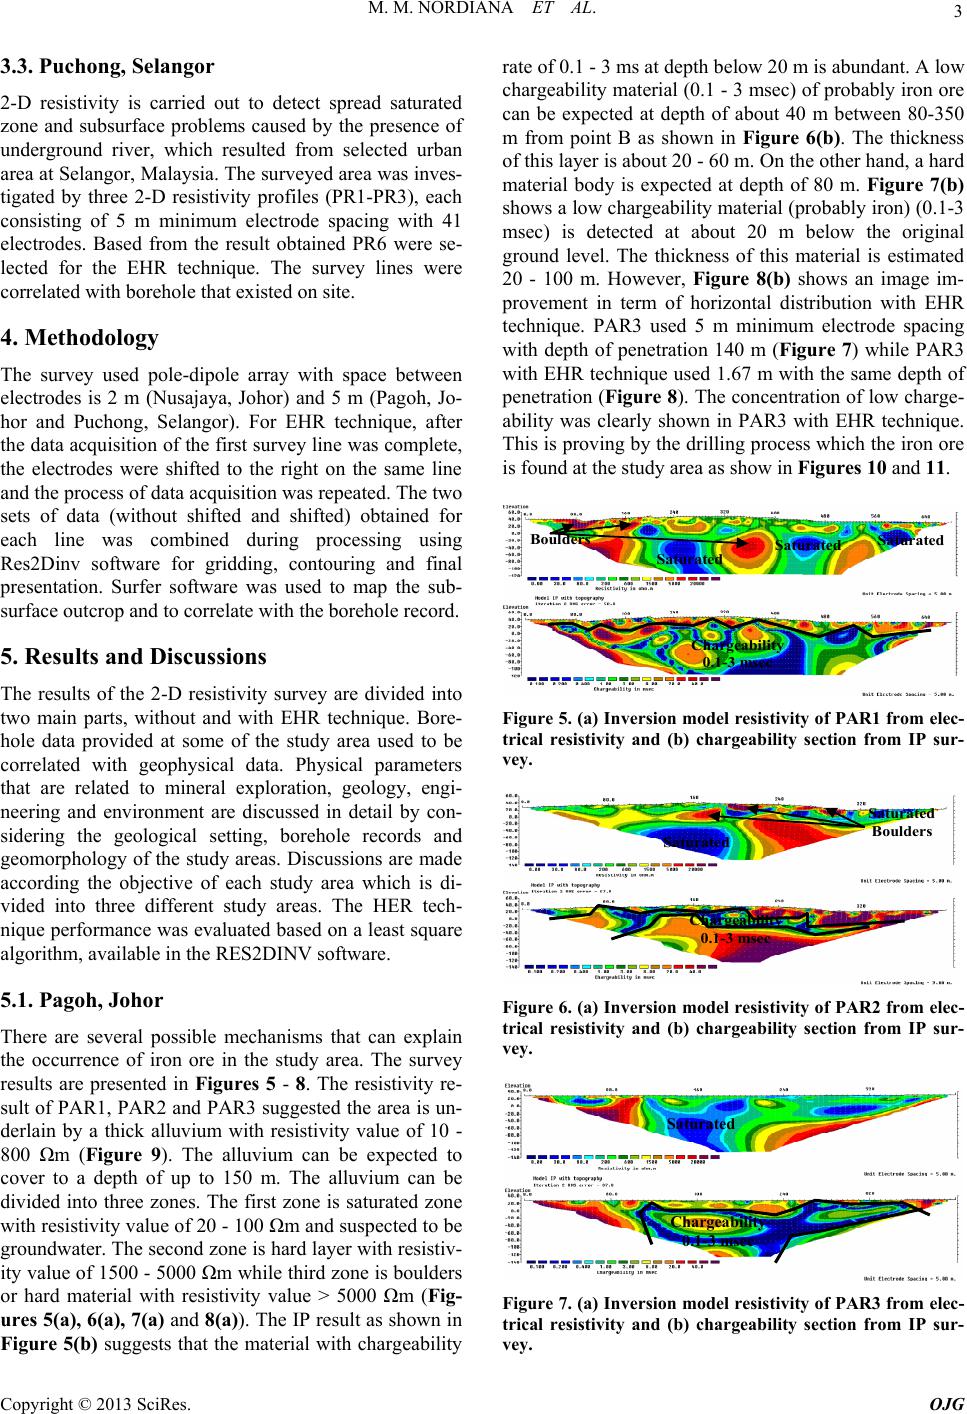 M. M. NORDIANA ET AL. 3 3.3. Puchong, Selangor 2-D resistivity is carried out to detect spread saturated zone and subsurface problems caused by the presence of underground river, which resulted from selected urban area at Selangor, Malaysia. The surveyed area was inves- tigated by three 2-D resistivity profiles (PR1-PR3), each consisting of 5 m minimum electrode spacing with 41 electrodes. Based from the result obtained PR6 were se- lected for the EHR technique. The survey lines were correlated with borehole that existed on site. 4. Methodology The survey used pole-dipole array with space between electrodes is 2 m (Nusajaya, Johor) and 5 m (Pagoh, Jo- hor and Puchong, Selangor). For EHR technique, after the data acquisition of the first survey line was complete, the electrodes were shifted to the right on the same line and the process of data acquisition was repeated. The two sets of data (without shifted and shifted) obtained for each line was combined during processing using Res2Dinv software for gridding, contouring and final presentation. Surfer software was used to map the sub- surface outcrop and to correlate with the borehole record. 5. Results and Discussions The results of the 2-D resistivity survey are divided into two main parts, without and with EHR technique. Bore- hole data provided at some of the study area used to be correlated with geophysical data. Physical parameters that are related to mineral exploration, geology, engi- neering and environment are discussed in detail by con- sidering the geological setting, borehole records and geomorphology of the study areas. Discussions are made according the objective of each study area which is di- vided into three different study areas. The HER tech- nique performance was evaluated based on a least square algorithm, available in the RES2DINV software. 5.1. Pagoh, Johor There are several possible mechanisms that can explain the occurrence of iron ore in the study area. The survey results are presented in Figures 5 - 8. The resistivity re- sult of PAR1, PAR2 and PAR3 suggested the area is un- derlain by a thick alluvium with resistivity value of 10 - 800 Ωm (Figure 9). The alluvium can be expected to cover to a depth of up to 150 m. The alluvium can be divided into three zones. The first zone is saturated zone with resistivity value of 20 - 100 Ωm and suspected to be groundwater. The second zone is hard layer with resistiv- ity value of 1500 - 5000 Ωm while third zone is boulders or hard material with resistivity value > 5000 Ωm (Fig- ures 5(a), 6(a), 7(a) and 8(a)). The IP result as shown in Figure 5(b) suggests that the material with chargeability rate of 0.1 - 3 ms at depth below 20 m is abundant. A low chargeability material (0.1 - 3 msec) of probably iron ore can be expected at depth of about 40 m between 80-350 m from point B as shown in Figure 6(b). The thickness of this layer is about 20 - 60 m. On the other hand, a hard material body is expected at depth of 80 m. Figure 7(b) shows a low chargeability material (probably iron) (0.1-3 msec) is detected at about 20 m below the original ground level. The thickness of this material is estimated 20 - 100 m. However, Figure 8(b) shows an image im- provement in term of horizontal distribution with EHR technique. PAR3 used 5 m minimum electrode spacing with depth of penetration 140 m (Figure 7) while PAR3 with EHR technique used 1.67 m with the same depth of penetration (Figure 8). The concentration of low charge- ability was clearly shown in PAR3 with EHR technique. This is proving by the drilling process which the iron ore is found at the study area as show in Figures 10 and 11. Boulders Saturated Saturated Saturated Chargeability 0.1-3 msec Figure 5. (a) Inversion modelesistivity of PAR1 from elec- r trical resistivity and (b) chargeability section from IP sur- vey. Boulders Saturated Saturated Chargeability 0.1-3 msec Figure 6. (a) Inversion model resistivity of PAR2 from elec- trical resistivity and (b) chargeability section from IP sur- vey. Saturated Chargeability 0.1-3 msec Figure 7. (a) Inversion model resistivity of PAR3 from elec- trical resistivity and (b) chargeability section from IP sur- vey. Copyright © 2013 SciRes. OJG  M. M. NORDIANA ET AL. 4 Saturated Chargeability 0.1-3 msec Figure 8. (a) Inversion modelesistivity of PAR3 with EHR technique from electrical rey and (b) chargeability r sistivit section from IP survey. Figure 9. Alluvium at the study area. Figure 10. A sample of iron ore found at the study ara. e Figure 11. The iron ore deposit found after drilling. 5.2. Nusajaya, Johor Profile trends South-North direction to a length of 80 m and imaging depths of 18 m was carried out in the sedi- mentary area at Nusajaya, Johor. Figures 12 and 13 show the 2-D resistivity section of without and with EHR technique. The EHR technique produce almost the same depth of penetration (~18 m) with 1 m minimum elec- trode spacing while without EHR technique used 2 m minimum electrode spacing. The result from EHR tech- nique show great improvement in horizontal resolution as compare to without EHR technique. Tt d he inversion model resistivity displays the upper par n mineral (30 - 250 ohm-m) anas sandstone contains iro weathered sandstone (500 - 1000 ohm-m) alternately. The lower part of the layer represents sandstone and silt- stone exhibit high resistivity values of 1500 - 5000 ohm-m. Result from EHR technique was chosen to over- lap the outcrop (Figure 14). 5.3. Puchong, Selangor The inversion model resistivity of PR1 shows permeable with resistivity value of 300 - 500 Ωm at depth < 20 m from the surface. The permeable layer comprises coarse gravel/sand, a good potential for groundwater aquifer. In 10 20 30 40 50 60 70 80 1 0 2 0 30 4 0 5 0 6 0 7 0 8 0 - 1 5 - 1 0 -5 0 -15 -10 -5 0 resistivity at Nusajaya, Johor Figure 12. Inversion model without EHR technique. 10 2030 4050 6070 80 10 2030 4050 6070 80 - 1 5 - 1 0 -5 0 -10 -5 0 -15 30 100 160 230 250 270 300 330 370 500 800 1500 3000 5000 8000 15000 30000 Figure 13. Inversion model resistivity at Nusajaya, Johor with EHR technique. Figure 14. Contouring model resistivity for sedimentary deposits at Nusajaya, Johor. Copyright © 2013 SciRes. OJG  M. M. NORDIANA ET AL. 5 relation to this investigation, the permeable layer pro- vides a passage for water to flow through easily. As shown in Figure 15, saturated zone (0 - 40 Ωm) was found scattered at PR2 and PR3 at the depth of 10 m to 20 m. The nearest borehole is at PR3 where DBH 4 shows at depth 10 m to 20 m is sandy silt. Therefore the low resistivity at 10 - 20 m depth could be mainly due to sandy silt and this could be an influence factor the in an be further confirm that sandy silt located at 10-15 m depth and water level is full at the end of each borehole measured by DBH 2, DBH 5 and DBH 7. These low resistivity value from top of the sur- face with fracture and highly weathered sandstone will caused to tension crack at this area. Throughout, 2-D profiling with Pole-dipole array for common array and modified array with EHR technique - creasing water level because sandy silt is highly perme- able in nature. This c is adopted at PR6 due to the good horizontal and vertical resolution with correlation with SPT N-value as shown in Figure 16. PR1 PR2 PR3 Permeable layer Bedrock Saturated clay/ silt Permeable layer Bedrock Permeable layer DBH4 Figure 15. Inversion model resistivity of PR1, PR2 and PR3. 20 40 60 80100120 20 40 60 80100120 20 40 20 40 20 40 60 80100120 20 40 60 80100120 20 40 20 40 0 3 5 8 10 25 50 60 80 100 300 500 800 1000 3000 b) with EHR 5000 a) without EHR Resistivity (ohm-m), N-value DBH 4 602.94, 7 1318.4, 9 893.82, 8 527.22, 20 160.62, 9 90.39, 11 20.16, 7 22.475, 15 24.79, 7 65.62, 10 106.45, 8 147.28, 12543.505, 9 939.73, 19 1681.1, 17 2422.4, 50 3163.8, 50 3700.7, 50 Resistivity (ohm-m), N-value 708.6, 7 1075.9, 9 1406.5, 8 784.27 , 20 220.36, 9 61.13, 11 28.88, 7 31.6, 15 52.78, 7 73.96, 10 166.345, 8 258.73, 12942.15, 9 1536, 19 2129.9, 17 2723, 50 3955, 50 5186.2, 50 DBH 4 Figure 16. Inversion model resistivity of PR3 with SPT N-value a) Pole-dipole array b) Pole-dipole array with EHR technique. -D resistivity imaging survey at the depth of 10 m to 20 from the surface. The borehole is located at 63 m at the survey line and shows at depth of 10 m to 20 m is sandy silt. Highly weathered sandstone was found at 6 m depth with resistivity value of 800 Ωm and SPT N-value of 20. The bedrock was found at 27 m depth with resis- tivity value of 3000 Ωm and SPT N-value of 50. Figure 16 shows the higher the resistivity value, the higher the SPT N-value using common Pole-dipole array and Pole- dipole with EHR technique. However the soil resistivity can be affected by water and clay content. Subsequently, Figure 17(b) shows that the resistivity value for EHR technique is closely arranged where it matches with the SPT N-value. Saturated zone (0 - 40 Ωm) was found scattered at the 2 m 6. Conclusions Based on regional characterization of the study areas, the 2-D resistivity imaging with Enhancing Horizontal Resolution (EHR) technique mapped the shallow sub- surface of the study areas in Malaysia. Photo observation, surface observations and borehole record are used to sup- port the 2-D resistivity technique interpretation. Figure 17. Relationship between measured N-values and resistivity survey. Copyright © 2013 SciRes. OJG 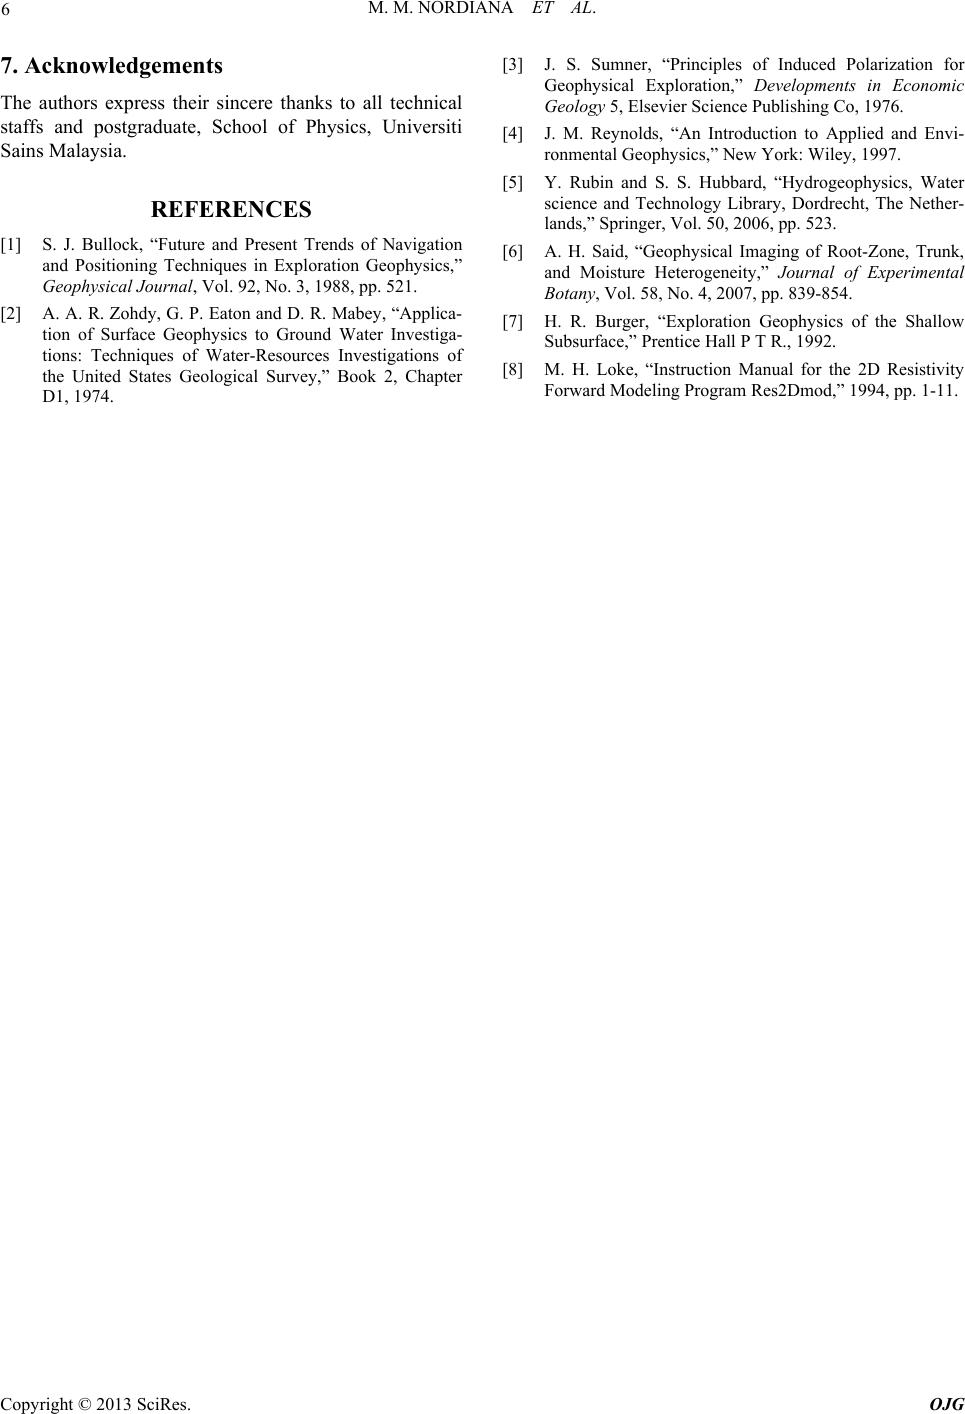 M. M. NORDIANA ET AL. Copyright © 2013 SciRes. OJG 6 7. Acknowledgements The authors express their sincere thanks to all technical staffs and postgraduate, School of Physics, Universiti Sains Malaysia. REFERENCES [1] S. J. Bullock, “Future and Present Trends of Navigation and Positioning Techniques in Exploration Geophysics,” Geophysical Journal, Vol. 92, No. 3, 1988, pp. 521. [2] A. A. R. Zohdy, G. P. Eaton and D. R. Mabey, “Applica- tion of Surface Geophysics to Ground Water Investiga- tions: Techniques of Water-Resources Investigations of the United States Geological Survey,” Book 2, Chapter D1, 1974. s of Induced Polarization for ophysics,” New York: Wiley, 1997. [5] Y. Rubin and S. S. Hubbard, “Hydrogeophysics, Water science and Trecht, The Nether- lands,” Spring3. [6] [3] J. S. Sumner, “Principle Geophysical Exploration,” Developments in Economic Geology 5, Elsevier Science Publishing Co, 1976. [4] J. M. Reynolds, “An Introduction to Applied and Envi- ronmental Ge echnology Library, Dord er, Vol. 50, 2006, pp. 52 A. H. Said, “Geophysical Imaging of Root-Zone, Trunk, and Moisture Heterogeneity,” Journal of Experimental Botany, Vol. 58, No. 4, 2007, pp. 839-854. [7] H. R. Burger, “Exploration Geophysics of the Shallow Subsurface,” Prentice Hall P T R., 1992. [8] M. H. Loke, “Instruction Manual for the 2D Resistivity Forward Modeling Program Res2Dmod,” 1994, pp. 1-11. |