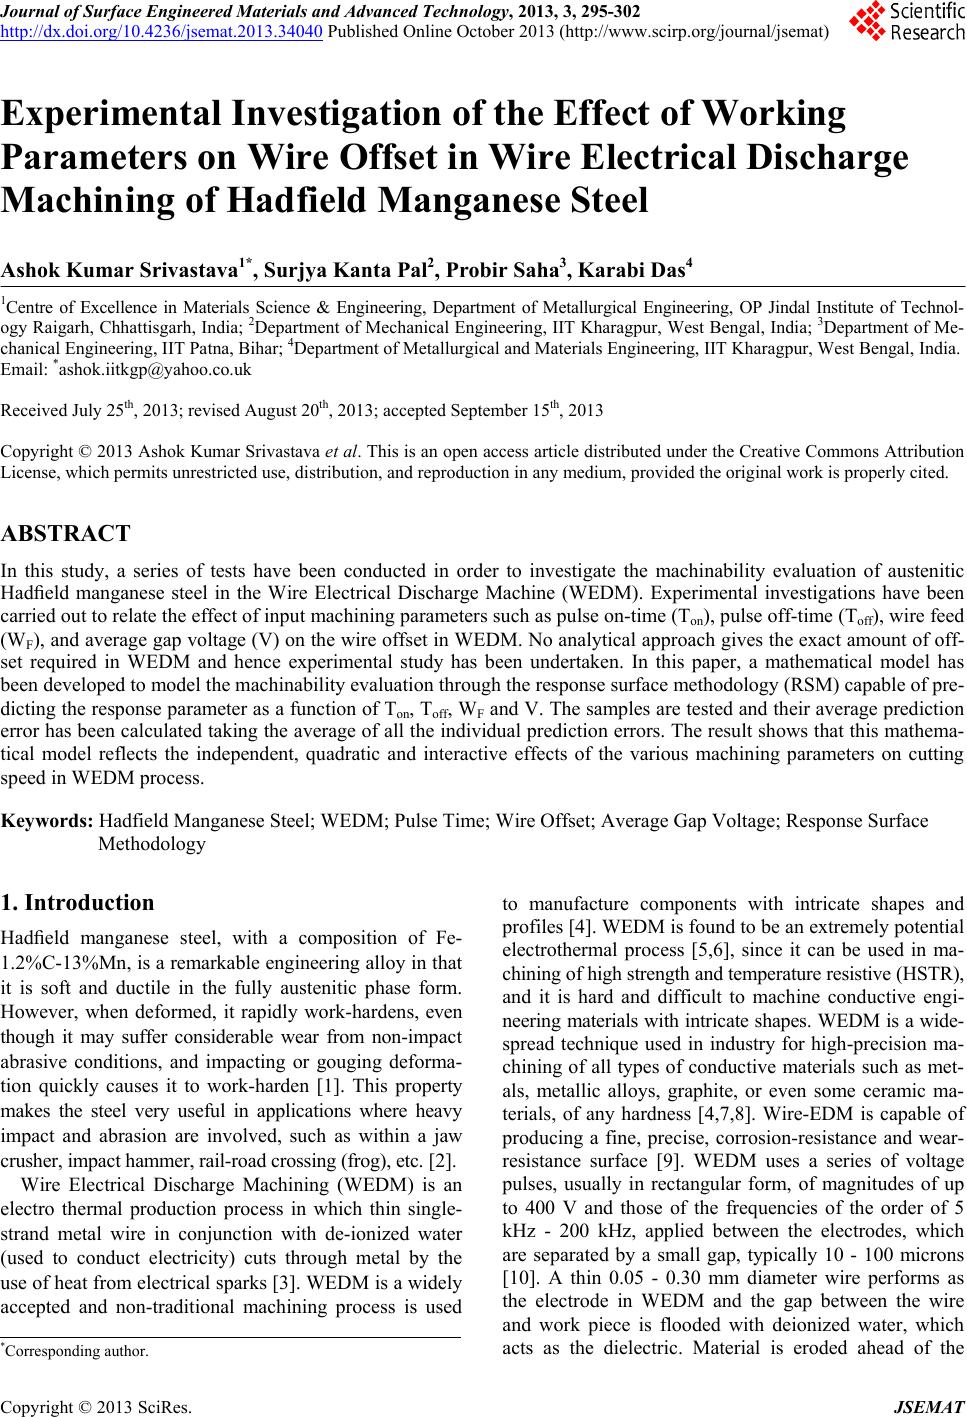
 Journal of Surface Engineered Materials and Advanced Technology, 2013, 3, 295-302 http://dx.doi.org/10.4236/jsemat.2013.34040 Published Online October 2013 (http://www.scirp.org/journal/jsemat) Experimental Investigation of the Effect of Working Parameters on Wire Offset in Wire Electrical Discharge Machining of Hadfield Manganese Steel Ashok Kumar Srivastava1*, Surjya Kanta Pal2, Probir Saha3, Karabi Das4 1Centre of Excellence in Materials Science & Engineering, Department of Metallurgical Engineering, OP Jindal Institute of Technol- ogy Raigarh, Chhattisgarh, India; 2Department of Mechanical Engineering, IIT Kharagpur, West Bengal, India; 3Department of Me- chanical Engineering, IIT Patna, Bihar; 4Department of Metallurgical and Materials Engineering, IIT Kharagpur, West Bengal, India. Email: *ashok.iitkgp@yahoo.co.uk Received July 25th, 2013; revised August 20th, 2013; accepted September 15th, 2013 Copyright © 2013 Ashok Kumar Srivastava et al. This is an open access article distributed under the Creative Commons Attribution License, which permits unrestricted use, distribution, and reproduction in any medium, provided the original work is properly cited. ABSTRACT In this study, a series of tests have been conducted in order to investigate the machinability evaluation of austenitic Hadfield manganese steel in the Wire Electrical Discharge Machine (WEDM). Experimental investigations have been carried out to relate the effect of input machining parameters such as pulse on-time (Ton), pulse off-time (Toff), wire feed (WF), and average gap voltage (V) on the wire offset in WEDM. No analytical approach gives the exact amount of off- set required in WEDM and hence experimental study has been undertaken. In this paper, a mathematical model has been developed to model the machinability evaluation through the response surface methodology (RSM) capable of pre- dicting the response parameter as a function of Ton, Toff, WF and V. The samples are tested and their average prediction error has been calculated taking the average of all the individual prediction errors. The result shows that this mathema- tical model reflects the independent, quadratic and interactive effects of the various machining parameters on cutting speed in WEDM process. Keywords: Hadfield Manganese Steel; WEDM; Pulse Time; Wire Offset; Average Gap Voltage; Response Surface Methodology 1. Introduction Hadfield manganese steel, with a composition of Fe- 1.2%C-13%Mn, is a remarkable engineering alloy in that it is soft and ductile in the fully austenitic phase form. However, when deformed, it rapidly work-hardens, even though it may suffer considerable wear from non-impact abrasive conditions, and impacting or gouging deforma- tion quickly causes it to work-harden [1]. This property makes the steel very useful in applications where heavy impact and abrasion are involved, such as within a jaw crusher, impact hammer, rail-road crossing (frog), etc. [2]. Wire Electrical Discharge Machining (WEDM) is an electro thermal production process in which thin single- strand metal wire in conjunction with de-ionized water (used to conduct electricity) cuts through metal by the use of heat from electrical sparks [3]. WEDM is a widely accepted and non-traditional machining process is used to manufacture components with intricate shapes and profiles [4]. WEDM is found to be an extremely potential electrothermal process [5,6], since it can be used in ma- chining of high strength and temperature resistive (HSTR), and it is hard and difficult to machine conductive engi- neering materials with intricate shapes. WEDM is a wide- spread technique used in industry for high-precision ma- chining of all types of conductive materials such as met- als, metallic alloys, graphite, or even some ceramic ma- terials, of any hardness [4,7,8]. Wire-EDM is capable of producing a fine, precise, corrosion-resistance and wear- resistance surface [9]. WEDM uses a series of voltage pulses, usually in rectangular form, of magnitudes of up to 400 V and those of the frequencies of the order of 5 kHz - 200 kHz, applied between the electrodes, which are separated by a small gap, typically 10 - 100 microns [10]. A thin 0.05 - 0.30 mm diameter wire performs as the electrode in WEDM and the gap between the wire and work piece is flooded with deionized water, which acts as the dielectric. Material is eroded ahead of the *Corresponding author. Copyright © 2013 SciRes. JSEMAT 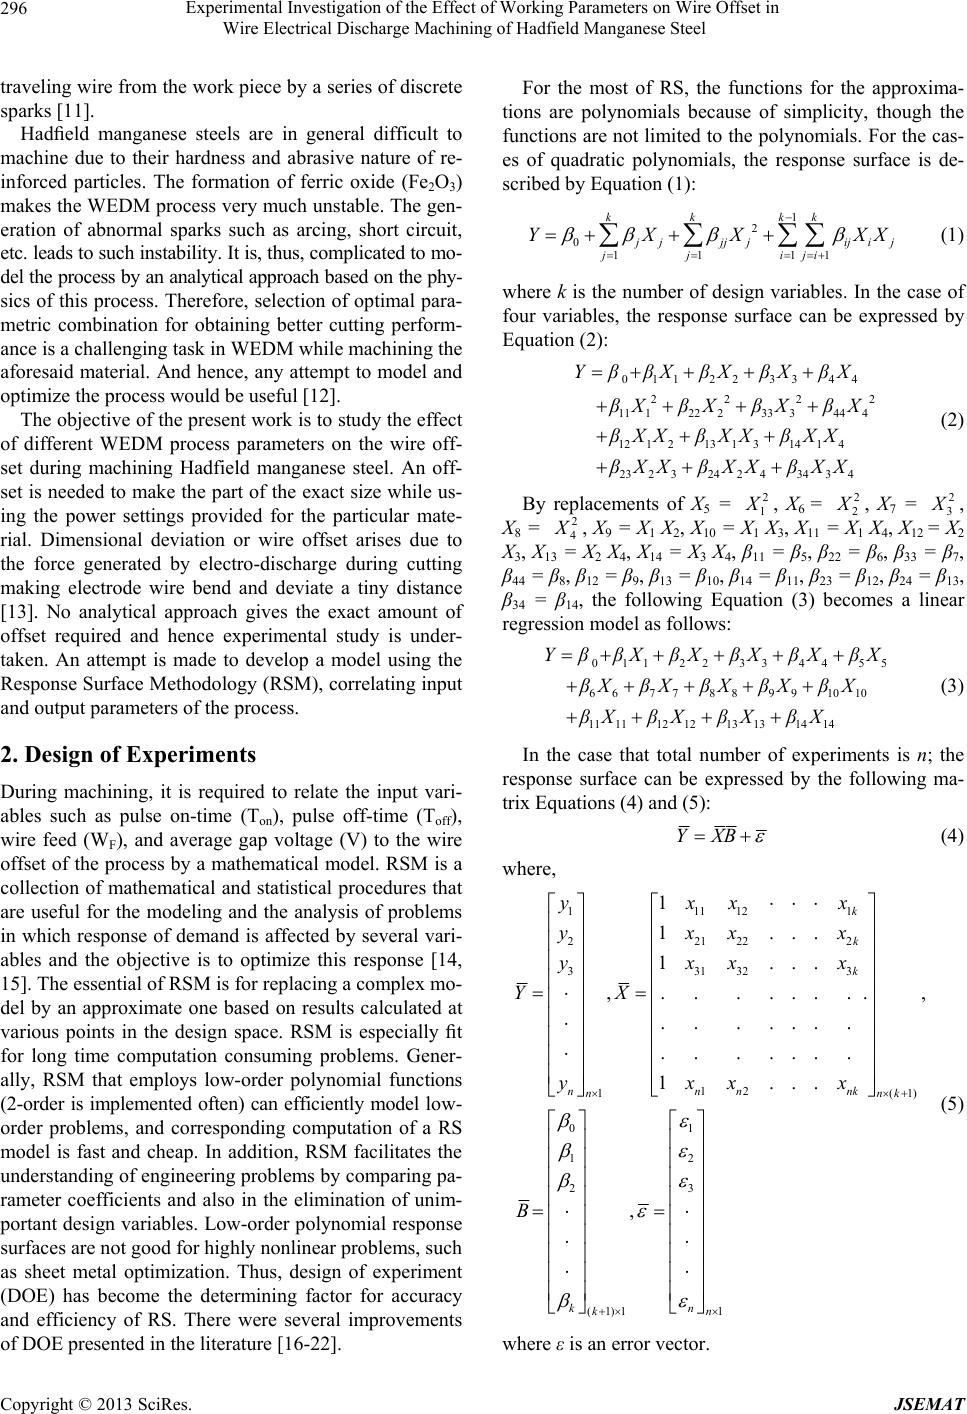 Experimental Investigation of the Effect of Working Parameters on Wire Offset in Wire Electrical Discharge Machining of Hadfield Manganese Steel 296 traveling wire from the work piece by a series of discrete sparks [11]. Hadfield manganese steels are in general difficult to machine due to their hardness and abrasive nature of re- inforced particles. The formation of ferric oxide (Fe2O3) makes the WEDM process very much unstable. The gen- eration of abnormal sparks such as arcing, short circuit, etc. leads to such instability. It is, thus, complicated to mo- del the process by an analytical approach based on the phy- sics of this process. Therefore, selection of optimal para- metric combination for obtaining better cutting perform- ance is a challenging task in WEDM while machining the aforesaid material. And hence, any attempt to model and optimize the process would be useful [12]. The objective of the present work is to study the effect of different WEDM process parameters on the wire off- set during machining Hadfield manganese steel. An off- set is needed to make the part of the exact size while us- ing the power settings provided for the particular mate- rial. Dimensional deviation or wire offset arises due to the force generated by electro-discharge during cutting making electrode wire bend and deviate a tiny distance [13]. No analytical approach gives the exact amount of offset required and hence experimental study is under- taken. An attempt is made to develop a model using the Response Surface Methodology (RSM), correlating input and output parameters of the process. 2. Design of Experiments During machining, it is required to relate the input vari- ables such as pulse on-time (Ton), pulse off-time (Toff), wire feed (WF), and average gap voltage (V) to the wire offset of the process by a mathematical model. RSM is a collection of mathematical and statistical procedures that are useful for the modeling and the analysis of problems in which response of demand is affected by several vari- ables and the objective is to optimize this response [14, 15]. The essential of RSM is for replacing a complex mo- del by an approximate one based on results calculated at various points in the design space. RSM is especially fit for long time computation consuming problems. Gener- ally, RSM that employs low-order polynomial functions (2-order is implemented often) can efficiently model low- order problems, and corresponding computation of a RS model is fast and cheap. In addition, RSM facilitates the understanding of engineering problems by comparing pa- rameter coefficients and also in the elimination of unim- portant design variables. Low-order polynomial response surfaces are not good for highly nonlinear problems, such as sheet metal optimization. Thus, design of experiment (DOE) has become the determining factor for accuracy and efficiency of RS. There were several improvements of DOE presented in the literature [16-22]. For the most of RS, the functions for the approxima- tions are polynomials because of simplicity, though the functions are not limited to the polynomials. For the cas- es of quadratic polynomials, the response surface is de- scribed by Equation (1): 1 2 0 11 11 kk kk jjjj iji jj iji YXX j XX 2 (1) where k is the number of design variables. In the case of four variables, the response surface can be expressed by Equation (2): 011223344 222 11122 233 344 4 12 1 213 1 314 1 4 2323 2424 3434 YββXβXβXβX βXβXβXβ βXX βXXβXX βXXβXX βXX (2) By replacements of X5 = 2 1 , X 6 = 2 2 , X 7 = 2 3 , X8 = 2 4 , X9 = X1 X2, X10 = X1 X3, X11 = X1 X4, X12 = X2 X3, X13 = X2 X4, X14 = X3 X4, β11 = β5, β22 = β6, β33 = β7, β44 = β8, β12 = β9, β13 = β10, β14 = β11, β23 = β12, β24 = β13, β34 = β14, the following Equation (3) becomes a linear regression model as follows: 0112233445 66778 89910 10 111112 1213131414 YββXβXβXβXβ5 βXβXβXβXβX βXβXβXβX (3) In the case that total number of experiments is n; the response surface can be expressed by the following ma- trix Equations (4) and (5): YXB (4) where, 111121 221222 331323 12 1( 01 12 23 (1)1 1 1 ... 1 ... ,... ... .., . ..... . . ..... . 1 ... , k k k nnnnk nn kk yxxx yxxx yxxx YX yxxx B 1 nn 1)k (5) where ε is an error vector. Copyright © 2013 SciRes. JSEMAT  Experimental Investigation of the Effect of Working Parameters on Wire Offset in Wire Electrical Discharge Machining of Hadfield Manganese Steel Copyright © 2013 SciRes. JSEMAT 297 3. Experiential Procedure During this study, a series of experiments were conduct- ed on Electra Maxicut model, CNC wire-EDM machine, manufactured by Electronica M/C Tools Limited, Pune (India). A schematic drawing and a photograph of the ex- perimental system is shown in Figure 1. The voltage and current waveform during machining has also been stored into a computer by using Hall Effect sensors (LA 55-P, LEM) and 100 MHz digital storage oscilloscope (Agili- ent-54624A model) with a sampling speed of 1 mega samples/sec. In this machine there are total 10 knob posi- tions (1 - 10) to vary peak current. It has been seen that peak current increases with knob position. The constant parameters were: Wire material—Brass, Hadfield manganese steel specimens of hardness 45 - 46 HRC, Wire diameter-250 µm, Wire tension-1000 gf, Di- electric fluid-deionized water, Up flushing rate—4 lt/min, Down flushing rate—5 lt/min, Peak current—2 amp, Length of cut—6 mm, Capacitor—1 µF. The coded and actual values of each parameter used in this work are list- ed in Table 1. From the coded form of parameters, the corresponding actual parameters and results of output pa- rameters are listed in Table 2. Four input machining parameters such as pulse on- time (Ton), pulse off-time (Toff), wire feed (Wf), average gap voltage (V) have been varied to see their effect on output parameter i.e. wire offset. Hadfield manganese steel samples of 15 mm × 15 mm × 10 mm were used. An optical microscope (Model: SDM 210, Metal Power Pvt. Ltd., Mumbai) was used to measure the width of the slit of the work piece formed by WEDM. Figure 2 shows the photographs of sample after machining. 4. Results and Discussions 4.1. Regression Analysis The analysis of variance (ANOVA) was developed by the researchers to test hypotheses about the situations where there are two or more means being compared. Though initially dealing with agricultural data [23], this methodology has been applied to a vast array of other fields for data analysis. It is conceptually the same as re- gression. It allows researcher to evaluate all of the mean differences in a single hypothesis test. An F-test is any statistical test in which the test statistic has an F-distri- bution under the null hypothesis. It is most often used when comparing statistical models that have been fitted to a dataset, in order to identify the model that best fits the population from which the data were sampled. Exact F-tests mainly arise when the models have been fitted to the data using least squares. The tests in an ANOVA are based on the F-ratio: the variation due to an experimental treatment or effect divided by the variation due to expe- rimental error. Controller Tool (Upper) Workpiece (Lower) Oscilloscope Personal Computer (a) (b) Figure 1. Showing: (a) a schematic drawing and (b) a photograph of the experimental syste m. Table 1. Coding of process parameters. Level Pulse on time “Ton” (µs) Pulse off time “Toff” (µs) Wire feed “WF” (m/min) Average gap “V” (volts) −2 6 5 2 50 −1 8 15 3 56 0 10 25 4 62 +1 12 35 5 68 +2 14 45 6 74  Experimental Investigation of the Effect of Working Parameters on Wire Offset in Wire Electrical Discharge Machining of Hadfield Manganese Steel 298 Table 2. Design of experiments and results (actual parameters). Exp. No Ton (µs) Toff (µs) WF (m/min) Avg GapVolt (V) Time (min) Average Kerf width (µm) Wire offset (mm) 1 12 35 3 68 5.079 325.533 0.163 2 10 5 4 62 4.269 350.75 0.175 3 8 35 3 56 3.868 345.825 0.173 4 10 25 4 62 4.295 366.908 0.183 5 10 25 4 50 3.293 355.241 0.178 6 10 25 4 62 4.369 376.075 0.188 7 14 25 4 62 4.293 374.708 0.187 8 12 35 3 56 3.652 365.65 0.183 9 10 25 4 62 4.271 372.05 0.186 10 12 15 5 68 5.171 373.891 0.187 11 10 25 6 62 4.642 363.366 0.182 12 8 15 5 68 5.298 364.408 0.182 13 10 25 4 74 7.013 388.858 0.194 14 8 35 5 68 5.894 381.633 0.191 15 10 25 2 62 4.220 367.708 0.184 16 10 25 4 62 4.243 369.8 0.185 17 12 15 5 56 3.633 360.7 0.180 18 6 25 4 62 4.539 378.533 0.189 19 12 15 3 68 5.224 389.116 0.195 20 10 25 4 62 4.469 379.333 0.190 21 12 15 3 56 3.492 371.875 0.186 22 8 15 3 68 5.302 395.933 0.198 23 8 35 3 68 5.759 388.441 0.194 24 10 25 4 62 4.365 377.858 0.189 25 10 45 4 62 4.636 360.975 0.180 26 8 15 3 56 3.702 342.425 0.171 27 8 35 5 56 4.027 364.758 0.182 28 10 25 4 62 4.391 372.616 0.186 29 12 35 5 68 5.612 369.075 0.185 30 12 35 5 56 3.781 363.183 0.182 31 8 15 5 56 3.931 358.041 0.179 ANOVA and the F-ratio test have been performed to justify the goodness of fit of the developed mathematical models. The calculated values of F-ratio for the lack of fit are found to be lesser than the standard value of the F-ratio. The second order regression models are adequate at 95% confidence level. Hence, the developed mathe- matical models, which correlate the various machining parameters with wire offset, can adequately be represent- ed through the Response Surface Methodology. Using software “MINITAB”, the values of the regres- sion coefficients of Equation (2) is calculated for cutting speed and presented by Equation (6): Copyright © 2013 SciRes. JSEMAT 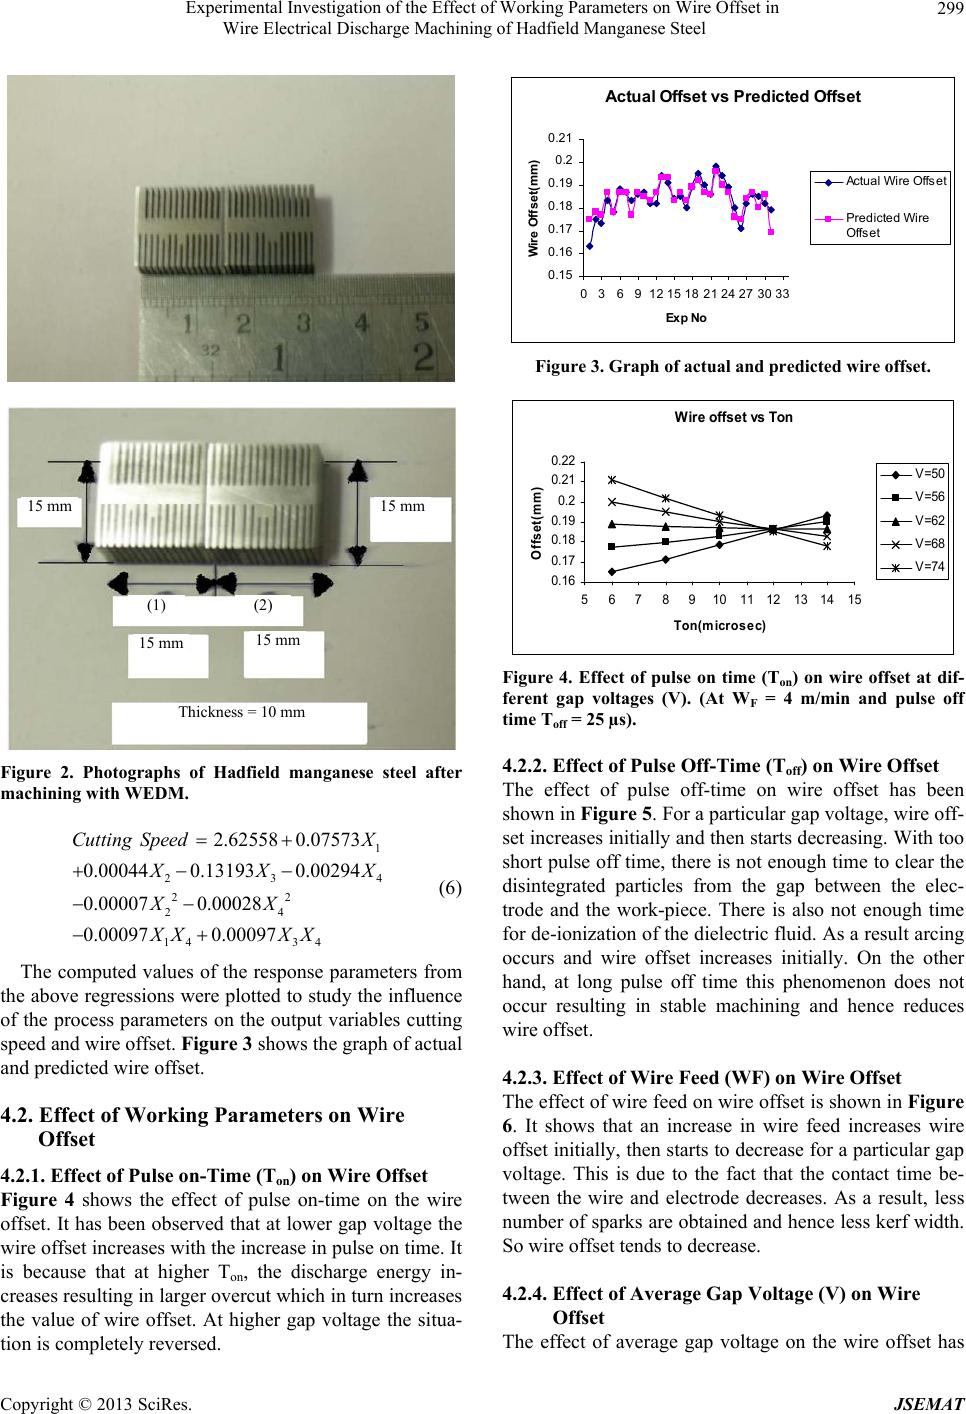 Experimental Investigation of the Effect of Working Parameters on Wire Offset in Wire Electrical Discharge Machining of Hadfield Manganese Steel 299 (1) (2) 15 mm 15 mm 15 mm 15 mm Thickness = 10 mm Figure 2. Photographs of Hadfield manganese steel after machining with WEDM. 1 23 22 24 14 34 2.62558 0.07573 0.000440.13193 0.00294 0.00007 0.00028 0.00097 0.00097 Cutting SpeedX 4 XX XX XX XX (6) The computed values of the response parameters from the above regressions were plotted to study the influence of the process parameters on the output variables cutting speed and wire offset. Figure 3 shows the graph of actual and predicted wire offset. 4.2. Effect of Working Parameters on Wire Offset 4.2.1. Effect of Pulse on-Time (Ton) on W i re Offset Figure 4 shows the effect of pulse on-time on the wire offset. It has been observed that at lower gap voltage the wire offset increases with the increase in pulse on time. It is because that at higher Ton, the discharge energy in- creases resulting in larger overcut which in turn increases the value of wire offset. At higher gap voltage the situa- tion is completely reversed. A ct ual O f f set vs Predi ct ed O ffset 0.15 0.16 0.17 0.18 0.19 0.2 0.21 036912 15 18 21 24 27 30 33 Exp No W ire Of f set( mm) Actual Wire Offset Pr edic ted Wire Offset Figure 3. Graph of actual and predicted wire offset. Wire offset vs T on 0.16 0.17 0.18 0.19 0.2 0.21 0.22 56789101112131415 Ton(microsec) Offset(mm) V=50 V=56 V=62 V=68 V=74 Figure 4. Effect of pulse on time (Ton) on wire offset at dif- ferent gap voltages (V). (At WF = 4 m/min and pulse off time Toff = 25 µs). 4.2.2. Effect of Pulse Off-Time (Toff) on Wire Offset The effect of pulse off-time on wire offset has been shown in Figure 5. For a particular gap voltage, wire off- set increases initially and then starts decreasing. With too short pulse off time, there is not enough time to clear the disintegrated particles from the gap between the elec- trode and the work-piece. There is also not enough time for de-ionization of the dielectric fluid. As a result arcing occurs and wire offset increases initially. On the other hand, at long pulse off time this phenomenon does not occur resulting in stable machining and hence reduces wire offset. 4.2.3. Effect of Wire Feed (WF) on Wire Offset The effect of wire feed on wire offset is shown in Figure 6. It shows that an increase in wire feed increases wire offset initially, then starts to decrease for a particular gap voltage. This is due to the fact that the contact time be- tween the wire and electrode decreases. As a result, less number of sparks are obtained and hence less kerf width. So wire offset tends to decrease. 4.2.4. Effect of Average Gap Voltage (V) on Wi r e Offset The effect of average gap voltage on the wire offset has Copyright © 2013 SciRes. JSEMAT 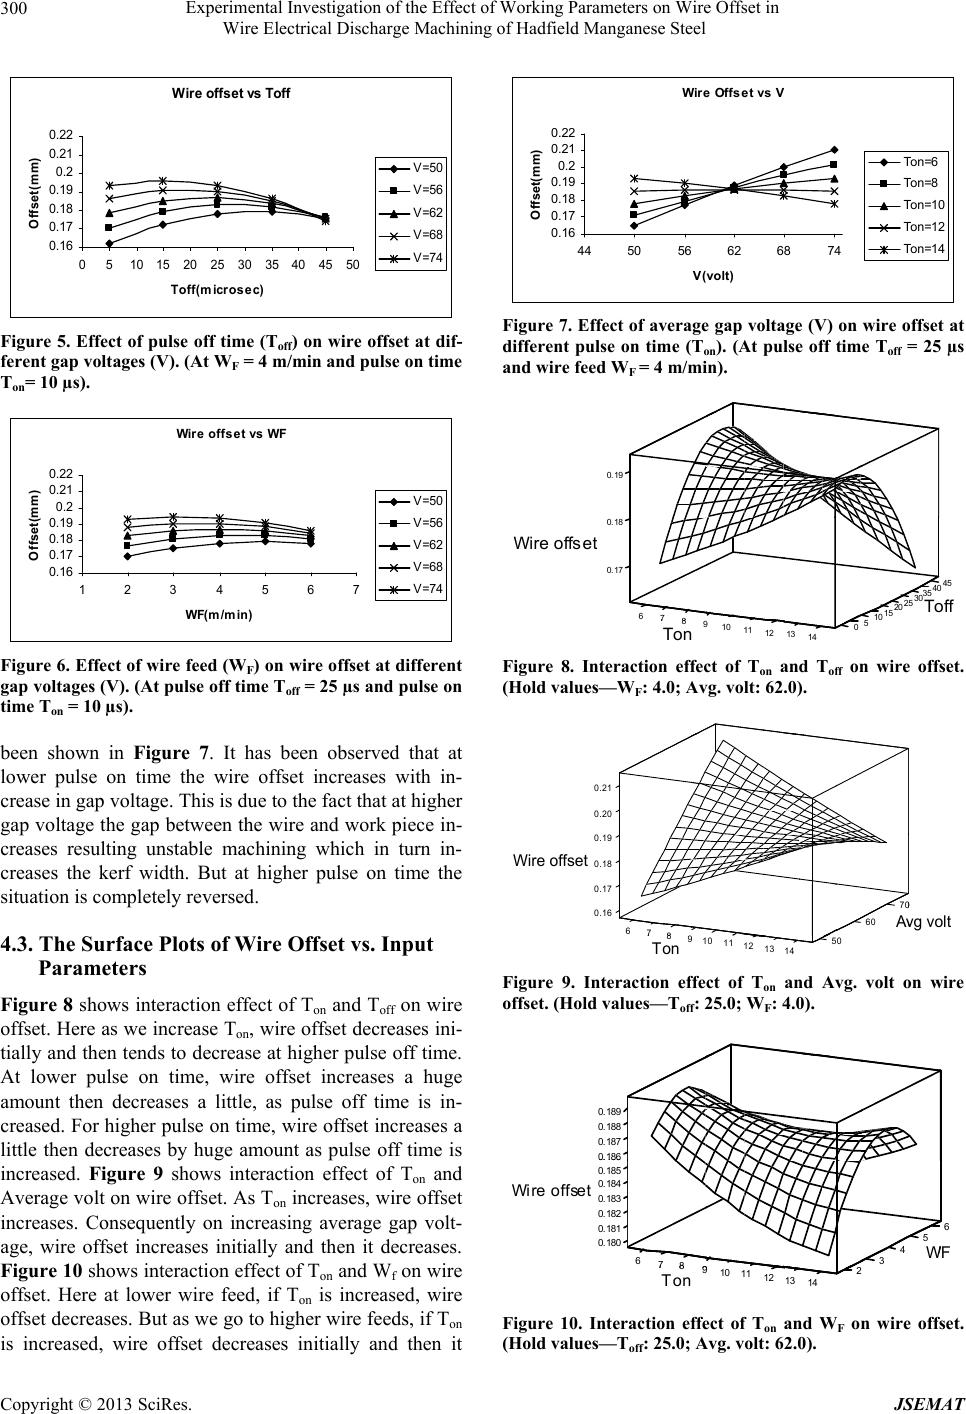 Experimental Investigation of the Effect of Working Parameters on Wire Offset in Wire Electrical Discharge Machining of Hadfield Manganese Steel 300 Wire offset vs To ff 0.16 0.17 0.18 0.19 0.2 0.21 0.22 051015 20 25 30 354045 50 Toff(microsec) Offset(mm) V=50 V=56 V=62 V=68 V=74 Figure 5. Effect of pulse off time (Toff) on wire offset at dif- ferent gap voltages (V). (At WF = 4 m/min and pulse on time Ton= 10 µs). Wire offset vs WF 0.16 0.17 0.18 0.19 0.2 0.21 0.22 1234567 WF(m/ min) Offset(mm) V=50 V=56 V=62 V=68 V=74 Figure 6. Effect of wire feed (WF) on wire offset at different gap voltages (V). (At pulse off time Toff = 25 µs and pulse on time Ton = 10 µs). been shown in Figure 7. It has been observed that at lower pulse on time the wire offset increases with in- crease in gap voltage. This is due to the fact that at higher gap voltage the gap between the wire and work piece in- creases resulting unstable machining which in turn in- creases the kerf width. But at higher pulse on time the situation is completely reversed. 4.3. The Surface Plots of Wire Offset vs. Input Parameters Figure 8 shows interaction effect of Ton and Toff on wire offset. Here as we increase Ton, wire offset decreases ini- tially and then tends to decrease at higher pulse off time. At lower pulse on time, wire offset increases a huge amount then decreases a little, as pulse off time is in- creased. For higher pulse on time, wire offset increases a little then decreases by huge amount as pulse off time is increased. Figure 9 shows interaction effect of Ton and Average volt on wire offset. As Ton increases, wire offset increases. Consequently on increasing average gap volt- age, wire offset increases initially and then it decreases. Figure 10 shows interaction effect of Ton and Wf on wire offset. Here at lower wire feed, if Ton is increased, wire offset decreases. But as we go to higher wire feeds, if Ton is increased, wire offset decreases initially and then it Wire Offset vs V 0.16 0.17 0.18 0.19 0.2 0.21 0.22 44 5056 62 6874 V(volt) Offset(mm) Ton=6 Ton=8 Ton=10 Ton=12 Ton=14 Figure 7. Effect of average gap voltage (V) on wire offset at different pulse on time (Ton). (At pulse off time Toff = 25 µs and wire feed WF = 4 m/min). 0.17 0.18 W i r e offset 910 11 12 To n 6 0.19 45 40 35 30 25 20 Toff 15 10 5 13 14 0 Figure 8. Interaction effect of Ton and Toff on wire offset. (Hold values—WF: 4.0; Avg. volt: 62.0). 0.16 0.17 0.18 0.19 Wire offset 910 11 12 Ton 6 0.20 0.21 13 50 14 70 A 60 g volt Figure 9. Interaction effect of Ton and Avg. volt on wire offset. (Hold values—Toff: 25.0; WF: 4.0). 0.180 0.181 0.182 0.183 0.184 0.185 . Wir e off set 910 11 12 Ton 6 0.186 0.187 0.188 0.189 13 2 14 5 4 3 6 F Figure 10. Interaction effect of Ton and WF on wire offset. (Hold values—Toff: 25.0; Avg. volt: 62.0). Copyright © 2013 SciRes. JSEMAT 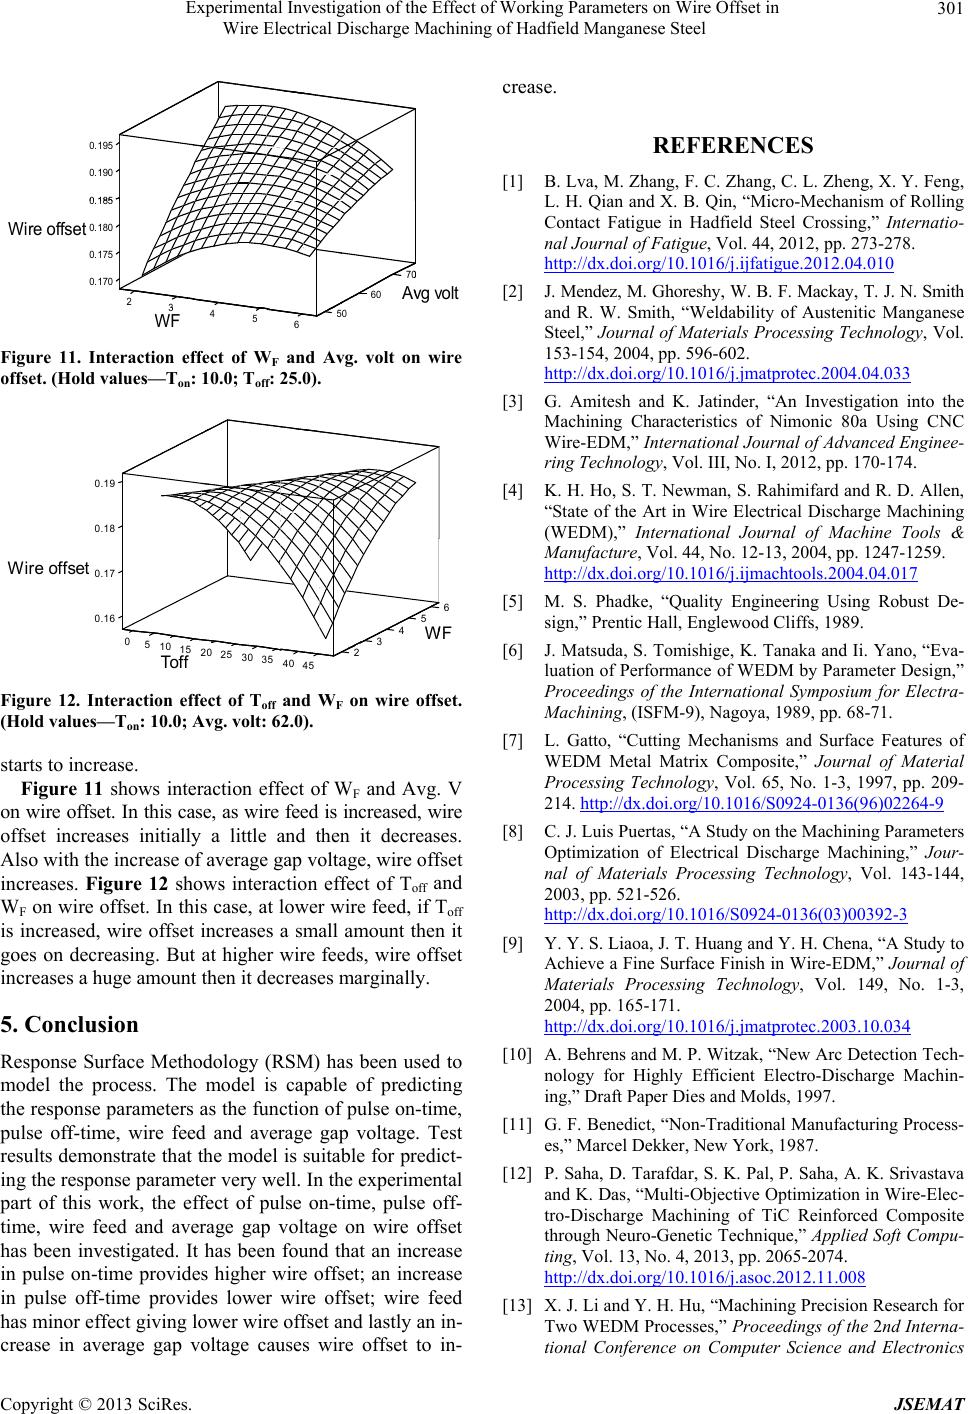 Experimental Investigation of the Effect of Working Parameters on Wire Offset in Wire Electrical Discharge Machining of Hadfield Manganese Steel 301 0.170 0.175 0.180 . Wire offset 45 WF 2 0.190 0.195 50 6 7 A 60 g vol Figure 11. Interaction effect of WF and Avg. volt on wire offset. (Hold values—Ton: 10.0; Toff: 25.0). 0 0.16 510 0.17 15 20 25 30 35 W ire offset Toff 0.18 0.19 40 2 45 5 4 3 6 F Figure 12. Interaction effect of Toff and WF on wire offset. (Hold values—Ton: 10.0; Avg. volt: 62.0). starts to increase. Figure 11 shows interaction effect of WF and Avg. V on wire offset. In this case, as wire feed is increased, wire offset increases initially a little and then it decreases. Also with the increase of average gap voltage, wire offset increases. Figure 12 shows interaction effect of Toff and WF on wire offset. In this case, at lower wire feed, if Toff is increased, wire offset increases a small amount then it goes on decreasing. But at higher wire feeds, wire offset increases a huge amount then it decreases marginally. 5. Conclusion Response Surface Methodology (RSM) has been used to model the process. The model is capable of predicting the response parameters as the function of pulse on-time, pulse off-time, wire feed and average gap voltage. Test results demonstrate that the model is suitable for predict- ing the response parameter very well. In the experimental part of this work, the effect of pulse on-time, pulse off- time, wire feed and average gap voltage on wire offset has been investigated. It has been found that an increase in pulse on-time provides higher wire offset; an increase in pulse off-time provides lower wire offset; wire feed has minor effect giving lower wire offset and lastly an in- crease in average gap voltage causes wire offset to in- crease. REFERENCES [1] B. Lva, M. Zhang, F. C. Zhang, C. L. Zheng, X. Y. Feng, L. H. Qian and X. B. Qin, “Micro-Mechanism of Rolling Contact Fatigue in Hadfield Steel Crossing,” Internatio- nal Journal of Fatigue, Vol. 44, 2012, pp. 273-278. http://dx.doi.org/10.1016/j.ijfatigue.2012.04.010 [2] J. Mendez, M. Ghoreshy, W. B. F. Mackay, T. J. N. Smith and R. W. Smith, “Weldability of Austenitic Manganese Steel,” Journal of Materials Processing Technology, Vol. 153-154, 2004, pp. 596-602. http://dx.doi.org/10.1016/j.jmatprotec.2004.04.033 [3] G. Amitesh and K. Jatinder, “An Investigation into the Machining Characteristics of Nimonic 80a Using CNC Wire-EDM,” International Journal of Advanced Enginee- ring Technology, Vol. III, No. I, 2012, pp. 170-174. [4] K. H. Ho, S. T. Newman, S. Rahimifard and R. D. Allen, “State of the Art in Wire Electrical Discharge Machining (WEDM),” International Journal of Machine Tools & Manufacture, Vol. 44, No. 12-13, 2004, pp. 1247-1259. http://dx.doi.org/10.1016/j.ijmachtools.2004.04.017 [5] M. S. Phadke, “Quality Engineering Using Robust De- sign,” Prentic Hall, Englewood Cliffs, 1989. [6] J. Matsuda, S. Tomishige, K. Tanaka and Ii. Yano, “Eva- luation of Performance of WEDM by Parameter Design,” Proceedings of the International Symposium for Electra- Machining, (ISFM-9), Nagoya, 1989, pp. 68-71. [7] L. Gatto, “Cutting Mechanisms and Surface Features of WEDM Metal Matrix Composite,” Journal of Material Processing Technology, Vol. 65, No. 1-3, 1997, pp. 209- 214. http://dx.doi.org/10.1016/S0924-0136(96)02264-9 [8] C. J. Luis Puertas, “A Study on the Machining Parameters Optimization of Electrical Discharge Machining,” Jour- nal of Materials Processing Technology, Vol. 143-144, 2003, pp. 521-526. http://dx.doi.org/10.1016/S0924-0136(03)00392-3 [9] Y. Y. S. Liaoa, J. T. Huang and Y. H. Chena, “A Study to Achieve a Fine Surface Finish in Wire-EDM,” Journal of Materials Processing Technology, Vol. 149, No. 1-3, 2004, pp. 165-171. http://dx.doi.org/10.1016/j.jmatprotec.2003.10.034 [10] A. Behrens and M. P. Witzak, “New Arc Detection Tech- nology for Highly Efficient Electro-Discharge Machin- ing,” Draft Paper Dies and Molds, 1997. [11] G. F. Benedict, “Non-Traditional Manufacturing Process- es,” Marcel Dekker, New York, 1987. [12] P. Saha, D. Tarafdar, S. K. Pal, P. Saha, A. K. Srivastava and K. Das, “Multi-Objective Optimization in Wire-Elec- tro-Discharge Machining of TiC Reinforced Composite through Neuro-Genetic Technique,” Applied Soft Compu- ting, Vol. 13, No. 4, 2013, pp. 2065-2074. http://dx.doi.org/10.1016/j.asoc.2012.11.008 [13] X. J. Li and Y. H. Hu, “Machining Precision Research for Two WEDM Processes,” Proceedings of the 2nd Interna- tional Conference on Computer Science and Electronics Copyright © 2013 SciRes. JSEMAT 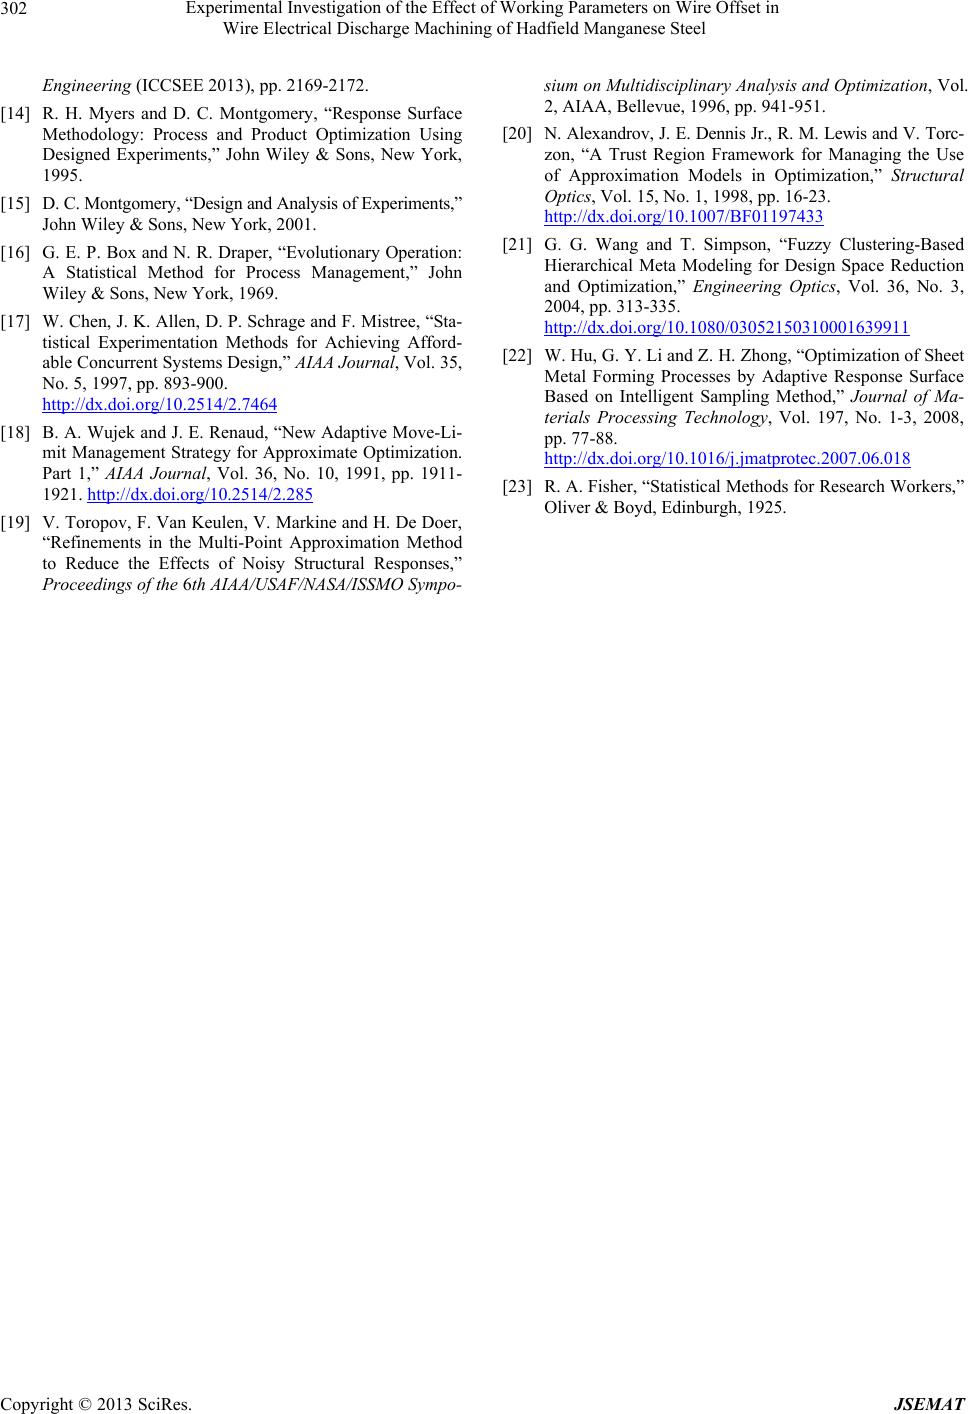 Experimental Investigation of the Effect of Working Parameters on Wire Offset in Wire Electrical Discharge Machining of Hadfield Manganese Steel Copyright © 2013 SciRes. JSEMAT 302 Engineering (ICCSEE 2013), pp. 2169-2172. [14] R. H. Myers and D. C. Montgomery, “Response Surface Methodology: Process and Product Optimization Using Designed Experiments,” John Wiley & Sons, New York, 1995. [15] D. C. Montgomery, “Design and Analysis of Experiments,” John Wiley & Sons, New York, 2001. [16] G. E. P. Box and N. R. Draper, “Evolutionary Operation: A Statistical Method for Process Management,” John Wiley & Sons, New York, 1969. [17] W. Chen, J. K. Allen, D. P. Schrage and F. Mistree, “Sta- tistical Experimentation Methods for Achieving Afford- able Concurrent Systems Design,” AIAA Journal, Vol. 35, No. 5, 1997, pp. 893-900. http://dx.doi.org/10.2514/2.7464 [18] B. A. Wujek and J. E. Renaud, “New Adaptive Move-Li- mit Management Strategy for Approximate Optimization. Part 1,” AIAA Journal, Vol. 36, No. 10, 1991, pp. 1911- 1921. http://dx.doi.org/10.2514/2.285 [19] V. Toropov, F. Van Keulen, V. Markine and H. De Doer, “Refinements in the Multi-Point Approximation Method to Reduce the Effects of Noisy Structural Responses,” Proceedings of the 6th AIAA/USAF/NASA/ISSMO Sympo- sium on Multidisciplinary Analysis and Optimization, Vol. 2, AIAA, Bellevue, 1996, pp. 941-951. [20] N. Alexandrov, J. E. Dennis Jr., R. M. Lewis and V. Torc- zon, “A Trust Region Framework for Managing the Use of Approximation Models in Optimization,” Structural Optics, Vol. 15, No. 1, 1998, pp. 16-23. http://dx.doi.org/10.1007/BF01197433 [21] G. G. Wang and T. Simpson, “Fuzzy Clustering-Based Hierarchical Meta Modeling for Design Space Reduction and Optimization,” Engineering Optics, Vol. 36, No. 3, 2004, pp. 313-335. http://dx.doi.org/10.1080/03052150310001639911 [22] W. Hu, G. Y. Li and Z. H. Zhong, “Optimization of Sheet Metal Forming Processes by Adaptive Response Surface Based on Intelligent Sampling Method,” Journal of Ma- terials Processing Technology, Vol. 197, No. 1-3, 2008, pp. 77-88. http://dx.doi.org/10.1016/j.jmatprotec.2007.06.018 [23] R. A. Fisher, “Statistical Methods for Research Workers,” Oliver & Boyd, Edinburgh, 1925.
|