 Modern Economy, 2013, 4, 1-8 http://dx.doi.org/10.4236/me.2013.410A001 Published Online October 2013 (http://www.scirp.org/journal/me) The Impact of Meal Attributes and Nudging on Healthy Meal Consumption —Evidence from a Lunch Restaurant Field Experiment Linda Thunström1,2, Jonas Nordström3,4 1HUI Research AB, Stockholm, Sweden 2Department of Economics and Finance, University of Wyoming, Laramie, USA 3Department of Economics, Lund University, Lund, Sweden 4Department of Food and Resource Economics, University of Copenhagen, Frederiksberg C, Denmark Email: lthunstr@uwyo.edu, jonas.nordstrom@nek.lu.se Received July 9, 2013; revised August 10, 2013; accepted September 4, 2013 Copyright © 2013 Linda Thunström, Jonas Nordström. This is an open access article distributed under the Creative Commons Attri- bution License, which permits unrestricted use, distribution, and reproduction in any medium, provided the original work is properly cited. ABSTRACT We use a field experiment in a lunch restaurant to analyze how meal attributes and a “nudge” impact healthy labeled meal consumption. The nudge consists of increasing the salience of healthy labeled meals by placing them at the top of the menu. We find that certain meal attributes (e.g. poultry and red meat) greatly increase both sales and the market share of the healthy labeled meal. We conclude that a careful design of the healthy food supply may be efficient in en- couraging healthier meal choices, e.g. supplying healthy labeled versions of popular conventional meals. We find no impact on healthy labeled meal sales from the nudge. Keywords: Healthy Food; Restaurant Meals; Food Supply; Meal Attributes; Nudging; Field Experiment 1. Introduction The modern western diet is often high in calories while low in healthy nutrients. In combination with a more sedentary lifestyle, the characteristics of the modern diet have been proven to be toxic: they have placed obesity, overweight, and several serious diet related diseases (e.g., several types of cancer, diabetes, cardiovascular disease, high blood pressure and osteoporosis) at the top of the list on public health problems in many countries, both developed and developing. To encourage healthier food choices, policy reforms that entail information, such as nutrition labelling, and taxes on unhealthy food have been implemented, e.g., legislated menu labelling in many states in the US (start- ing in New York City, 2008), and taxes on unhealthy food and beverages in Denmark, Finland, France and Hungary, introduced in 2011-2012. However, field evidence of the impact on healthy food consumption from information is at best mixed. Many studies find no effect on the nutritional quality of con- sumption from nutritional information, even when it is the most visible, such as point-of-purchase menu label- ling (e.g. [1-4]). Further, research on the impact of food tax reforms implies that taxes of the magnitudes that are politically feasible are likely to have little impact on food consumption (e.g., [5-8]). In essence, information and moderate price incentives do not seem to substantially impact healthier food consumption1. This may be a result of taste being one of the main determinants of food choice, often found to dominate both health and price (e.g. [11-13]). Taste is largely determined by attributes in food. Thunström and Nordström, [3], find that sales of con- ventional meals substantially increase from certain at- tributes, mainly poultry and red meat. They also find that sales of conventional meals benefit from a “nudge” that displays the meal at the top of the menu. Their results render the question if designing healthy labelled meals containing generally popular, or tasty, meal attributes 1Other policy initiatives are aimed at increasing the supply of healthy foods in areas where availability has been limited (see e.g. the “Healthy Corner Store Initiative” in Philadelphia, US). Research on the impact on food consumption of increased availability to healthy food shows at best limited effects (see e.g. [9,10]). Also, the prevalence of diet related illnesses is high even in areas where healthy food is highly available; suggesting that increased availability may not be a key in reducing the overall prevalence of diet related illnesses. C opyright © 2013 SciRes. ME  L. THUNSTRÖM, J. NORDSTRÖM 2 (poultry and red meat) and nudging could be used to successfully promote healthy eating, i.e. to encourage healthy labelled meal consumption? In this paper, we use data from a field experiment to analyze the impact on healthy labelled meal sales from manipulating meal attributes and a “nudge”. Nudging entails make the preferred choice (from a policy perspec- tive) more salient than other choice alternatives, thereby encouraging consumers to make socially desirable choices with minimal paternalism, i.e. without restricting the consumer choice set (see e.g. [14]). We summarize the aim of the paper in the following hypotheses that we test empirically: Hypothesis 1. “Popular meal attributes can be used in healthy labelled meals to increase consumption of healthy labelled meals.” Hypothesis 2. “Nudging consumers by displaying the healthy labelled meal at the top of the menu positively impact consumption of healthy labelled meals.” In our empirical analysis, we measure consumption with sales data. To the best of our knowledge, no study has previously analyzed the impact of meal design, in terms of attributes, on healthy meal consumption. Menu nudges have previously been shown to positively impact healthy food choices [15,16]2. 2. The Field Experiment and Empirical Analysis Our analysis is based on a subset of data from the field experiment reported in [3]. The experiment was con- ducted in a lunch restaurant at an industry company in southern Sweden. Collecting data from a field experi- ment to perform our study has several important benefits. The field experiment allows us to analyze the impact on healthy labelled meal sales from meal attribute manipu- lation and nudging, while holding constant prices, and potentially also perceived nutritional content. Prices of all meals (the healthy labelled meal and its non-labelled substitute meals) are equal and constant throughout the study period. The restaurant setting of the experiment is also conducive to controlling for consumers’ perceived nutritional content of meals: the nutritional content varies over meals, but is likely to be non-transparent to con- sumers. Evidence suggests consumers have difficulties in making accurate estimates of the nutritional content of prepared meals away from home [17]. Therefore, con- sumers in a restaurant are likely to largely rely on the healthy label to distinguish healthy meals from less healthy meals. Another benefit of the experiment data is that meal prices and meal supply were not influenced by the au- thors of this study. The restaurant is privately owned and therefore guided by profit maximization. This ensures that the empirical analysis is based on combinations of meals, inputs and input costs that are part of a profit maximizing strategy, while it for instance rules out healthy meals or inputs that significantly may impact sales, but would be too expensive to supply by a profit maximizing entity. The restaurant at which the field experiment was per- formed is open to the general public, even if it primarily serves contractor employees. There are a couple of other lunch restaurants within walking distance. Restaurant staff estimates that approximately 10 - 20 percent of daily lunch eaters are civil servants, 80 - 90 percent are blue-collar workers, and 30 percent are women. The staff also estimates that the restaurant has an equal number of potential customers each week day, despite the shorter opening hours on Fridays. The lunch menu was posted outside the restaurant every day and customers could also get the menu via e-mail: the e-mail list contained ap- proximately 50 - 60 people. The restaurant introduced a healthy (Nordic “Keyhole”) labelled meal on the menu on the 20th of April, and re- ported meal sales for the following 6 weeks (27 business days), i.e., until 29th of May 2010. The Keyhole label has been a symbol for healthy food for 20 years in Sweden and is well-known among the general public as an indi- cator of healthy food choices. Meals eligible to carry the Keyhole symbol must fulfill certain criteria. The general criteria that applies for a Keyhole labeled meal are: the meal should contain 400 - 750 calories (1.67 - 3.14 MJ), max 30 energy percent from fat (more is allowed for seafood), max 3 grams of sugar per 100 gram, max 1 gram salt per 100 gram, be well-balanced and contain at least 100 gram of vegetables (excluding potatoes)3. The Keyhole label was given to one of the alternatives on the menu that fulfilled the Keyhole criteria. The same day, the menu could, however, contain non-labeled alterna- 2The nudge by Downs, Loewenstein and Wisdom, [15], increased the salience (and reduced the search cost) of low-calorie sandwiches, rela- tive to higher calorie substitutes, by providing subjects with a menu that contained low-calorie sandwiches on the front, and higher calorie sandwiches at the back. They found that providing subjects with such a menu significantly increased the percent of subjects choosing low- calorie sandwiches, compared to when subjects were provided a menu that contained a mixed of low and high calorie sandwiches at the front. The nudge examined by Ellison, Lusk and Davis, [16], does not entail re-arranging the order of meals on the menu—they use a field experi- ment to examine the impact of the traffic label, versus numeric calorie labels, in front of menu alternatives. They find that the traffic label may be more efficient than numeric calorie labels in promoting healthy food choices. 3See www.nyckelhalsrestaurang.se. 4In particular, on a large number of occasions (19 days), at least one o the non-labeled alternatives on the menu contained less calories per ortion than the Keyhole-labeled alternative served the same day (sometimes even lower than the lower limit for the Keyhole calorie criteria, i.e. 400 kcal/portion). Also, on 11 days, the fat content pe ortion was lower for non-labeled alternatives than it was for the healthy labeled alternative. It should, however, be noted that the amount of calories and fat per portion is subject to uncertainty, as ex- lained below. Copyright © 2013 SciRes. ME  L. THUNSTRÖM, J. NORDSTRÖM 3 tives that fully or partly fulfilled the criteria as well4. Hereafter, the Keyhole labeled meal will be referred to as the healthy labeled meal. The order of the healthy labelled meal on the menu was varied over the study period, and the data contains information on where on the menu the healthy labelled meal was displayed, the type of meals served each day, and the amount sold of each meal. A nutritionist assigned each meal its calorie and fat content per portion, using the software Dietist XP5. The restaurant was open all workdays, Monday to Friday, and closed at 6 pm all weekdays, except Fridays, when it closed at 3 pm. Every day one healthy labelled meal and two non-labelled substitute meals were offered on the menu, except April 30th, when only one non-la- belled substitute meal was served. The price of all meals was the same (SEK 63). 2.1. Data from the Experiment We created 1) a set of dummy variables for the source of protein in the healthy labelled meals (red meat, poultry, fish or seafood or vegetarian; yes = 1; no = 0), 2) a set of dummy variables for the source of protein in the substi- tute meals (any of the substitute meals containing red meat, poultry, seafood (including fish), or being vegetar- ian: yes = 1; no = 0), 3) a couple of dummy variables indicating the order of the healthy labelled meal on the menu (first on the menu, versus second or last: yes = 1; no = 0)6, and 4) a set of dummy variables indicating weekday (Monday, Tuesday-Thursday, or Friday: yes = 1; no = 0). We also include fat content in the analysis: fat in meals can be both positively and negatively valued by consumers—fat is taste increasing [18], but may pose a health risk if over consumed. Table 1 shows descriptive statistics of the variables included in the analysis. Table 1 shows that the average number of portions served of the healthy labelled meal per day was 153 dur- ing the study period, and that the average market share of the healthy labelled meal was 44 percent, where the market share is equal to the number of portions sold of the healthy labelled meal, divided by the total number of portions sold that day. The highest number sold of the healthy labelled meal was 232—a healthy labelled tradi- tional Swedish dish: meatballs and mashed potatoes with lingon berries, displayed at the top of the menu and served on a Monday, and where the substitute meals con- stituted of a meal with poultry and a meal with seafood. The market share of this healthy labelled meal was 64 percent. The highest market share (68 percent) on any day during the study period was held by a healthy la- belled version of another traditional Swedish dish: “Skansk kallops” (a beef stew from the Skane region) with boiled potatoes and beetroot, displayed at the top of the menu and served on a Friday, where the non-labelled substitute meals contained seafood. The lowest number sold per day of the healthy labelled meal was 52, and the lowest market share of the healthy labelled meal was 14 percent. The same meal holds both these records—vegetarian spring rolls, with curry sauce and rice, served on a Tuesday, Wednesday or Thursday, displayed second or last on the menu, and where the non-labelled substitute meals constituted of a meal with red meat and a vegetarian meal. 2.2. Empirical Analysis To analyze the factors that influence sales and the market share of the healthy labeled meal, we use the above data to estimate two different models represented by: Keyhole SzD In our first model, the content of vector Keyhole is daily number of portions sold of healthy labelled meals at t (t = 1,, 27). In our second model, Keyhole is a vector of the daily market share of the healthy labeled meal at t. The vector z contains grams of fat per portion in the healthy labelled meal. D contains the dummy variables indicating the source of protein of the healthy labelled meal, and the dummy variables indicating the source of protein in the non-healthy labelled substitute meals. D also contains the weekday dummy variables, and the dummy variable indicating if the healthy labelled meal appears second or third on the menu. Note that the refer- ence meal is a healthy labelled meal that contains sea- food, is displayed at the top of the menu and is sold on a Monday, with at least one of the substitute meals also containing seafood7. S S To test for autocorrelation in both models, we use Durbin’s alternative test, which allows for non-normally distributed residuals. The test implies that we cannot onfirm the null hypothesis of no autocorrelation in the c 7In an initial specification of the model we also included fat content o the non-labelled meal alternatives, as well as calorie content of both the healthy labelled and non-labelled meal alternatives, as explanatory variables. We did so based on the idea that both calories and fat could ositively impact tas e. Further, calorie and fat content can also be seen as control variables for the healthiness of the non-labeled alternatives. However, t-tests implied that in no case could we reject the null hy- othesis that these variables had no impact on healthy labeled meal sales. We used an F-test to examine if the variables as a group contrib- uted to the explanatory power of the model, but could not reject the null hypothesis that they did not; F(5, 11) = 0.45, p-value = 0.806. We de- cided not to include calories and fat content of substitute meals in the model. 5In Dietist XP, portion sizes are generally based on portions consumed, not portions served. The nutritional values found in our data are there- fore generally smaller than nutritional values calculated based on por- tions served at restaurants. The nutritional content of the meals is also subject to uncertainties, since the nutritional contents have been calcu- lated based on meal descriptions as found on the menu, where cooking rocedures, portion sizes, etc., are unknown. 6Only during a couple of days of the study period did the healthy la- beled meal appear last on the menu. We therefore merged 2nd and 3rd on the menu into a single dummy variable. Copyright © 2013 SciRes. ME 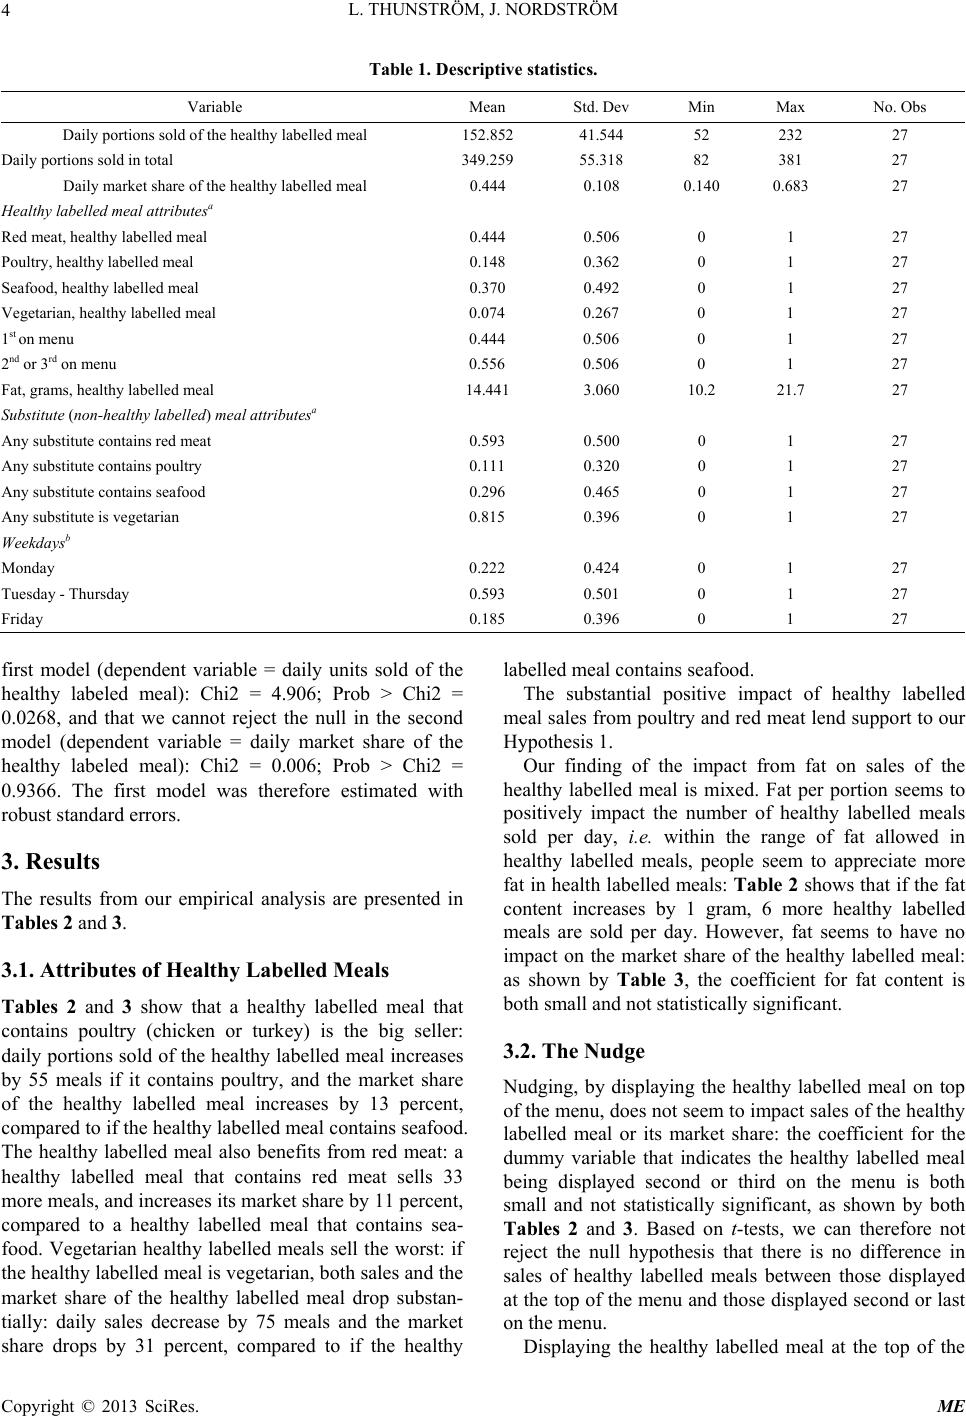 L. THUNSTRÖM, J. NORDSTRÖM Copyright © 2013 SciRes. ME 4 Table 1. Descriptive statistics. Variable Mean Std. Dev Min Max No. Obs Daily portions sold of the healthy labelled meal 152.852 41.544 52 232 27 Daily portions sold in total 349.259 55.318 82 381 27 Daily market share of the healthy labelled meal 0.444 0.108 0.140 0.683 27 Healthy labelled meal attributesa Red meat, healthy labelled meal 0.444 0.506 0 1 27 Poultry, healthy labelled meal 0.148 0.362 0 1 27 Seafood, healthy labelled meal 0.370 0.492 0 1 27 Vegetarian, healthy labelled meal 0.074 0.267 0 1 27 1st on menu 0.444 0.506 0 1 27 2nd or 3rd on menu 0.556 0.506 0 1 27 Fat, grams, healthy labelled meal 14.441 3.060 10.2 21.7 27 Substitute (non-healthy labelled) meal attributesa Any substitute contains red meat 0.593 0.500 0 1 27 Any substitute contains poultry 0.111 0.320 0 1 27 Any substitute contains seafood 0.296 0.465 0 1 27 Any substitute is vegetarian 0.815 0.396 0 1 27 Weekdaysb Monday 0.222 0.424 0 1 27 Tuesday - Thursday 0.593 0.501 0 1 27 Friday 0.185 0.396 0 1 27 first model (dependent variable = daily units sold of the healthy labeled meal): Chi2 = 4.906; Prob > Chi2 = 0.0268, and that we cannot reject the null in the second model (dependent variable = daily market share of the healthy labeled meal): Chi2 = 0.006; Prob > Chi2 = 0.9366. The first model was therefore estimated with robust standard errors. 3. Results The results from our empirical analysis are presented in Tables 2 and 3. 3.1. Attributes of Healthy Labelled Meals Tables 2 and 3 show that a healthy labelled meal that contains poultry (chicken or turkey) is the big seller: daily portions sold of the healthy labelled meal increases by 55 meals if it contains poultry, and the market share of the healthy labelled meal increases by 13 percent, compared to if the healthy labelled meal contains seafood. The healthy labelled meal also benefits from red meat: a healthy labelled meal that contains red meat sells 33 more meals, and increases its market share by 11 percent, compared to a healthy labelled meal that contains sea- food. Vegetarian healthy labelled meals sell the worst: if the healthy labelled meal is vegetarian, both sales and the market share of the healthy labelled meal drop substan- tially: daily sales decrease by 75 meals and the market share drops by 31 percent, compared to if the healthy labelled meal contains seafood. The substantial positive impact of healthy labelled meal sales from poultry and red meat lend support to our Hypothesis 1. Our finding of the impact from fat on sales of the healthy labelled meal is mixed. Fat per portion seems to positively impact the number of healthy labelled meals sold per day, i.e. within the range of fat allowed in healthy labelled meals, people seem to appreciate more fat in health labelled meals: Table 2 shows that if the fat content increases by 1 gram, 6 more healthy labelled meals are sold per day. However, fat seems to have no impact on the market share of the healthy labelled meal: as shown by Table 3, the coefficient for fat content is both small and not statistically significant. 3.2. The Nudge Nudging, by displaying the healthy labelled meal on top of the menu, does not seem to impact sales of the healthy labelled meal or its market share: the coefficient for the dummy variable that indicates the healthy labelled meal being displayed second or third on the menu is both small and not statistically significant, as shown by both Tables 2 an d 3. Based on t-tests, we can therefore not reject the null hypothesis that there is no difference in sales of healthy labelled meals between those displayed at the top of the menu and those displayed second or last on the menu. D isplaying the healthy labelled meal at the top of the 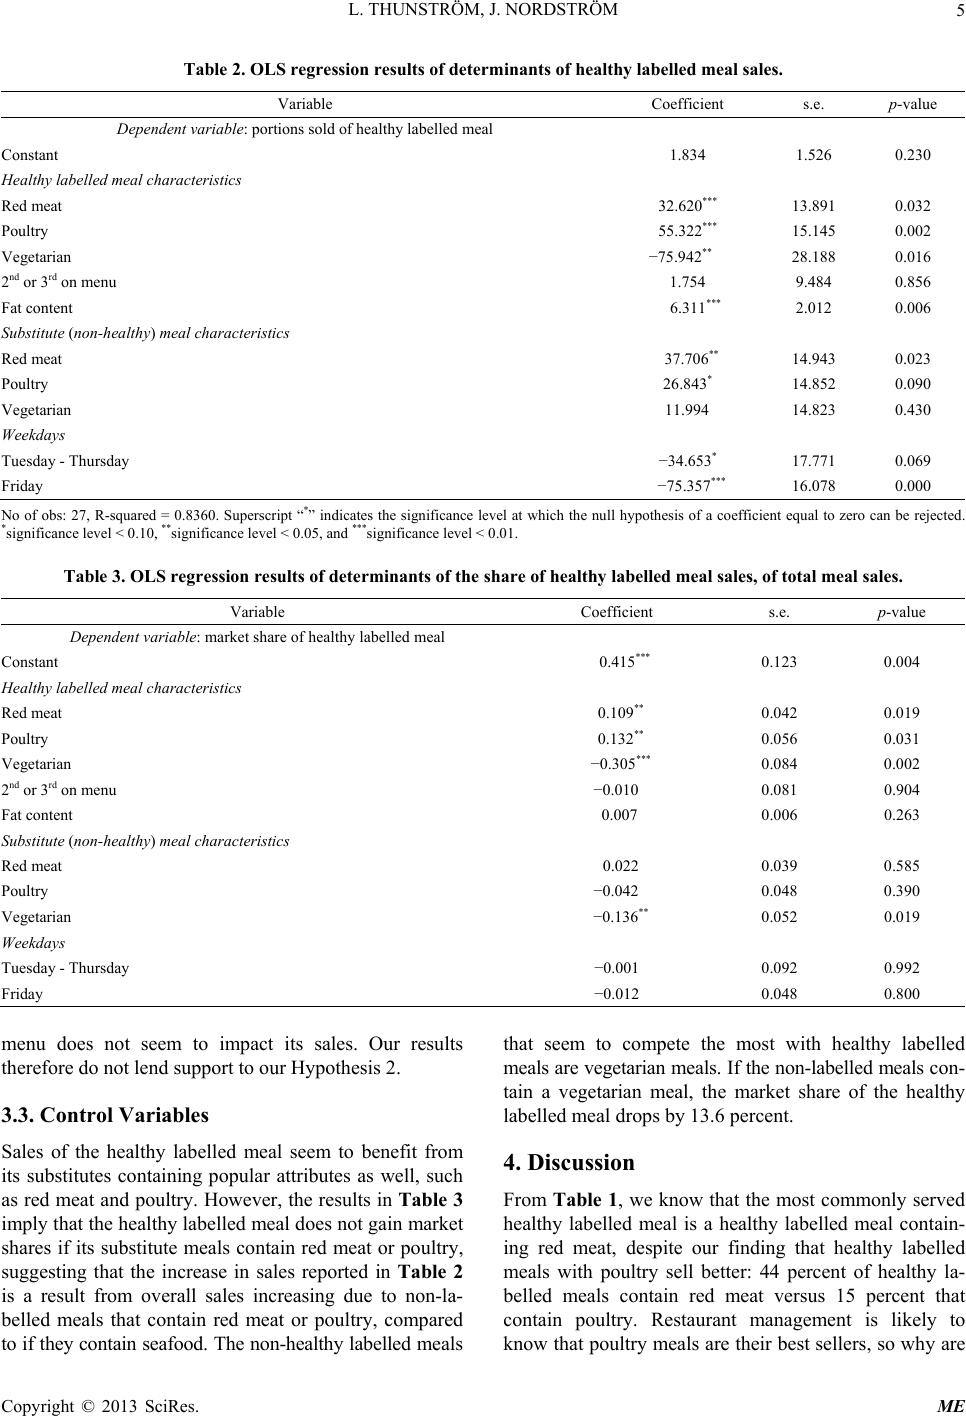 L. THUNSTRÖM, J. NORDSTRÖM 5 Table 2. OLS regression results of determinants of healthy labelled meal sales. Variable Coefficient s.e. p-value Dependent variable: portions sold of healthy labelled meal Constant 1.834 1.526 0.230 Healthy labelled meal characteristics Red meat 32.620*** 13.891 0.032 Poultry 55.322*** 15.145 0.002 Vegetarian −75.942** 28.188 0.016 2nd or 3rd on menu 1.754 9.484 0.856 Fat content 6.311*** 2.012 0.006 Substitute (non-healthy) meal characteristics Red meat 37.706** 14.943 0.023 Poultry 26.843* 14.852 0.090 Vegetarian 11.994 14.823 0.430 Weekdays Tuesday - Thursday −34.653* 17.771 0.069 Friday −75.357*** 16.078 0.000 No of obs: 27, R-squared = 0.8360. Superscript “*” indicates the significance level at which the null hypothesis of a coefficient equal to zero can be rejected. *significance level < 0.10, **significance level < 0.05, and ***significance level < 0.01. Table 3. OLS regression results of determinants of the share of healthy labelled meal sales, of total meal sales. Variable Coefficient s.e. p-value Dependent variable: market share of healthy labelled meal Constant 0.415*** 0.123 0.004 Healthy labelled meal characteristics Red meat 0.109** 0.042 0.019 Poultry 0.132** 0.056 0.031 Vegetarian −0.305*** 0.084 0.002 2nd or 3rd on menu −0.010 0.081 0.904 Fat content 0.007 0.006 0.263 Substitute (non-healthy) meal characteristics Red meat 0.022 0.039 0.585 Poultry −0.042 0.048 0.390 Vegetarian −0.136** 0.052 0.019 Weekdays Tuesday - Thursday −0.001 0.092 0.992 Friday −0.012 0.048 0.800 menu does not seem to impact its sales. Our results therefore do not lend support to our Hypothesis 2. 3.3. Control Variables Sales of the healthy labelled meal seem to benefit from its substitutes containing popular attributes as well, such as red meat and poultry. However, the results in Table 3 imply that the healthy labelled meal does not gain market shares if its substitute meals contain red meat or poultry, suggesting that the increase in sales reported in Table 2 is a result from overall sales increasing due to non-la- belled meals that contain red meat or poultry, compared to if they contain seafood. The non-healthy labelled meals that seem to compete the most with healthy labelled meals are vegetarian meals. If the non-labelled meals con- tain a vegetarian meal, the market share of the healthy labelled meal drops by 13.6 percent. 4. Discussion From Table 1, we know that the most commonly served healthy labelled meal is a healthy labelled meal contain- ing red meat, despite our finding that healthy labelled meals with poultry sell better: 44 percent of healthy la- belled meals contain red meat versus 15 percent that contain poultry. Restaurant management is likely to know that poultry meals are their best sellers, so why are Copyright © 2013 SciRes. ME  L. THUNSTRÖM, J. NORDSTRÖM 6 healthy labelled meals that contain red meat more com- mon than those containing poultry? For one, overall profit of the restaurant may not be maximized by maxi- mizing sales of the healthy labelled meal. Also, poultry in healthy labelled meals may be a more expensive input than red meat. Vegetarian healthy labelled meals are un- common, though, which is in line with our finding that vegetarian healthy labelled meals are a hard sell. Table 1 shows that only 7 percent of the healthy labelled meals served up during the study period were vegetarian. How does meal attributes affect sales of healthy la- belled meals compared to sales of conventional meals? Comparing our findings to the results in [3] we find that the top-selling sources of protein are the same for healthy labelled meals and conventional meals, but the impact on healthy labelled meal sales is greater. For instance, Thunström and Nordström, [3], report that general meal sales increase by 41 meals if the meal contains poultry instead of seafood, and by 25 meals if the meal contains red meat. The corresponding numbers for the healthy labelled meal is 55 and 33 meals. This difference in sales increases between conventional meals and healthy la- belled meals from adding poultry or read meat to the meals is substantial in real terms, but represents even larger differences in percentage terms. Thunström and Nordström, [3], do not find a drop in sales for meals in general resulting from the meal being vegetarian, which differs from our results on sales of healthy labelled meals. Our finding that the order of display on the menu has no impact on sales seems contradictory to previous re- search. Thunström and Nordström, [3], find that the same nudge impacts sales of conventional meals. Downs, Loewenstein and Wisdom, [15], find that nudging in- creases sales of healthy sandwiches. The difference in results may be due to differences in salience between this study and Downs, Loewenstein and Wisdom: they show that sales of healthy sandwiches increase if healthy sandwiches are displayed on the front of a menu, while regular/unhealthy sandwiches are displayed on subse- quent pages. Menu nudging in their experiment therefore imposes an additional search cost on regular/unhealthy sandwiches (turning the page), compared to nudging in our experiment where all meals are displayed together with the healthy meal, with the healthy meal at the top of the menu. 5. Conclusions In this paper, we use a lunch restaurant field experiment to analyze the impact on sales and the market share of a healthy labeled meal from meal attributes, and from a “nudge”—displaying the healthy labeled meal at the top of the menu. We find that attributes of the healthy labelled meal, especially poultry and red meat, have a strong impact on both sales of the healthy labelled meal and their market share: by changing the composition of the healthy la- belled meal, sales of the healthy labelled meal may in- crease by 55 units (where 55 units is equal to 36 percent of average healthy labelled meal sales), and the market share of the healthy labelled meal may increase by 13 percentage points. We find no impact on sales or the market share of the healthy labelled meal from the nudge used in this study. Our results imply that designing healthy labelled meals to contain attributes generally preferred by consumers (i.e. desired in both non-healthy and healthy meals) may significantly impact healthy food choices. Regulating the content of the healthy meal supply may therefore be im- portant for agents that aim to create consumer incentives to choose healthy meals, such as restaurant managers, school board members or other policy makers. For our sample, sales of healthy meals benefit from the same ingredients as conventional meals—poultry and red meat —and lean versions of traditional meals are the top sell- ers. In other words, a successful strategy for increasing healthy meal consumption may be to supply healthy meals that mimic popular conventional meals, using cooking techniques and ingredients that reduce the num- ber of calories and nutrients often over consumed (un- healthy fats, salt, sugar, etc.). Our findings are encouraging, since results from pre- vious research that evaluates alternate policy measures designed to encourage healthy food choices are some- what disappointing. Providing nutritional information (e.g. menu labelling) seems to have limited impact on food choices [2,3,15,19-23], as do politically feasible food tax reforms [5-8,24]. The large impact on healthy labeled meal sales from meal attribute manipulation that we find in this study is especially encouraging given the context of the field ex- periment. First, the food analyzed here is prepared lunch meals away from home. Food away from home has been found to be one of the main causes of the increase in obesity and overweight [25-27], and of meals consumed away from home, lunch meals have been found to have the greatest impact on body weight [28]. Second, the customer base of the field experiment restaurant consists of consumer groups that generally show less of an inter- est in healthy eating: primarily male and blue-collar workers. The food attributes that appeal the most to consumers are likely to be context dependent, though, and may also vary over consumer groups. A question for future re- search is therefore how healthy meals and other foods (e.g., snacks) can be composed in order to encourage healthy food consumption in different contexts and over consumer groups. We also encourage future research to Copyright © 2013 SciRes. ME  L. THUNSTRÖM, J. NORDSTRÖM 7 formally analyze the impact of policies that manipulate food supply versus policy measures that entail informa- tion provision or tax reforms, as well as the impact of combinations of these measures, e.g. subsidies of healthy meals that contain preferred meal attributes. Finally, the nudge examined in this study seems to have no impact on healthy labeled meal consumption, even though the same nudge impacts consumption of conventional meals (see [3]). Promotion of healthy meal choices may require stronger nudges than simply placing the healthy labeled meal at the top of the menu. Future research may analyze how nudging can be designed to impact healthy labeled meal choices. For instance, does effective nudging re- quire that healthy meal alternatives are the “default op- tion”, with a high level of salience and search costs asso- ciated with finding non-healthy meal alternatives (e.g., turning the menu, or even asking for a separate, “non- healthy”, menu—see [15])? 6. Acknowledgements Financial support is gratefully acknowledged from the Swedish Council for Working Life and Social Research. We thank Eurest Dining Services for enabling this study by providing data. REFERENCES [1] C. Lee, P. Linneman, B. Elbel, R. Kersh, V. L. Brescoll and L. B. Dixon, “Calorie Labeling and Food Choices: A First Look at the Effects on Low-Income People in New York City,” Health Affairs, Vol. 28, No. 6, 2009, pp. 1110-1121. http://dx.doi.org/10.1377/hlthaff.28.6.w1110 [2] L. J. Harnack, S. A. French, J. M. Oakes, M. T. Story, R. W. Jeffery and S. A. Rydell, “Effects of Calorie Labeling and Value Size Pricing on Fast Food Meal Choices: Re- sults from an Experimental Trial,” International Journal of Behavioral Nutrition and Physical Activity, Vol. 5, No. 63, 2008. [3] L. Thunström and J. Nordström, “Does Easily Accessible Nutritional Labelling Increase Consumption of Healthy Meals Away from Home? A Field Experiment Measuring the Impact of a Point-of-Purchase Healthy Symbol on Lunch Sales,” Food Economics—Acta Agriculturae Scan- dinavica, Vol. 8, No. 4, 2011, pp. 200-207. [4] M. K. Vadiveloo, L. B. Dixon and B. Elbel, “Consumer Purchasing Patterns in Response to Calorie Labeling Leg- islation in New York City,” International Journal of Be- havioral Nutrition and Physical Activity, Vol. 8, 2011, p. 51. http://dx.doi.org/10.1186/1479-5868-8-51 [5] H. H. Chouinard, D. E. Davis, J. T. LaFrance and J. M. Perloff, “Fat Taxes: Big Money for Small Change,” Fo- rum for Health Economics & Policy, Vol. 10, No. 2, 2007. http://dx.doi.org/10.2202/1558-9544.1071 [6] J. Nordström and L. Thunström, “The Impact of Tax Re- forms Designed to Encourage a Healthier Grain Con- sumption,” Journal of Health Economics, Vol. 28, No. 3, 2009, pp. 622-634. http://dx.doi.org/10.1016/j.jhealeco.2009.02.005 [7] L. M. Powell and F. J. Chaloupka, “Food Prices and Obe- sity: Evidence and Policy Implications for Taxes and Subsidies,” Milbank Quarterly, Vol. 87, No. 1, 2009, pp. 229-257. http://dx.doi.org/10.1111/j.1468-0009.2009.00554.x [8] S. Smed, J. D. Jensen and S. Denver, “Socio-Economic Characteristics and the Effect of Taxation as a Health Policy Instrument,” Food Policy, Vol. 32, No. 5-6, 2007, pp. 624-639. http://dx.doi.org/10.1016/j.foodpol.2007.03.002 [9] N. Wrigley, D. Warm and B. Margetts, “Deprivation, Diet, and Food-Retail Access: Findings from the Leeds ‘Food Deserts’ Study,” Environment and Planning A, Vol. 35, No. 1, 2003, pp. 151-188. http://dx.doi.org/10.1068/a35150 [10] H. Lee, “The Role of Local Food Availability in Explain- ing Obesity Risk among Young School-Aged Children,” Social Science & Medicine, Vol. 74, No. 8, 2012, pp. 1193- 1203. http://dx.doi.org/10.1016/j.socscimed.2011.12.036 [11] M. Lennernäs, C. Fjellström, W. Becker, I. Giachetti, A. Schmitt, A. Remaut de Winter and M. Kearney, “Influ- ences on Food Choice Perceived to Be Important by Na- tionally-Representative Samples of Adults in the Euro- pean Union,” European Journal of Clinical Nutrition, Vol. 51, Suppl. 2, 1997, pp. S8-S15. [12] K. Glanz, M. Basil, E. Maibach, J. Goldberg and D. Sny- der, “Why Americans Eat What They Do: Taste, Nutri- tion, Cost, Convenience, and Weight Control Concerns as Influences on Food Consumption,” Journal of the Ameri- can Dietetic Association, Vol. 98, No. 10, 1998, pp. 1118- 1126. http://dx.doi.org/10.1016/S0002-8223(98)00260-0 [13] H. M. Blanck, A. L. Yaroch, A. A. Atienza, S. L. Yi, J. Zhang and L. C. Mâsse, “Factors Influencing Lunchtime Food Choices among Working Americans,” Health Edu- cation & Behavior, Vol. 36, No. 2, 2009, pp. 289-301. http://dx.doi.org/10.1177/1090198107303308 [14] R. H. Thaler and C. R. Sunstein, “Libertarian Paternal- ism,” American Economic Review, Vol. 93, No. 2, 2003, pp. 175-179. http://dx.doi.org/10.1257/000282803321947001 [15] J. S. Downs, G. Loewenstein and J. Wisdom, “Strategies for Promoting Healthier Food Choices,” American Eco- nomic Review, Vol. 99, No. 2, 2009, pp. 159-164. http://dx.doi.org/10.1257/aer.99.2.159 [16] B. D. Ellison, J. L. Lusk and D. W. Davis, “The Value and Cost of Restaurant Calorie Labels: Results from a Field Experiment,” 2012 AAEA/EAAE Food Environment Symposium, 30-31 May 2012, Boston. [17] S. Burton, E. Creyer, J. Kees and K. Huggins, “Attacking the Obesity Epidemic: The Potential Health Benefits of Providing Nutrition Information in Restaurants,” Ameri- can Journal of Public Health, Vol. 96, No. 9, 2006, pp. 1669-1675. http://dx.doi.org/10.2105/AJPH.2004.054973 [18] A. Drewnowski, “Energy Density, Palatability, and Sati- ety: Implications for Weight Control,” Nutrition Reviews, Vol. 56, No. 12, 1998, pp. 347-353. Copyright © 2013 SciRes. ME  L. THUNSTRÖM, J. NORDSTRÖM Copyright © 2013 SciRes. ME 8 http://dx.doi.org/10.1111/j.1753-4887.1998.tb01677.x [19] Y. H. Chu, E. A. Frongillo, S. J. Jones and G. L. Kaye, “Improving Patron’s Meal Selection through the Use of Point-of-Selection Nutrition Labels,” American Journal of Public Health, Vol. 99, No. 11, 2009, pp. 2001-2005. http://dx.doi.org/10.2105/AJPH.2008.153205 [20] L. J. Harnack and S. A. French, “Effect of Point-of Pur- chase Calorie Labeling on Restaurant and Cafeteria Food Choices: A Review of the Literature,” International Jour- nal of Behavioral Nutrition and Physical Activity, Vol. 5, 2008, p. 51. [21] C. A. Perlmutter, D. D. Canter and M. B. Gregoire, “Pro- fitability and Acceptability of Fat- and Sodium-Modified Hot Entrées in a Worksite Cafeteria,” Journal of the Ame- rican Dietetic Association, Vol. 97, No. 4, 1997, pp. 391- 395. http://dx.doi.org/10.1016/S0002-8223(97)00097-7 [22] E. Pulos and K. Leng, “Evaluation of a Voluntary Menu- Labeling Program in Full-Service Restaurants,” American Journal of Public Health, Vol. 100, No. 6, 2010, pp. 1035- 1039. http://dx.doi.org/10.2105/AJPH.2009.174839 [23] C. A. Roberto, P. D. Larsen, H. Agnew, J. Baik and K. D. Brownell, “Evaluating the Impact of Menu Labelling on Food Choices and Intake,” American Journal of Public Health, Vol. 100, No. 2, 2010, pp. 312-318. http://dx.doi.org/10.2105/AJPH.2009.160226 [24] J. Nordström and L. Thunström, “Economic Policies for Healthier Food Intake: The Impact on Different House- hold Categories,” European Journal of Health Economics, Vol. 12, No. 2, 2011, pp. 127-140. http://dx.doi.org/10.1007/s10198-010-0234-6 [25] J. K. Binkley, “The Effect of Demographic, Economic and Nutrition Factors on the Frequency of Food Away from Home,” Journal of Consumer Affairs, Vol. 40, No. 2, 2006, pp. 372-391. http://dx.doi.org/10.1111/j.1745-6606.2006.00062.x [26] S.-Y. Chou, M. Grossman and H. Saffer, “An Economic Analysis of Adult Obesity: Results from the Behavioural Risk Factor Surveillance System,” Journal of Health Eco- nomics, Vol. 23, No. 3, 2004, pp. 565-587. http://dx.doi.org/10.1016/j.jhealeco.2003.10.003 [27] I. Rashad, “Structural Estimation of Caloric Intake, Exer- cise, Smoking, and Obesity,” Quarterly Review of Eco- nomics and Finance, Vol. 46, No. 2, 2006, pp. 268-283. http://dx.doi.org/10.1016/j.qref.2005.11.002 [28] G. Kyureghian, R. M. Nayga, G. C. Davis and B.-H. Lin, “Food away from Home Consumption and Obesity: An Analysis by Service Type and by Meal Occasion,” 2007 Annual Meeting, 29 July-1 August 2007, Portland.
|