 American Journal of Molecular Biology, 2013, 3, 241-247 AJMB http://dx.doi.org/10.4236/ajmb.2013.34031 Published Online October 2013 (http://www.scirp.org/journal/ajmb/) Identification of a SSR marker (TOM-144) linked to Fusarium wilt resistance in Solanum lycopersicum Pritesh Parmar1, Ankit Sudhir1, R. Preethi1, Bhaumik Dave1, Ketankumar Panchal1, Ramalingam Bhagwathi Subramanian1*, Arvind Patel2, K. B. Kathiria2 1B. R. D. School of Biosciences, Sardar Patel University, Vallabh Vidyanagar, India 2Vegetable Research Station, Anand Agricultural University, Anand, India Email: *asp.fus@gmail.com Received 2 September 2013; revised 30 September 2013; accepted 10 October 2013 Copyright © 2013 Pritesh Parmar et al. This is an open access article distributed under the Creative Commons Attribution License, which permits unrestricted use, distribution, and reproduction in any medium, provided the original work is properly cited. ABSTRACT With the discovery of molecular markers and marker assisted selection technology, the research has entered into a new era and has made it possible to develop new and more informative PCR-based markers, in- cluding SSR, and to further facilitate the use of mark- ers in tomato breeding. The present study is a step to introduce a new SSR marker (TOM-144) which was deduced after evaluation of eight microsatellite loci amongst the twenty-one different tomato cultivars. The marker selected was inherited and segregated in men- delian fashion as demonstrated in successive genera- tion of a cross between parent cvs. H-24 x GT-2. Keywords: Fusarium Wilt; Molecular Marker; Tomato 1. INTRODUCTION Tomato is the world’s second largest vegetable crop which is consumed all over the world; its production could not compete with the demand as it is threatened by lethal diseases. Among these, Fusarium wilt is a vascular disease, cause the wilt which starts from tender leaves, then spreading the infection up to the tip of root, leading to complete destruction of the plant. Fusarium wilt is one of the devastating causes for the drastic decrease in to- mato yield in India with the occurrence of race 1 patho- type. Breeding started way back in 1930 for improve- ment of overall horticulture characteristic. As market demand developed for more specific traits, breeding technology was more specialized, relying solely on PS (phenotypic selection). It is time consuming and depends on environmental conditions. Breeding, a new variety, takes between eight and twelve years and even then the release of an improved variety cannot be guaranteed. Field trial methods are also conducted, where the tomato plants growing in the field are deliberately infected with the fungus and then breeders select the plants based on their visible or measurable traits, called phenotypes. But the phenotypic properties may vary due to changes in the environment and also conditions of cultivation of varie- ties. Above all, these practices and experiments are very much time consuming and labour intensive [1]. Till date, there is no rapid and reliable method avail- able except molecular makers which can identify the cultivars. Of course methods like in vitro and in vivo are being practiced since decades but that itself requires con- firmation with an efficient method. Hence, breeders are extremely interested in new technology that could make this procedure more efficient. Molecular marker tech- nology offers such a possibility by adopting a wide range of novel approaches to improve the selection strategies in tomato breeding. DNA marker technology has been used in commercial plant breeding programmes since the early 1990s, and has proved helpful for the rapid and efficient transfer of useful agronomically important traits into desirable varieties and hybrids. Marker technology can potentially overcome at least some of the limitations as- sociated with PS, major that they are “neutral” in phe- notypic reactions, that is, they do not have any plei- otropic effect on the phenotype, nor are they influenced in their segregation and inheritance by the growing con- ditions of the plant. In advance, molecular markers can be detected at any growth stages, strengthening the pos- sibility of selecting plants on the basis of convenience to the breeder, in contrast to the season-bound nature of PS [2]. Currently, most of the markers used for tomato genetic mapping and breeding purposes are PCR-based, includ- ing RAPD, SSR or microsatellite, AFLP, SCAR, CAPS, SNP and InDel markers. Co-dominant markers are mark- ers for which both alleles are expressed when co-occur- *Corresponding author. OPEN ACCESS  P. Parmar et al. / American Journal of Molecular Biology 3 (2013) 241-247 242 ring in an individual. Therefore, with co-dominant mark- ers, heterozygotes can be distinguished from homozy- gotes, allowing the determination of genotypes and allele frequencies at loci. In contrast, band profiles of dominant markers are scored as the presence or absence of frag- ments of a particular size, and heterozygosity cannot be determined directly. Co-dominant markers are preferred for most applications. The majority of co-dominant mar- kers are single locus markers, and hence the degree of in- formation per assay is usually lower compared to the multilocus techniques. Because only small quantities of template DNA (5 - 100 ng per reaction) are required, techniques which are based on the PCR are currently preferred. SSR markers, or microsatellite markers, are one of the co-dominant markers used in genetic research today. SSR markers are stretches of DNA, in which the same short nucleotide sequence is repeated over and over. Eukaryotic genomes contain a large number of SSRs. This abundance allows their use for the construction of high-density genetic maps and enables the molecular tagging of genes polymorphism, or variation. Among SSR markers, it is determined by the number of times and the base sequence repeats (e.g. AGTTAGTT vs. AGTTAGTTAGTTAGTT). “This variation in DNA se- quence can be used just like other types of DNA se- quence variation to locate nearby gene”. SSR markers are considered highly polymorphously as the number of re- peats can vary greatly among plants. The nature of SSRs gives them a number of advantages over other mo- lecular markers: 1) multiple SSR alleles may be detected at a single locus using a simple PCR-based screen; 2) SSRs are evenly distributed all over the genome; 3) they are co-dominant; 4) very small quantities of DNA are re- quired for screening; and 5) analysis may be semi-auto- mated. The present study focuses on the introduction of new SSR marker which is being inherited and segregated in mendelian fashion for the application of MAS against Fusarium wilt resistance in tomato. 2. MATERIALS AND METHODS 2.1. Plant Material A total of twenty one tomato cultivars were used in this study. Among them, seventeen cultivars, LSVT-4, LSVT- 6, LSVT-7, LSVT-1, Gujarat Tomato-2, LSVT-2, LSVT- 3, LSVT-5, JT-3, AT-3, H-24, Junagadh ruby, KS-17, Pusa ruby, NDT-96, Wild, Gujarat Tomato-1 were col- lected and maintained at vegetable section of Anand Ag- riculture University, Anand; and four cultivars, Heam- sona, Namdhari, Hemsikhar, Saktiman from the local fields of Bakrol and Anand, Gujarat state, India. 2.2. Disease Evaluation Tomato cultivars used in the study was categorised into susceptible, partial resistant and resistant as per the method of [3]. 2.3. DNA Extraction Tomato genomic DNA were extracted as the method of Oza et al. [4] and fungal genomic DNA was as the pro- tocol of Sambrook et al. [5]. 2.4. Race Identification Race of the fungal culture used in the study was identi- fied as per the direction of Parmar et al. [6]. 2.5. SSR Genotyping Tomato specific microsatellite containing sequences from chromosome 7 and 11 were obtained from SGN and other literatures [7,8]. A total of eight primer pairs (Table 1) were used to evaluate genetic polymorphism among the twenty one selected cultivars and to identify a marker linked to Fusarium wilt resistance. Table 1. Microsatellite markers, sequence information, repeat motifs and allele size used for the genetic diversity analysis in tomato (Solanum lycopersicum). Locus Size Motif Annealing temperaturePrimer pairs 5’-3’ SSR-45 246 (AAT)n 50 TGTATCCTGGTGGACCAATG TCCAAGTATCAGGCACACCA SSR-52 202 (AAC)n 50 TGATGGCAGCATCGTAGAAG GGTGCGAAGGGATTTACAGA SSR-67 900 (AGA)2 (AAG)7 58 GCACGAGACCAAGCAGATTA GGGCCTTTCCTCCAGTAGAC SSR-108 217 (TC)n 50 TGTGTTGGATGTTTGGCACT GCCATTGAAACTTGCAGAGA SSR-136 148 (CAG)n 50 GAAACCGCCTCTTTCACTTG CAGCAATGATTCCAGCGATA SSR-637 200 (GATA)24, (AT)9, (GT)25 50 AATGTAACAACGTGTCATGATTC AAGTCACAAACTAAGTTAGGG Tom-144 144 (TAT)15 (TGT)4 45 CTGTTTACTTCAAGAAGGCTG ACTTTAACTTTATTATTGCGACG Tom-196 196 (AAT)6 45 CCTCCAAATCCCAAAACTCT TGTTTCATCCACTATCACGA Copyright © 2013 SciRes. OPEN ACCESS  P. Parmar et al. / American Journal of Molecular Biology 3 (2013) 241-247 243 Amplification was carried out in 12.5 μl of reaction mixture, containing 3.9 distilled water, 1.3 μl of 10 x assay buffer with 15 mM MgCl2, 2 μl of 100ng template DNA, 2 μl of primer (both forward and reverse), 1 μl dNTP mix and 0.3 μl Taq DNA polymerase (3 U/µl). PCR was performed in a thermal cycler (Eppendorff) with profile: initial denaturation at 95˚C for 1 min, fol- lowed by 35 cycles of denaturation at 95˚C for 30 sec., annealing as per the primers for 45 sec., extension at 72˚C for 45 sec. and finally extension at 72˚C for 5 min. The amplified products were size separated by electro- phoresis in 2% (w/v) Agarose (Sigma type IV) gel with 1 X TAE buffer, stained with ethidium bromide and ob- served with a UV transilluminator. In all cases, step up 100 bp (Merck make) was used as molecular size marker. 2.6. Mapping Population An F1 mapping population was developed from the cross between parents Gujarat tomato cultivar GT-2 and H-24 that is widely grown in local fields of Gujarat, India. The cultivated parent GT-2 represents a pure line selection from a landrace and was used as a female in the cross and H-24 as a donor. The F1 populations of 10 plants were used for mapping. 2.7. Bulk Segregation Analysis To identify inheritance and segregation pattern of se- lected SSR markers, bulks were made from the basic mapping population of hybridization between cvs. H-24 x GT-2 on the basis of phenotypic evaluation through in vitro bioassay. The F1 population consisted of 10 indi- viduals were scrutinized for segregation.DNA was ex- tracted as described earlier. Aliquots (2.5 µg of DNA) of each individual homozygous for one or the other allele of the targeted gene were bulked together. The bulks were screened with TOM 144 primer for the segregation pat- tern. 2.8. Data Analysis The data obtained from the individuals of first generation (F1) after the crossing for Fusarium wilt reaction of de- tached-leaflet assays were tested for its significance from the expected Mendelian ratio of 1:1 using chi-square (x2) test using software SPSS version 8.0. 3. RESULTS 3.1. Race Identification of Fusarium oxysporum f. sp. lycopersici According to Parmar et al. [6] both the isolates were be- long to Race 1 type of Fusarium oxysporum f. sp. ly- copersici. 3.2. Disease Evaluation As per the direction of Parmar et al. [3], the in vitro reac- tion of tomato cultivars were identified. The cultivars that showed symptoms after 24 hrs of treatment were LSVT-4, LSVT-6, LSVT-7, Namdhari. After 48 hrs, cultivars LSVT-1, GT-2, Heamsikhar, showed chlorosis at pe- riphery while the cultivars LSVT-2, LSVT-3, LSVT-5, JT-3, Heamsona, Saktiman, AT-3, H-24, SL-120, KS-118, Maha-2, Feb-4 remained asymptomatic. Phenotypic evaluation of twenty one tomato cultivars by bioassay led to the identification of three specific groups of genotypes based on identical characteristics. The three groups are, 1) susceptible with LSVT-4, LSVT-6, LSVT-7, and Namd- hari; 2) Tolerant with LSVT-1, GT-2, and Heamsikhar; 3) Resistant with twelve varieties LSVT-2, LSVT-3, LSVT- 5, JT-3, Heamsona, Saktiman, AT-3, H-24, SL-120, KS- 118, Maha-2, Feb-4. 3.3. SSR Genotyping In the present study, a total of eight primers were analysed, which were dispersed on chromosome 7 and 11 of tomato. Of the eight primers used, two loci were observed to be polymorphic. The polymorphic markers include SSR 67 and Tom 144. These two markers clearly showed the discrimination between the susceptible and resistant cul- tivars which were grouped phenotypically by conven- tional in vitro and in vivo bioassay. The TOM 144 revealed different sized allele in sus- ceptible and resistant cultivars. The profile showed both 199 + 299 bp band for all the twelve resistant cultivars that are LSVT-2, LSVT-3, LSVT-5, JT-3 (Figures 1-3), Figure 1. Polymorphic profile obtained with Tom144 primer. Resistant cultivars JT-3, Lsvt-2, Lsvt-3, Lsvt-5 show bands for allele of 299bp and 199bp, sensitive cultivar Lsvt-4 shows band for allele of 199bp, and no amplicon with toler- ant variety Lsvt-1. Copyright © 2013 SciRes. OPEN ACCESS  P. Parmar et al. / American Journal of Molecular Biology 3 (2013) 241-247 244 199 bp Figure 2. Polymorphic profile obtained with Tom144 primer. Both sensitive cultivars Lsvt-6, Lsvt-7 show band for allele of 199 bp. Figure 3. Polymorphic profile obtained with Tom144 primer. Resistant cultivars heamsona, saktiman, AT-3 show bands for allele of 299 bp and 199 bp, sensitive cultivar namdhari shows band for allele of 199 bp, and no amplicon with tolerant varie- ties heamsikhar, GT-2. Heamsona, Saktiman, AT-3, H-24, SL-120, KS-118, Maha-2, Feb- 4, only 199 bp band for the four sensitive cultivars (Figures 2-4), LSVT-4, LSVT-6, LSVT-7, and Namdhari and no band was seen for the tolerant varieties, LSVT-1, GT-2, and Heamsikhar (Figures 1-3). With ssr 67 a single allele of 900 was reported only in susceptible cultivars where as resistant cultivars showed 900 + 900 bands. In order to discriminate the two alleles of same size image J software (NIH, USA) was used to justify the intensity variation between the two. Analysis revealed a clear cut difference between the two alleles with twice the intensity in resistant cultivars compared to susceptible cultivars. (Figure 4) [9]. Figure 5 shows the profile of eight cultivars with ap- plication of SSR-45. In this an allele of size 246 bp was observed in all eight cultivars generating a monomorphic profile. Six of the eight SSR primer sets were found to be monomorphic amongst the cultivars used some of the primer reported occurrence of null alleles. (Figures 6-10). Occurrence of null allele was taken in to consideration rather than discarding it to produce important finding that it can be used to produce a group with implication that there some relatedness and relationship among the culti- vars. Amongst the two polymorphic primer sets, Tom 144 primer set was selected for the further studies as it is not being reported as a molecular marker. 3.4. Inheritance of Marker Once polymorphic marker was identified, a group of 10 Figure 4. A highly polymorphic profile obtained with use of SSR 67 marker. Resistant cultivars like wild, NDT-96 and Heamsona show alleles of 900 + 900 bp in comparison to KS-17, GT-1, and GT-2 with 900 bp allele and null al- lele with JR and PR. Figure 5. Monomorphic profile obtained with SSR-45 marker. Allele of size 246 was com- monly observed in all the cultivars. Figure 6. Monomorphic profile obtained from eight tomato cultivars after amplication with Tom 196. Three cultivars showed occurrence of null allele with no amplicons. Copyright © 2013 SciRes. OPEN ACCESS  P. Parmar et al. / American Journal of Molecular Biology 3 (2013) 241-247 245 Figure 7. Monomorphic profile obtained from eight tomato cultivars after amplification with primer SSR- 108. Three cultivars showed occurrence of null allele with no amplicon. Figure 8. Monomorphic profile obtained from eight tomato cultivars after amplification with primer SSR- 136. Three cultivars showed occurrence of null allele with no amplicon. Figure 9. Monomorphic profile obtained from eight tomato cultivars after amplification with primer SSR- 52. Three cultivars showed occurrence of null allele with no amplicon. Figure 10. Monomorphic profile obtained from eight tomato cultivars after amplification with primer SSR-637. Three cultivars showed occurrence of null allele with no amplicon. F1 plants from each population was assayed to identify the loci that deviated significantly 1:1 (homozygous for the SSR allele contributed by the female parent: het- erozygous: homozygous for the SSR allele contributed by the male parent). Bulk segregation analysis was per- formed with two bulks, a resistant and tolerant bulks produced at F1 level. Figure 11 shows the amplification pattern of two bulks along with parents obtained through the application of TOM 144 as a marker. The results show a clear-cut segregation pattern of 1:1 at F1 level (Figure 12). 4. DISCUSSION Classically, plant pathogens have been identified on the basis of morphological features and growth characteris- tics on specific media. However, because of their specific limitations, these techniques are increasingly being com- Figure 11. Bulk segregation analysis of resistant and tolerant bulks with parents GT-2(P1) and H-24(P2) using marker TOM 144. R = Resistant, T = Tolerant, M = Marker. Figure 12. Chi square test analysis to validate the segrega- tion pattern. Copyright © 2013 SciRes. OPEN ACCESS  P. Parmar et al. / American Journal of Molecular Biology 3 (2013) 241-247 246 plemented or replaced by molecular technologies, of which those based on detection of pathogen DNA or RNA are the most predominant [10]. In general, the mo- lecular techniques are faster, more specific, more sensi- tive and more accurate than the traditional methods, and can be performed and interpreted by personnel with no taxonomical specialized expertise. In addition and per- haps, even more importantly, these techniques allow de- tection of microorganisms that cannot be cultivated in vitro [10]. In the present study, SSRs were selected as they are relatively abundant with uniform genome coverage, co-dominant, robust and reproducible, and the method is PCR based. In addition, a number of workers have dem- onstrated that these markers often cosegregated along with the disease resistance gene. In the present study, the TOM 144 is found to be polymorphic molecular marker and is associated with resistance against race 1 of Fol. The present investigation also revealed the occurrence of “Null alleles” in various cultivars possibility as a re- sult of non-amplification because of mutation/s at a primer binding site or insertion or deletion of the genetic segment. Dropping data from problem loci may then prove to be an impractical option, as any omission of loci would substantially reduce inferential and discriminatory power of the study [11]. Consequently, many studies have simply included loci with null alleles in their analyses [12] without explicitly considering the conse- quences. A better option for correcting for errors caused by null alleles would be to accommodate them in data analysis [13]. In this study, the null alleles have been taken into consideration to show the relationship and relatedness among the accessions of tolerant class. Several approaches have been suggested to saturate ge- nomic regions of interest with molecular markers. Theses include preselection using NILs, preparative pulse field gel electrophoresis and chromosome walking and jump- ing. Bulk segregation analysis provides a rapid, techni- cally simple alternative for identifying a marker linked to the specific gene. Bulk segregation analysis overcomes several problems inherent in using NILs or cytogenetic stocks to identify markers linked to particular genes. There is a minimal chance that regions unlinked to the target region will differ between the bulked samples of many individuals [14]. In this study, bulked segregation analysis was successfully employed to identify the seg- regation pattern of a molecular marker linked to a gene for resistance in tomato against Fol. Bulked segregation analysis overcomes several prob- lems inherent in using NILs or cytogenetic stocks to identify markers linked to particular genes. There is a minimal chance that regions unlinked to the target region will differ between the bulked samples of many indi- viduals. In contrast, even after five backcrosses, only half of the polymorphic loci between NILs are expected to map to the selected region [14]. A locus to be used as an efficient marker for the iden- tification of a specific trait should be co-segregating in the subsequent generation. Few reports have examined the segregation ratios of microsatellite alleles in plants. Eileen et al. [15] found two of hundred SSR loci linked to tomato colour were co-segregated with expected pat- tern 1:2:1 at F2 generation. Similar pattern was also achieved at F2 generation by Cregan et al. [16], while looking at linkage analysis of markers in soyabean. In the present study, an identical co-segregation ratio was achieved at F1 generation (1:1) which implies that it is a reliable marker which can be employed efficiently in identification and classification of resistant cultivars. Parmar et al. [9] reported the primer set SSR-67, a molecular marker linked to the disease resistance which could be employed for the discrimination of susceptible and resistant entity amongst the tomato population. The marker was also used in the present investigation and it worked efficiently but it was noticed that it requires the expertise with good eyesight or extra software for the discrimination of 900 + 900 allele. In addition to this, it also needs special care of application of equal quantity of DNA from all the samples to be used in amplification reaction, without it that the output will be misinterpreted by software or professional. In order to simplify it in present study, TOM-144 primer set was recommended to be used as a marker for the discrimination of susceptible and resistant entity amongst the tomato population as it has different allele size that is 199 + 299 base pair that can be amplified in resistant only in comparison to sensi- tive one with only 199 base pair allele. In conclusion, the molecular marker TOM 144 linked to Fusarium wilt resistance against race 1 can be exe- cuted for the discrimination of resistant, susceptible and partial resistant amongst the tomato population. 5. ACKNOWLEDGEMENTS This work was supported under University Grants commission (UGC) scheme for Identification of molecular markers linked to resistant in tomato, Government of India. We would like to thank Indian type culture collection for providing us the fungal culture F-1322. REFERENCES [1] Tanksley, S.D. and McCouch, S.R. (1997) Seed banks and molecular maps: Unlocking genetic potential from the wild, Science, 277, 1063-1066. http://dx.doi.org/10.1126/science.277.5329.1063 [2] Foolad, M.R. and Panthee, D.R. (2012) Marker-assisted selection in tomato breeding. Critical Reviews in Plant Sciences, 31, 93-123. http://dx.doi.org/10.1080/07352689.2011.616057 Copyright © 2013 SciRes. OPEN ACCESS  P. Parmar et al. / American Journal of Molecular Biology 3 (2013) 241-247 Copyright © 2013 SciRes. 247 OPEN ACCESS [3] Parmar, P.P., Oza, V.P., Patel, A.D., Kathiria, K.B. and Subramanian, R.B. (2011) Development of a rapid and reliable bioassay to discriminate between susceptible and resistant cultivars of tomato against Fusarium wilt. Inter- national Journal of Biosciences Agriculture and Tech- nology, 3, 6-11. [4] Oza, V., Trivedi, S., Parmar, P. and Subramanian, R.B. (2008) A simple, rapid and efficient method for isolation of genomic DNA from plant tissue. Journal of Cell and Tissue Research, 8, 1383-1386. [5] Sambrook, J., Fritsch, E.F. and Maniatis, T. (1989) Mo- lecular cloning: A laboratory manual, 2nd Edition, Cold Spring Harbor Lab. Press, New York. [6] Parmar, P., Gandhi, M. and Subramanian, R.B. (2012) Isolation and molecular characterization of avirulence gene from Indian isolates of Fusarium oxysporum f. sp. Lycopersici. Journal of Cell and Tissue Research, 12, 3061-3067. http://dx.doi.org/10.1139/g98-155 [7] Areshchenkova, T. and Ganal, M.W. (1999) Long tomato microsatellites are predominantly associated with cen- tromeric regions. Genome, 42, 536-544. [8] Suliman-Pollatschek, S., Kashkush, K., Shats, H. and Lavi, U. (2002) Generation and mapping of AFLP, SSRs and SNPs in Lycopersicon esculentum. Cellular Molecu- lar Biology Letters, 7, 583-597. [9] Parmar, P., Bhatt, K., Oza, V., Kathiria, K. B. and Subra- manan, R.B. (2009) Microsatellite marker associated with Fusarium wilt resistance in tomato. World Journal of Ag- ricultural Sciences, 5, 389-393. [10] Lievens, B., Rep, M. and Thomma, B.P. (2008) Recent developments in the molecular discrimination of formae speciales of Fusarium oxysporum. Pest Management Science, 64, 781-788. http://dx.doi.org/10.1002/ps.1564 [11] Marshall, T.C., Slate, J., Kruuk, L.E.B. and Pemberton, J.M. (1998) Statistical confidence for likelihood based paternity inference in natural populations. Molecular Ecology, 7, 639-655. http://dx.doi.org/10.1046/j.1365-294x.1998.00374.x [12] Dakin, E.E. and Avise, J.C. (2004) Microsatellite null alleles in parentage analysis. Heredity, 93, 504-509. http://dx.doi.org/10.1038/sj.hdy.6800545 [13] Sobel, E., Papp, J.C. and Lange, K. (2002) Detection and integration of genotyping errors in statistical genetics. American Journal of Human Genetics, 70, 496-508. http://dx.doi.org/10.1086/338920 [14] Michelmore, R.W., Paran, I. and Kesseli, R.V. (1991) Identification of markers linked to disease resistance genes by bulked segregation analysis: A rapid method to detect markers in specific genomic regions by using seg- regating populations. Proceedings of the national acad- emy of sciences, 88, 9828-9832. http://dx.doi.org/10.1073/pnas.88.21.9828 [15] Eileen, K., Wencai, Y. and Francis, D.M. (2004). Im- proved tomato fruit color within an inbred backcross line derived from lycopersicion esculentum and L. hirsutum involves the interaction of loci. Journal of the American Society for Horticultural Science, 129, 250-257. [16] Cregan, P., Van Berkum, P., Sloger, C. and Orellana, R.G. (1989) Heterosis of interspecific soybean hybrids for traits related to N2 fixation. Euphytica, 40, 89-96.
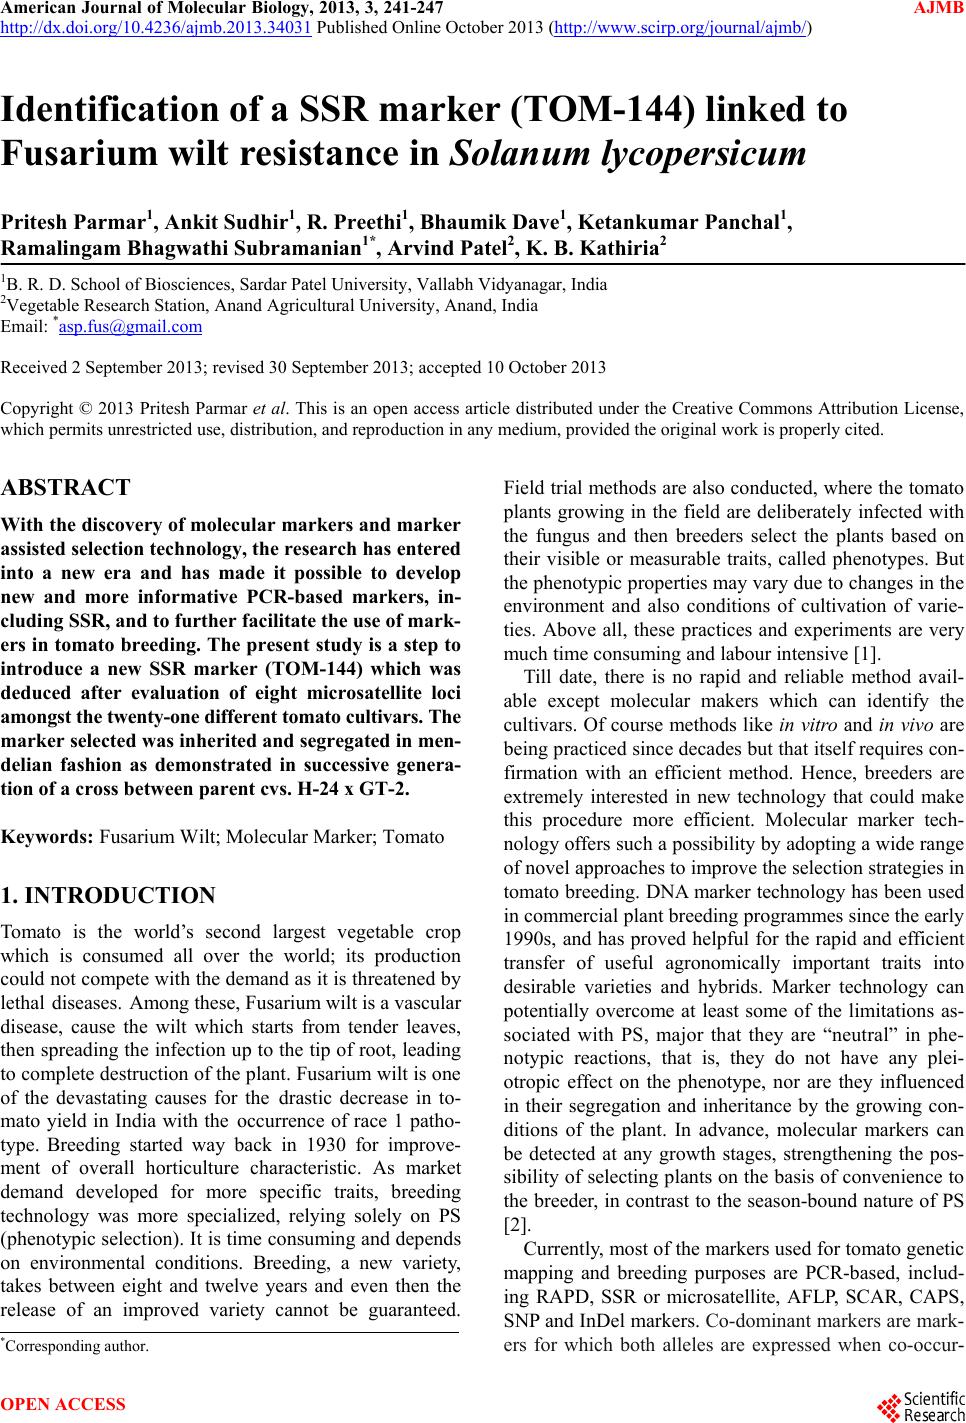
|