 American Journal of Molecular Biology, 2013, 3, 215-228 AJMB http://dx.doi.org/10.4236/ajmb.2013.34028 Published Online October 2013 (http://www.scirp.org/journal/ajmb/) DNA extraction method selection for agricultural soil using TOPSIS multiple criteria decision-making model Sepideh Pakpour1, Snizhana V. Olishevska2,3, Shiv O. Prasher2, Abbas S. Milani4, Martin R. Chénier3,5* 1Department of Biology, University of British Columbia, Kelowna, Canada 2Department of Bioresource Engineering, McGill University, Montreal, Canada 3Department of Animal Science, McGill University, Montreal, Canada 4School of Engineering, University of British Columbia, Kelowna, Canada 5Department of Food Science and Agricultural Chemistry, McGill University, Montreal, Canada Email: *martin.chenier@mcgill.ca Received 20 June 2013; revised 22 July 2013; accepted 15 August 2013 Copyright © 2013 Sepideh Pakpour et al. This is an open access article distributed under the Creative Commons Attribution License, which permits unrestricted use, distribution, and reproduction in any medium, provided the original work is properly cited. ABSTRACT There is an increased interest in the extraction of nu- cleic acids from various environmental samples since culture-independent molecular techniques contribute to deepen and broaden the understanding of a greater portion of uncultivable microorganisms. Due to diffi- culties to select the optimum DNA extraction method in view of downstream molecular analyses, this article presents a straightforward mathematical framework for comparing some of the most commonly used methods. Four commercial DNA extraction kits and two physical-chemical methods (bead-beating and freeze-thaw) were compared for the extraction of DNA under several quantitative DNA analysis crite- ria: yield of extraction, purity o f extracted DNA (A260/280 and A260/230 ratios), degradation degree of DNA, easi- ness of PCR amplification, duration of extraction, and cost per extraction. From a practical point of view, it is unlikely that a single DNA extraction strategy can be optimum for all selected criteria. Hence, a sys- tematic Technique for Order Preference by Simi- larity to Ideal Solution (TOPSIS) was employed to compare the methods. The PowerSoil® DNA Isolation Kit was systematically defined as the best performing method for extracting DNA from soil samples. More specifically, for soil:manure and soil:manure:biochar mixtures, the PowerSoil® DNA Isolation Kit method performed best, while for neat soil samples its alter- native version gained the first rank. Keywords: DNA Extraction; Agricultural Soil; Biochar; Poultry Manure; Multiple Criteria Decision-Making; Technique for Order Preference by Similarity to Ideal Solution 1. INTRODUCTION Soil is a unique ecosystem containing many different niches and creating favourable conditions for the devel- opment of different groups of microorganisms [1,2]. Since less than 1% of soil microorganisms can be grown in laboratory conditions using culture media [3,4] and the vast majority are not cultivable [5,6], a significant num- ber of studies dealing with microbial diversity utilize molecular tools such as competitive PCR, real-time PCR, denaturing gradient gel electrophoresis (DGGE) and lar- ge-scale parallel-pyrosequencing based on the extraction of environmental nucleic acids [7-11]. Numerous procedures exist for the isolation and puri- fication of DNA from soil [1,9,10,12-14]. Studies sug- gest that the selection of an appropriate extraction and purification procedure depends on the physical and chemical characteristics of the soil matrix, such as or- ganic matter, clay content and pH value, as well as on different amendments like biochar and poultry manure used in agriculture for improvement of soil fertility [15- 19]. For example, environmental samples such as soil and sediments often contain high levels of organic matter, especially humic acids and phenolic compounds, as well as heavy metals which can inhibit the activity of the Taq DNA polymerase in PCR [20-22] and reduce the speci- ficity of DNA hybridization analysis [10,23,24]. Indirect and direct approaches have been developed for extracting nucleic acids from soil samples. Indirect extraction of DNA from soil samples is based on the fol- lowing steps: dispersion of soil particles, separation of *Corresponding author. OPEN ACCESS  S. Pakpour et al. / American Journal of Molecular Biology 3 (2013) 215-228 216 the cells from soil particles by centrifugation according to sedimentation velocities, buoyant density or both, lysis of extracted cells and finally DNA purification [1,25,26]. The most commonly used methods for direct extraction of DNA are based on physical-chemical membrane dis- ruption techniques (bead-beating and freeze-thaw) that may allow greater yields of microbial DNA recovery [9,12,14,15,20,27,28]. In spite of many advantages of direct methods, they generally show lower DNA purity with a high degree of DNA shearing that can negatively affect PCR efficiency or specificity [1,20,27]. Due to the fact that some of the steps of DNA extraction using these direct methods might make DNA isolation expensive or impractical for processing the large number of samples usually required in ecological studies, commercial kits have been increasingly utilized for DNA extraction and purification from soil and sediments [9,10,14,29-34]. The main goal of this study was to choose a method that would be inexpensive, able to process several sam- ples quickly, and capable of obtaining high quality DNA for PCR studies. Four commercial DNA extraction kits and two physical-chemical methods (bead-beating and freeze-thaw) were compared for the extraction of DNA from a ferro-humic podzol soil amended or not with poultry manure and biochar. No earlier work suggested a mathematical decision aid tool to choose the optimum method for DNA extraction from soil under several con- flicting criteria. The present work introduces a system- atic/mathematical approach for comparing the perform- ance of different DNA extraction methods under a set of simultaneous “multiple criteria”: yield of extraction, pu- rity of extracted DNA (A260/280 and A260/230 ratios), deg- radation degree of DNA, easiness of PCR amplification, duration of extraction, and cost per extraction. The pro- posed approach is formally called “multiple criteria deci- sion-making” or MCDM [35]. In problems dealing with MCDM, which is a branch of Operations Research (or OR) models, the main goal is to consider a set of decision criteria and choose the best performing option from a list of available alternatives (i.e., options to choose from), which generally show no obvious dominance one over another with respect to the criteria (this is formally referred to as Pareto optimality or Pareto efficiency condition). More precisely, it is as- sumed that all given alternatives (e.g., here different DNA extraction techniques) are feasible and there is al- ways a trade-off in choosing one over another. In other words, option A may be better than B under some criteria, but worse under some other criteria. In such complex decision-making scenarios, MCDM can aid the analyst (the decision maker) to make a final decision considering his/her experience, expectations, constraints, etc., into a systematic mathematical model [35,36]. It is worth add- ing that next to selection problems, there are also MCDM models that are applicable to the sorting and classification problems [37]. The application of MCDM in decision-making processes in molecular biological systems, and more especially in comparing DNA extrac- tion kits, is rather new. Most recently, a basic MCDM model, called “Weighted Sum Method” (WSM) was used for comparing a set of sample preservation and DNA extraction methods from swine feces [38]. Some other example applications of MCDM in a diverse range of practical problems include the use of decision analysis in integrated manufacturing [39], in the evaluation of tech- nology investment decisions [40], in sustainable energy planning [41], and in prioritizing urban cultural heritage values [42]. Despite the fact that WSM is known to be the earliest, the simplest and probably the most widely used MCDM method, it has some shortcomings in particular deci- sion-making cases. Namely, it allows a direct trade-off (compensation) among the criteria values in evaluating the performance of each alternative. As a result, it may choose an alternative that is excellent under some criteria but at the same time poor or close to unacceptablely un- der some other criteria, which in turn can induce a risk in practice, especially under uncertain data or ambiguous conditions. For instance, a biologist may choose a DNA extraction kit using WSM that gives a very high yield but at the same time the purity of extracted DNA may be at a marginal level, which in turn can pose a primary risk/ concern for that particular decision maker in terms of the quality of DNA. In turn, more advanced MCDM meth- ods have been developed over years, among which is the TOPSIS (the Technique for Order Preference by Similar- ity to Ideal Solution) method developed by Hwang and Yoon [43]. It carries several advantages such as “simplic- ity, rationality, comprehensibility, good computational efficiency and ability to measure the relative perform- ance for each alternative in a simple mathematical form” [44]. Most importantly, compared to other simple MCDM methods such as WSM, TOPSIS respects the fact that the decision maker sometimes likes to make as much profit as possible, but also to avoid as much risk as possible. The latter desire is satisfied with TOPSIS by in- troducing the concept of the ideal and negative-ideal (nadir) solutions. A selected alternative by this method should have the shortest distance from the ideal solution and the farthest distance from the negative-ideal solution in a geometrical sense [43]. The mathematical frame- work and application of this method in the context of the optimum DNA extraction selection method for agricul- tural soils are presented in a later section of the present article, which is the main motivation of the work. It should be added that the method is general enough to be applied to other decision-making processes in biological systems. Copyright © 2013 SciRes. OPEN ACCESS  S. Pakpour et al. / American Journal of Molecular Biology 3 (2013) 215-228 Copyright © 2013 SciRes. 217 OPEN ACCESS 2. MATERIALS AND METHODS 2.1. Sample Collection and Preparation Soil samples were collected in September 2011 at the Emile A. Lods Agronomy Research Centre of the Mac- Donald Campus Farm at McGill University, Quebec, Canada, in the range of 5 - 10 cm depth of A1 horizon (plowed soil). Collected samples were St-Amable sandy (Ferro-Humic Podzol) soil with the physical-chemical characteristics described in Tabl e 1. Soil was air dried at room temperature to 10% - 20% water-holding capacity. After sieving (stainless soil sieve with 2-mm mesh size), soil samples were stored at 4˚C in the dark until analysis. Poultry manure was collected from the Poultry Complex of the Macdonald Campus Farm and subse- quently air dried at room temperature, homogenized and stored at 4˚C until analysis. Biochar used in this study was obtained from wood lumbers and wastes by slow pyrolysis at 450˚C (BlueLeaf Inc., Drummondville, QC, Canada). Mixtures were formulated with soil:manure [SM, 99:1(w/w)] and soil:manure:biochar [SMB, 98:1:1 (w/w)] and stored at 4˚C in the dark until analysis. 2.2. DNA Extraction Total bacterial DNA was extracted from soil, soil:manure [SM, 99:1(w/w)] and soil:manure:biochar [SMB, 98:1:1 (w/w)] mixtures using six different extraction methods (Table 2). The latter included two previously described home-made methods [38], as summarized below (a bead-beating technique and a freeze-thaw technique), as well as four commercial kits, as described by the manu- facturers: PowerSoil® DNA Isolation Kit (MoBio Labo- ratories, Inc., Carlsbad, CA, USA); UltraClean™ Soil Table 1. Physical and chemical characteristics of soil. Soil type Sand (%) Silt (%) pH Bulk density (Mg·m−3) Organic matter (%)Cation exchange capacity (cmol·kg−1) Hydraulic conductivity (cm·d−1) Sandy 92.2 4.3 5.5 1.350 2.97 4.9 1.67 ± 0.45 Table 2. Comparative analysis of DNA extraction techniques used in this study. Commercial kits† Physical-Chemical techniques PowerSoil UltraClean FastSPIN E.Z.N.A. Bead-Beating Freeze-Thaw Parameters conventional alternative conventional alternativeconventionalalternativeconventionalalternative Sample weight (mg) 250 250 500 500 100 100 Beads Unknown Unknown Unknown Glass Glass None Cell lysis solution Buffer contains sodium dodecyl sulphate (SDS)SDS Buffer, MT BufferBuffer of SLX Mlus SDS and proteinase K FastPrep® Instrument for 40 sec. at speed setting of 6.0 Thermal shock Cell lysis technique Vortex at maximum speed for 10 min. Vortex 3 - 4 sec. then heating at 70˚ for 5 min. Vortex at maximum speed for 10 min. Vortex 3 - 4 sec. then heating at 70˚ for 5 min. No buffer, no incubation Buffer DS and incubation at 70˚ for 10 min. Buffer DS and incubation at 70˚ for 10 min. then at 95˚ for 2 min. No buffer, no incubation Protein removal Patented Inhibitor Removal Technology Solution S2 Protein Precipitation Solution Buffer XP1 PCI‡ Humic acid removal Patented Inhibitor Removal Technology Inhibitor Removal Solution None HTR Reagent None DNA precipitation High concentration salt solution Binding Matrix Isopropanol Polyethyleneglycol and isopropanol DNA purification Spin filter with silica membrane SPIN Filter HiBind DNA column CI§ Elution buffer 10 mM Tris-HCl, pH 8.0 10 mM Tris-HCl, pH 8.0 DNase/Pyrogen-Free WaterUnknown T1E0.1 buffer: 1 mM Tris-HCl, 0.1 mM EDTA, pH 8.0 None Incubation with Binding Matrix for 5 min at 55˚C Final volume (µl) 100 50 50 50 80 †PowerSoil: PowerSoil® DNA Isolation Kit; UltraClean: UltraClean™ Soil DNA Isolation Kit; FastSPIN: FastDNA® SPIN Kit for Soil; E.Z.N.A.: E.Z.N.A.® oil DNA Isolation Kit. PCI‡: phenol:chloroform:isoamyl alcohol, 25:24:1 (v/v); CI§: chloroform:isoamyl alcohol, 24:1 (v/v). S  S. Pakpour et al. / American Journal of Molecular Biology 3 (2013) 215-228 218 DNA Isolation Kit (MoBio Laboratories, Inc., Carlsbad, CA, USA); FastDNA® SPIN Kit for Soil (MP Biomedi- cals, LLC, Solon, OH, USA); E.Z.N.A.® Soil DNA Iso- lation Kit (Omega Bio-Tek, Inc., Carlsbad, CA, USA). Next to the conventional procedure for each of the four DNA extraction commercial kits, to reduce DNA shear- ing and/or increase DNA yields, alternative lysis meth- ods were assessed as described by the manufacturers (Tabl e 2), hence resulting in a total of 10 methods inclu- ding the home-made methods. Bead-Beating and Freeze-Thaw M eth o d s Soil, soil:manure [SM, 99:1(w/w)] and soil:manure:bio- char [SMB, 98:1:1(w/w)] mixtures (0.1 g) were resus- pended in 1 ml of extraction buffer (500 mМ Tris-НСl рН 8.0, 100 mM sodium EDTA рН 8.0, 1.5 М NaCl) and homogenized by vortexing. For disrupting cells by bead- beating, 0.1 g of 0.1 mm-diameter glass beads (BioSpec Products, Bartlesville, OK, USA) were added and cells were disrupted by shaking the tubes for 40 sec (speed = 6.0) in a Fast-Prep (Bio101 Fast-Prep model FP120, Thermo Savant, Qiagen, Inc., Carlsbad, CA, USA), lea- ving on ice for 5 min (to counteract heating of the tubes in the Fast-Prep), and shaking a second time for 40 sec (speed = 6.0). For disrupting cells by freeze-thaw, three cycles of freezing in liquid nitrogen (−196˚C) for 5 min and thawing at 65˚C in a water bath for 10 min were used. Subsequent procedures for DNA purification after both bead-beating and freeze-thaw were the same. After physical disruption of the cells either by bead-beating or freeze-thaw, 20 μl of proteinase K were added and tubes were incubated at 37˚C with shaking at 180 rpm for 30 min to digest contaminating proteins. One hundred mi- croliters of 20% (w/v) SDS (sodium dodecyl sulfate) were added, tubes were mixed by inverting several times, incubated at 65˚C for 1 h and centrifuged at 12,000 × g for 5 min. The supernatants were transferred to new tubes containing 0.5 volume of polyethylene glycol (PEG) solution [30% (w/v) PEG, 1.5 M NaCl] and incu- bated at room temperature for 2 h. Tubes were centri- fuged at 16,100 × g for 20 min. The pellets were dis- solved in 90 µl of T1E0.1 buffer (1 mM Tris-HCl, 0.1 mM EDTA, pH 8.0). Thirty microliters of ammonium acetate 10 M were added, tubes were mixed by inverting several times and left on ice for 5 min to counteract heating. Tubes were centrifuged at 16,100 × g for 30 min at 4˚C to precipitate proteins and polysaccharides. The DNA was purified from the aqueous phase by phenolchloro- form-isoamyl alcohol extraction [25:24:1 (v/v)] followed by chloroform-isoamyl alcohol extraction [24:1 (v/v)]. The DNA was precipitated by adding 0.6 volume of iso- propanol and incubating at −20˚C for 1 h. DNA was col- lected by centrifuging at 16,100 × g for 10 min at 4˚C. The pellets were washed twice with 70% ethanol. After air drying for about 30 min, the pellets were resus- pended in 80 μl of T1E0.1 buffer (1 mM Tris-HCl, 0.1 mM EDTA, pH 8.0). The resulting extracts were treated with 10 μg of RNAse (Invitrogen, Burlington, ON, Can- ada) for 10 min at 37˚C, and stored at −20˚C. 2.3. Polymerase Chain Reaction Amplification PCR amplifications were carried out in a VeritiTM Ther- mal Cycler (Applied Biosystems, Foster City, CA, USA) using 10 ηg of DNA extracted from each sample by each DNA extraction technique as template. The V3 region of the bacteria 16S rDNA was targeted using the Bacteria universal primers 341F (forward primer: CCTACGGGAGGCAGCAG) and 534R (reverse primer: ATTACCGCGGCTGCTGG), which yield amplicons of about 193 bp [45]. The PCR reaction mixture contained 0.75 μM of each primer, 200 μM of each dNTP (Amer- sham Biosciences Corp., Piscataway, NJ, USA), 1.25 U Taq DNA polymerase (Invitrogen, Burlington, ON, Canada), and the PCR buffer supplied with the enzyme (10 mM Tris-HCl pH 9.0, 50 mM KCl, 1.5 mM MgCl2) [46]. For each DNA extract, the following series of PCR tubes were analyzed for the presence of the V3 region of the bacteria 16S rDNA: 1) triplicate PCR tubes with 10 ηg of extracted DNA; 2) a positive control tube with 10 ηg of DNA extracted from a pure culture of Escherichia coli ATCC 25922; 3) an inhibition control tube with 5 ηg of DNA extracted from a pure culture of E. coli ATCC 25922 and 5 ηg of DNA extracted from each sample, in order to assess the presence of PCR inhibitors in the ex- tracts; 4) a negative control tube consisting of the reac- tion mixture without DNA, in order to assess the pres- ence of external or cross-contamination of the PCR reac- tion mixtures by DNA. The PCR conditions were 5 min at 99˚C (initial dena- turation), then 2 cycles of 5 min at 94˚C (denaturation), 5 min at 55˚C (annealing) and 2 min at 72˚C (extension), then 28 cycles of 1 min at 94˚C (denaturation), 1 min at 55˚C (annealing), 2 min at 72˚C (extension), and finally an extension period of 10 min at 72˚C. The size (about 193 bp), specificity (unique band), and abundance of PCR products were determined by comparison with DNA standards (GeneRuler 100 bp DNA Ladder, MBI Fermentas, Burlington, ON, Canada) after agarose gel electrophoresis [46]. 2.4. Identifying a Set of Criteria for Comparing DNA Extraction Methods All DNA extractions were performed in 5 replicates. For each of the following criteria, errors are indicated in Ta- ble 3 as the standard deviation of 3 replicate measure- ents on 5 replicate extractions (n = 15). m Copyright © 2013 SciRes. OPEN ACCESS  S. Pakpour et al. / American Journal of Molecular Biology 3 (2013) 215-228 219 Table 3. Performance of each DNA extraction method under seven decision criteria for soil, SM [soil:manure, 99:1(w/w)] and SMB [soil:manure:biochar, 98:1:1(w/w)]. Performance/Decision Criteria C1 C2 C3 C4 C5 C6 C7 Methods† Sample Yield (µg DNA/g sample) A260/280 ratio A260/230 ratio Degree of DNA degradation§ Easiness of amplification# Duration of extraction (hrs.) Cost per extraction (CAD)†† Soil 8.21 ± 1.32‡ 1.75 ± 0.02 1.30 ± 0.05 2 2 0.83 4.64 SM 14.21 ± 1.24 1.71 ± 0.06 1.43 ± 0.20 2 2 0.83 4.64 UltraClean Conventional SMB 13.03 ± 1.23 1.77 ± 0.04 1.21 ± 0.30 2 2 0.83 4.64 Soil 5.59 ± 0.58 1.63 ± 0.23 1.22 ± 0.06 1 2 0.92 4.64 SM 10.77 ± 1.39 1.50 ± 0.04 0.81 ± 0.04 1 2 0.92 4.64 UltraClean Alternative SMB 9.40 ± 1.36 1.53 ± 0.06 0.88 ± 0.03 1 2 0.92 4.64 Soil 6.76 ± 0.84 1.67 ± 0.08 1.28 ± 0.18 1 2 1.00 5.54 SM 10.52 ± 1.69 1.96 ± 0.05 1.67 ± 0.13 1 2 1.00 5.54 PowerSoil Conventional SMB 8.75 ± 1.43 1.90 ± 0.07 1.57 ± 0.15 1 2 1.00 5.54 Soil 3.78 ± 0.32 1.74 ± 0.34 2.07 ± 0.10 1 2 1.08 5.54 SM 10.48 ± 3.58 1.55 ± 0.06 0.86 ± 0.11 1 2 1.08 5.54 PowerSoil Alternative SMB 11.97 ± 2.17 1.55 ± 0.05 0.96 ± 0.11 1 2 1.08 5.54 Soil 17.70 ± 1.72 1.73 ± 0.02 0.25 ± 0.02 3 1 1.16 6.58 SM 20.00 ± 1.64 1.77 ± 0.03 0.39 ± 0.04 3 1 1.16 6.58 FastSpin Conventional SMB 23.87 ± 2.60 1.84 ± 0.02 0.60 ± 0.07 3 1 1.16 6.58 Soil 23.29 ± 1.54 1.70 ± 0.02 0.34 ± 0.12 3 1 1.25 6.58 SM 20.36 ± 0.88 1.77 ± 0.04 0.50 ± 0.09 3 1 1.25 6.58 FastSpin Alternative SMB 21.45 ± 1.95 1.79 ± 0.01 0.47 ± 0.01 3 1 1.25 6.58 Soil 4.33 ± 0.18 1.67 ± 0.08 0.43 ± 0.42 3 1 3.17 4.38 SM 7.26 ± 0.1.30 1.85 ± 0.06 1.57 ± 0.28 3 1 3.17 4.38 E.Z.N.A. Conventional SMB 7.69 ± 0.1.32 1.87 ± 0.06 1.70 ± 0.16 3 1 3.17 4.38 Soil 25.98 ± 4.86 1.56 ± 0.02 0.30 ± 0.20 3 1 3.25 4.38 SM 25.90 ± 2.92 1.57 ± 0.04 0.55 ± 0.20 3 1 3.25 4.38 E.Z.N.A. Alternative SMB 15.73 ± 3.53 1.65 ± 0.01 0.47 ± 0.33 3 1 3.25 4.38 Soil 5.24 ± 1.03 0.77 ± 0.05 0.12 ± 0.01 ND¶ 3 7.5 1 SM 6.53 ± 0.36 0.87 ± 0.06 0.11 ± 0.01 ND 3 7.5 1 Bead-Beating SMB 4.87 ± 0.44 0.78 ± 0.09 0.09 ± 0.01 ND 3 7.5 1 Soil 5.49 ± 1.10 1.13 ± 0.18 0.19 ± 0.07 ND 3 8.5 1 SM 6.21 ± 0.64 0.85 ± 0.07 0.11 ± 0.01 ND 3 8.5 1 Freeze-Thaw SMB 8.90 ± 2.73 0.86 ± 0.06 0.13 ± 0.02 ND 3 8.5 1 †UltraClean: UltraClean™ Soil DNA Isolation Kit; PowerSoil: PowerSoil® DNA Isolation Kit; FastSPIN: FastDNA® SPIN Kit for Soil; E.Z.N.A.: E.Z.N.A.® Soil DNA Isolation Kit. PCI; ‡: Each test was repeated five times and the ± values refer to their standard deviations. §Degree of DNA degradation (Lemarchand et al., 2005): 1 = low (mean fragment size between 23 and 2 kb); 2 = medium (mean fragment size between 23 and 0.5 kb); 3 = high (mean fragment size be- tween 23 and < 0.5 kb). #1 = low (mean fragment size between 23 and 2 kb); 2 = medium (mean fragment size between 23 and 0.5 kb); 3 = high (mean frag- ent size between 23 and <0.5 kb); ††Canadian dollars; ¶Not determined since extracted DNA was not visible on the agarose gel stained with ethidium bromide. m Copyright © 2013 SciRes. OPEN ACCESS 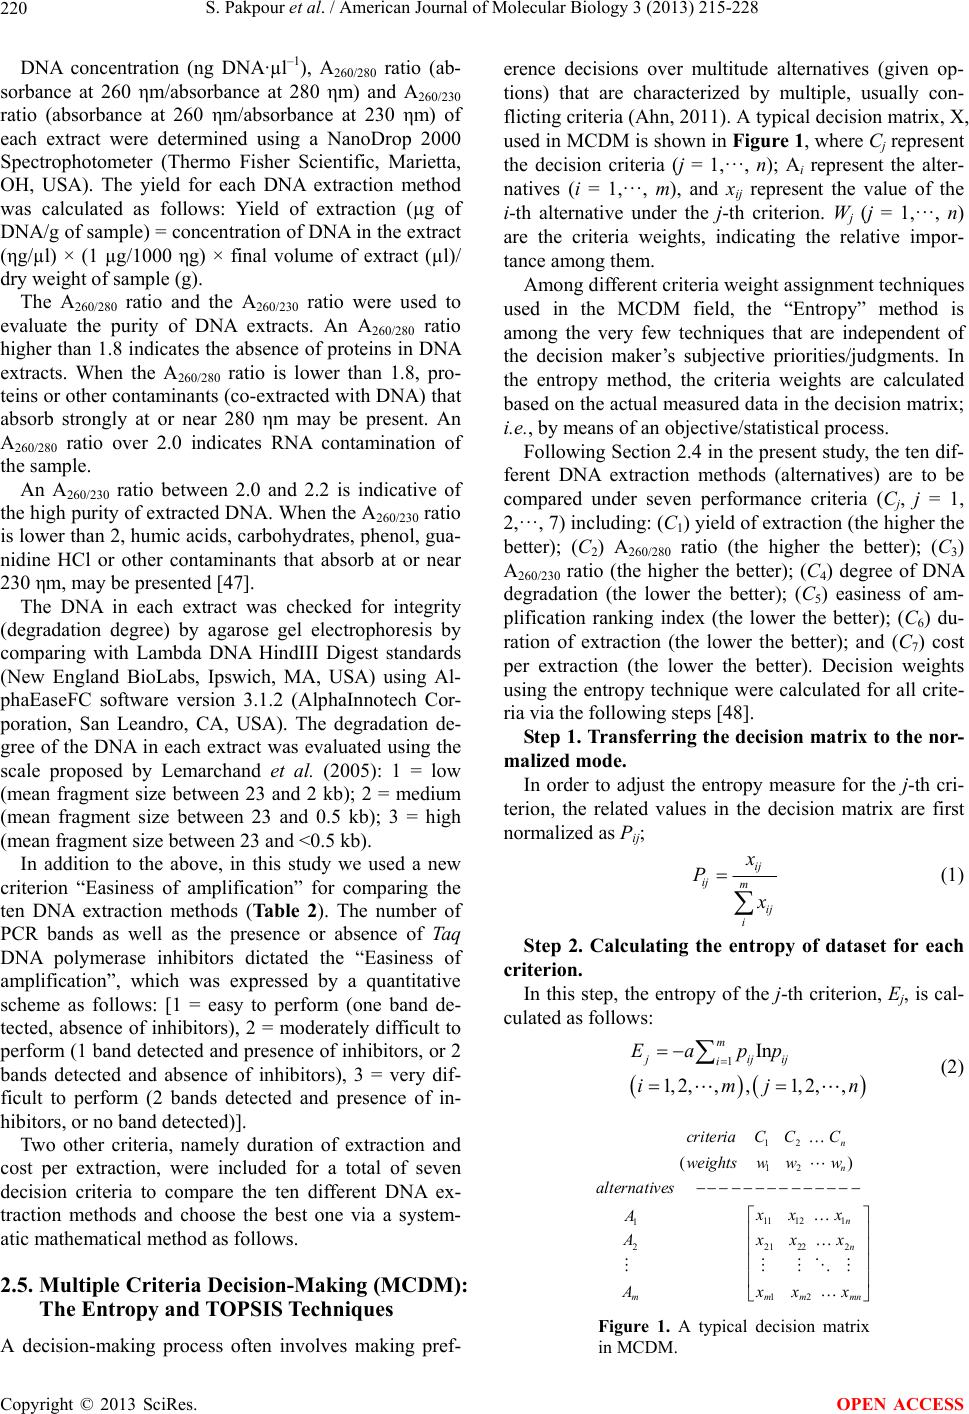 S. Pakpour et al. / American Journal of Molecular Biology 3 (2013) 215-228 220 DNA concentration (ng DNA·µl–1), A260/280 ratio (ab- sorbance at 260 ηm/absorbance at 280 ηm) and A260/230 ratio (absorbance at 260 ηm/absorbance at 230 ηm) of each extract were determined using a NanoDrop 2000 Spectrophotometer (Thermo Fisher Scientific, Marietta, OH, USA). The yield for each DNA extraction method was calculated as follows: Yield of extraction (µg of DNA/g of sample) = concentration of DNA in the extract (ηg/µl) × (1 µg/1000 ηg) × final volume of extract (µl)/ dry weight of sample (g). The A260/280 ratio and the A260/230 ratio were used to evaluate the purity of DNA extracts. An A260/280 ratio higher than 1.8 indicates the absence of proteins in DNA extracts. When the A260/280 ratio is lower than 1.8, pro- teins or other contaminants (co-extracted with DNA) that absorb strongly at or near 280 ηm may be present. An A260/280 ratio over 2.0 indicates RNA contamination of the sample. An A260/230 ratio between 2.0 and 2.2 is indicative of the high purity of extracted DNA. When the A260/230 ratio is lower than 2, humic acids, carbohydrates, phenol, gua- nidine HCl or other contaminants that absorb at or near 230 ηm, may be presented [47]. The DNA in each extract was checked for integrity (degradation degree) by agarose gel electrophoresis by comparing with Lambda DNA HindIII Digest standards (New England BioLabs, Ipswich, MA, USA) using Al- phaEaseFC software version 3.1.2 (AlphaInnotech Cor- poration, San Leandro, CA, USA). The degradation de- gree of the DNA in each extract was evaluated using the scale proposed by Lemarchand et al. (2005): 1 = low (mean fragment size between 23 and 2 kb); 2 = medium (mean fragment size between 23 and 0.5 kb); 3 = high (mean fragment size between 23 and <0.5 kb). In addition to the above, in this study we used a new criterion “Easiness of amplification” for comparing the ten DNA extraction methods (Tab le 2). The number of PCR bands as well as the presence or absence of Taq DNA polymerase inhibitors dictated the “Easiness of amplification”, which was expressed by a quantitative scheme as follows: [1 = easy to perform (one band de- tected, absence of inhibitors), 2 = moderately difficult to perform (1 band detected and presence of inhibitors, or 2 bands detected and absence of inhibitors), 3 = very dif- ficult to perform (2 bands detected and presence of in- hibitors, or no band detected)]. Two other criteria, namely duration of extraction and cost per extraction, were included for a total of seven decision criteria to compare the ten different DNA ex- traction methods and choose the best one via a system- atic mathematical method as follows. 2.5. Multiple Criteria Decision-Making (MCDM): The Entropy and TOPSIS Techniques A decision-making process often involves making pref- erence decisions over multitude alternatives (given op- tions) that are characterized by multiple, usually con- flicting criteria (Ahn, 2011). A typical decision matrix, X, used in MCDM is shown in Figure 1, where Cj represent the decision criteria (j = 1,···, n); Ai represent the alter- natives (i = 1,···, m), and xij represent the value of the i-th alternative under the j-th criterion. Wj (j = 1,···, n) are the criteria weights, indicating the relative impor- tance among them. Among different criteria weight assignment techniques used in the MCDM field, the “Entropy” method is among the very few techniques that are independent of the decision maker’s subjective priorities/judgments. In the entropy method, the criteria weights are calculated based on the actual measured data in the decision matrix; i.e., by means of an objective/statistical process. Following Section 2.4 in the present study, the ten dif- ferent DNA extraction methods (alternatives) are to be compared under seven performance criteria (Cj, j = 1, 2,···, 7) including: (C1) yield of extraction (the higher the better); (C2) A260/280 ratio (the higher the better); (C3) A260/230 ratio (the higher the better); (C4) degree of DNA degradation (the lower the better); (C5) easiness of am- plification ranking index (the lower the better); (C6) du- ration of extraction (the lower the better); and (C7) cost per extraction (the lower the better). Decision weights using the entropy technique were calculated for all crite- ria via the following steps [48]. Step 1. Transferring the decision matrix to the nor- malized mode. In order to adjust the entropy measure for the j-th cri- terion, the related values in the decision matrix are first normalized as Pij; ij ij m ij i P (1) Step 2. Calculating the entropy of dataset for each criterion. In this step, the entropy of the j-th criterion, Ej, is cal- culated as follows: 1In 1, 2,,,1, 2,, m jijij i Eapp imj n mn (2) 12 12 11 121 1 21 2222 12 () n n n n mmm criteria C CC weightswww alternatives xx x A xx xA A xx Figure 1. A typical decision matrix in MCDM. Copyright © 2013 SciRes. OPEN ACCESS  S. Pakpour et al. / American Journal of Molecular Biology 3 (2013) 215-228 221 where, α = 1/ln(m); “m” is the total number of alterna- tives (in this study, the DNA extraction methods over different samples); Next, the operation of subtraction is used to measure the degree of diversity relative to the corresponding an- chor value (unity), Dj, using the following formula: 1 j DE (3) Step 3. Defining criteria weights. The entropy weight of each criterion is calculated us- ing: 1 m j i WD D j (4) These weights are then incorporated into the so-called TOPSIS MCDM technique to calculate an overall score for each DNA extraction method. The TOPSIS technique was chosen because of its high speed, accuracy, and compatibility [49]. The algorithm of this technique is summarized as follows: 1) Transfer the decision matrix to the normalized mode; 2 1 1,2, ,,1,2, , ij ij m ij i x rimj x n (5) 2) Weigh the normalized decision matrix; 1, 2,,,1, 2,, ijjij vWri mjn (6) 3) Define the “ideal positive” V and “ideal negative (nadir)” V solutions; 12 12 ,,,max min1, 2,, ,,, max max1,2,, niij iij niij iij VVVVj J Vj Jim VVVVj J Vj Jim , , (7) 4) Measure the distances, i d and i, i = 1, 2,···, n, from the ideal and negative ideal solutions; d 12 2 1 12 2 1 ,1,2,, ,1,2,, n iijj i n iijj i dVVi dVVi m m (8) 5) Determine the relative closeness of alternatives to the ideal solution; ,1,2,, i i ii d Ci dd m (9) where 0 ≤ ≤ 1. Alternatives with higher magnitudes of closeness are more preferred. i C i C 3. RESULTS 3.1. Revealing Conflicts among the Selection Criteria: A One-Criterion-at-a-Time Analysis The performance of the ten DNA extraction methods under the seven decision criteria for soil, SM [soil:ma- nure, 99:1(w/w)] and SMB [soil:manure:biochar, 98:1:1 (w/w)] are displayed in Table 3 (which in fact can be considered as the given decision matrix in the MCDM terminology). Altogether, 30 different DNA extracts were obtained (10 extraction methods for each of the three sample types). Subsequently, using the values presented in Tabl e 3, the 10 extraction methods were evaluated by seven decision criteria for each of the three sample types and were ranked in Table 4. The ranking results in Table 4 show that the E.Z.N.A alternative extraction method provided the highest yield of extraction for soil and SM samples, whereas for SMB samples, the FastSPIN con- ventional method had the best performance in terms of yield of extraction compared to the other commercial kits and home-made physical-chemical techniques. Under the purity (ratio A260/280 and A260/230) criteria, the PowerSoil conventional and E.Z.N.A. conventional methods ranked 1st and 2nd, respectively, for SM and SMB samples (Table 4). In contrast, under the A260/280 criterion for soil samples, the UltraClean conventional method gained the first rank, followed by the PowerSoil alternative method. However, under the A260/230 criterion for soil samples, the latter method gained the first rank and the UltraClean conventional method received the second rank. The degree of degradation of extracted DNA also var- ied depending on the extraction technique applied (Table 3). It was the highest when the conventional and alterna- tive lysis methods of the FastSPIN and E.Z.N.A. kits were used (Ta bl e 4), and was the lowest using the Pow- erSoil conventional and alternative methods as well as the UltraClean alternative method. Among all commer- cial kits, it is also worth noticing from Tab l e 3 that the UltraClean kit was the only one for which the alternative method reduced the degree of DNA degradation. Under the “Easiness of amplification” criterion, con- sistent specific PCR amplification (unique band) of ~193 bp amplicons corresponding to the V3 region of the Bac- teria 16S rDNA was successfully obtained for DNA ex- tracted from soil, SM and SMB mixtures using both conventional and alternative methods of FastSPIN and E.Z.N.A. (results not shown): hence they resulted in the top rank under this criterion (Tabl e 4 ). In contrast, two bands were detected after amplification of DNA ex- tracted from soil, SM and SMB mixtures using both conventional and alternative methods of UltraClean and owerSoil commercial kits (results not shown). In addi- P Copyright © 2013 SciRes. OPEN ACCESS  S. Pakpour et al. / American Journal of Molecular Biology 3 (2013) 215-228 Copyright © 2013 SciRes. 222 OPEN ACCESS Table 4. Ranks of DNA extraction methods for seven decision criteria; each group of three numbers separated with commas indicate: soil, SM [soil:manure, 99:1(w/w)] and SMB [soil:manure:biochar, 98:1:1(w/w)]. Ranks in decision criteria‡ C1 C2 C3 C4 C5 C6 C7 Methods† Yield of extraction A260/280 ratio A260/230 ratioDegree of DNA degradation Easiness of amplification Duration of extraction Cost per extraction UltraClean Conventional 4, 4, 4 1, 5, 5 2,3, 3 2, 2, 2 2, 2, 2 1, 1, 1 3, 3, 3 UltraClean Alternative 6, 5, 6 7, 8, 8 4, 5, 5 1, 1, 1 2, 2, 2 2, 2, 2 3, 3, 3 PowerSoil Conventional 5, 6, 8 5, 1, 1 3, 1, 1 1, 1, 1 2, 2, 2 3, 3, 3 4, 4, 4 PowerSoil Alternative 10, 7, 5 2, 7, 7 1, 4, 4 1, 1, 1 2, 2, 2 4, 4, 4 4, 4, 4 FastSpin Conventional 3, 3, 1 3, 3, 3 8, 8, 6 3, 3, 3 1, 1, 1 5, 5, 5 5, 5, 5 FastSpin Alternative 2, 2, 2 4, 4, 4 7, 7, 8 3, 3, 3 1, 1, 1 6, 6, 6 5, 5, 5 E.Z.N.A. Conventional 9, 8, 9 6, 2, 2 6, 2, 2 3, 3, 3 1, 1, 1 7, 7, 7 2, 2, 2 E.Z.N.A. Alternative 1, 1, 3 8, 6, 6 5, 6, 7 3, 3, 3 1, 1, 1 8, 8, 8 2, 2, 2 Bead-Beating 8, 9, 10 10, 9, 10 10, 9, 10 ND* 3, 3, 3 9, 9, 9 1, 1, 1 Freeze-Thaw 7, 10, 7 9, 10, 9 9, 10, 9 ND* 3, 3, 3 10, 10, 10 1, 1, 1 †UltraClean: UltraClean™ Soil DNA Isolation Kit; PowerSoil: PowerSoil® DNA Isolation Kit; FastSPIN: FastDNA® SPIN Kit for Soil; E.Z.N.A.: E.Z.N.A.® Soil DNA Isolation Kit. ‡Rank of each DNA extraction method for soil, soil:manure, and soil:manure:biochar, respectively, under each decision criterion. *: Not determined. tion, no band was detected after amplification of DNA extracted by the Bead-Beating and Freeze-Thaw tech- niques. These results imply a requirement for optimiza- tion of the PCR reaction mixture and/or program, as well as the necessity for assessing the presence of Taq DNA polymerase inhibitor(s). For DNA extracted by both conventional and alterna- tive methods of the four commercial kits as well as home-made methods (Bead-Beating and Freeze-Thaw techniques), the specific amplification of ~193 bp am- plicons was obtained for each extract in the inhibition controls (mixture of DNA extracted from E. coli ATCC 25922 and DNA extracted from each sample), indicating the absence of Taq DNA polymerase inhibitors in the extracts from these DNA extraction techniques. The ab- sence of PCR band is in line with the low yields and pu- rities of DNA extracted with these two techniques (Table 3), making them hold the lowest (3rd) rank under the easiness of amplification criterion. The duration of extraction and the cost per extraction are also very important in selecting an optimum DNA extraction technique in view of processing a large num- ber of environmental samples in ecological studies. Un- der the duration of extraction criterion, UltraClean con- ventional method obtained the first rank, followed by the alternative type of UltraClean method (Table 4). The home-made Bead-Beating and Freeze-Thaw techniques performed the poorest under all the criteria except for the cost where they were ranked as the preferred options (least costly). Since the DNA extracted with the Bead- Beating and Freeze-Thaw methods was not visible on the agarose gel stained with ethidium bromide because of very low concentrations (6.08 and 8.16 ng of DNA/µl of extract, respectively, Ta bl e 3 ), the degree of DNA deg- radation could not be determined. The above comparison of the DNA extraction methods under each criterion individually (Table 4) clearly de- monstrates the presence of conflicts among criteria in the given decision-making problem. An example of such conflict is for the FastSpin conventional extraction me- thod which resulted in a good performance in terms of yield of DNA extraction from soil, SM, and SMB (ranks of 3, 3, and 1 respectively), but performed poorly under the degree of DNA degradation criterion. In contrast, the DNA extracted by the E.Z.N.A. conventional method offered a good performance under Easiness of amplifica- tion (rank 1 for all three sample types), but its yield of extraction was one of the lowest (ranks of 9, 8, and 9 for soil, SM, and SMB, respectively). Because of such con- flicts, the MCDM Entropy-TOPSIS approach was deemed necessary and implemented in order to choose overall the best DNA extraction method under simulta- neous decision-making criteria for each specific soil mixture. 3.2. Multiple Criteria Decision-Making (MCDM): The Entropy Method Following Section 2.5, as the first step to the MCDM solution, criteria importance weights needed to be calcu- lated for all seven criteria for soil, SM and SMB using the entropy method according to Formulas 1-4. For ex- ample, to calculate the weight of criterion C1 for DNA extraction from soil, the normalization was first per- formed to calculate pij values using formula 1 (Ta ble 5). Then, pij × ln(pij) values were calculated (see the exam-  S. Pakpour et al. / American Journal of Molecular Biology 3 (2013) 215-228 223 Table 5. Normalized decision matrix for DNA extraction methods for soil. Normalized Decision Matrix Data (pij) C1 C2 C3 C4 C5 C6 C7 Methods† Yield of extraction A260/280 ratio A260/230 ratio Degree of DNA degradation Easiness of amplification Duration of extraction Cost per extraction UltraClean Conventional 0.09‡ 0.13 0.18 0.12 0.10 0.07 0.11 UltraClean Alternative 0.06 0.12 0.16 0.06 0.10 0.07 0.11 PowerSoil Conventional 0.07 0.12 0.17 0.06 0.10 0.08 0.13 PowerSoil Alternative 0.04 0.13 0.28 0.06 0.10 0.09 0.13 FastSpin Conventional 0.19 0.13 0.03 0.18 0.15 0.09 0.16 FastSpin Alternative 0.24 0.13 0.05 0.18 0.15 0.10 0.16 E.Z.N.A. Conventional 0.05 0.12 0.06 0.18 0.15 0.25 0.10 E.Z.N.A. Alternative 0.27 0.12 0.07 0.18 0.15 0.26 0.10 †UltraClean: UltraClean™ Soil DNA Isolation Kit; PowerSoil: PowerSoil® DNA Isolation Kit; FastSPIN: FastDNA® SPIN Kit for Soil; E.Z.N.A.: E.Z.N.A.® Soil DNA Isolation Kit. ‡Example of calculation: Yield of extraction criterion for soil (using Table 3): 0.09 = 8.21/(8.21 + 5.59 + 6.76 + 3.78 + 17.70 + 23.29 + 4.33 + 25.98). ple of calculation in Table 6) followed by the calculation of Ej and Dj using Formulas 2 and 3, respectively (Table 6). Finally the weight of each criterion was calculated using Formula 4. All criteria weights for soil, SM and SMB are summarized in Table 7. It should be added that in some cases the decision maker is experienced enough to have his/her own (subjective) weights, which can be combined by the (objective) Entropy weights extracted from Equation (4). The mathematical framework for the latter combined weighting scheme can be found in [43]. Here it is assumed that the decision maker is inexperi- enced and/or conservative where he/she has an equal preference towards the performance criteria and hence prefers to purely rely on the Entropy weights. 3.3. Selecting an Optimal DNA Extraction Method for Each Sample Type: The TOPSIS Method The obtained weights of criteria were incorporated into the TOPSIS technique (Formulas 5-9) to calculate an overall score for each DNA extraction method for soil, SM, and SMB (Tables 8-12). The final rakings of the extraction methods for different sample types are shown in Tables 10-12. Based on these results, the extraction methods were ranked as follows: For soil (Ta b le 10, descending order): PowerSoil Al- ternative > FastSpin Alternative > E.Z.N.A. Alternative > UltraClean Conventional > PowerSoil Conventional > UltraClean Alternative > FastSpin Conventional > E.Z.N.A. Conventional > Bead-Beating = Freeze-Thaw; For SM (Table 1 1, descending order): PowerSoil Con- ventional > UltraClean Conventional > UltraClean Al- ternative > PowerSoil Alternative > FastSpin Alternative > FastSpin Conventional > E.Z.N.A. Conventional > E.Z.N.A. Alternative > Bead-Beating = Freeze-Thaw; For SMB (Table 12, descending order): PowerSoil Conventional > UltraClean Conventional > PowerSoil Alternative > UltraClean Alternative > FastSpin Conven- tional > FastSpin Alternative > E.Z.N.A. Conventional > E.Z.N.A. Alternative > Bead-Beating = Freeze-Thaw. 4. DISCUSSION The selection of an appropriate method for extracting DNA from complex ecosystems such as soil has a critical impact on the composition and richness of detected mi- crobial communities using culture-independent molecu- lar microbiological methods, such as competitive PCR, real-time PCR, denaturing gradient gel electrophoresis (DGGE) and Next-Generation DNA Sequencing (NGS) technologies [9,10,11,29]. In addition, it has been dem- onstrated that the quality of extracted DNA can interfere with microarray hybridizations, yielding high back- ground noise and false positives [9,10,24,50]. These ar- guments show the necessity for carefully selecting a suitable DNA extraction method for each given sample type and proposed downstream DNA-based analyses. In the present study, we compared both the quantity and quality of DNA extracted from soil, SM and SMB mixtures using 10 different DNA extraction methods to be used subsequently for PCR analysis. The results showed that both the quantity (yield of extraction) and the quality (purity, degree of degradation, easiness of amplification) of the extracted DNA depended on the extraction method and the type of environmental sample (Ta bl e 3), which was in agreement with earlier observa- tions reported in the literature [9,10,14,32,33]. Moreover, Copyright © 2013 SciRes. OPEN ACCESS  S. Pakpour et al. / American Journal of Molecular Biology 3 (2013) 215-228 224 Table 6. Calculating the entropy of data (column-wise) for each decision criterion for soil. pij × lnpij C1 C2 C3 C4 C5 C6 C7 Methods† Yield of extraction A260/280 ratio A260/230 ratio Degree of DNA degradation Easiness of amplification Duration of extraction Cost per extraction UltraClean Conventional −0.21‡ −0.27 −0.31 −0.25 −0.23 −0.18 −0.24 UltraClean Alternative −0.17 −0.26 −0.30 −0.17 −0.23 −0.19 −0.24 PowerSoil Conventional −0.19 −0.26 −0.30 −0.17 −0.23 −0.20 −0.27 PowerSoil Alternative −0.13 −0.26 −0.36 −0.17 −0.23 −0.21 −0.27 Fast Spin Conventional −0.31 −0.26 −0.11 −0.31 −0.28 −0.22 −0.29 Fast Spin Alternative −0.34 −0.26 −0.14 −0.31 −0.28 −0.23 −0.29 E.Z.N.A. Conventional −0.14 −0.26 −0.16 −0.31 −0.28 −0.35 −0.23 E.Z.N.A. Alternative −0.35 −0.25 −0.19 −0.31 −0.28 −0.35 −0.23 Sum −1.84 −2.08 −1.87 −1.98 −2.06 −1.92 −2.07 Ej§ 0.89¶ 1.00 0.90 0.95 0.99 0.92 0.99 Dj# 0.11†† 0.00 0.10 0.05 0.01 0.08 0.01 †UltraClean: UltraClean™ Soil DNA Isolation Kit; PowerSoil: PowerSoil® DNA Isolation Kit; FastSPIN: FastDNA® SPIN Kit for Soil; E.Z.N.A.: E.Z.N.A.® Soil DNA Isolation Kit. ‡Example of calculation: p11 × lnp11 (using Table 5, Formula 1) = 0.09 × ln(0.09). §Ej = entropy of the set of normalized data. ¶Example of calculation of E1 where α = 0.48 (Formula 2): 0.65 = −0.48 × [(−0.21) + (−0.17) + (−0.19)) + (−0.13) + (−0.31) + (−0.34)]. #Dj = degree of diversity. ††Example of calculation of D1: 0.35 = 1 − 0.65 (Formula 3). Table 7. Criteria weights (Wj, j = 1, 2,···, 7) for soil, SM [soil:manure, 99:1(w/w)] and SMB [soil:manure:biochar, 98:1:1(w/w)]. C1 C2 C3 C4 C5 C6 C7 Soil 0.32† 0.00 0.28 0.14 0.03 0.21 0.02 SM 0.16 0.01 0.25 0.21 0.04 0.31 0.03 SMB 0.16 0.01 0.22 0.22 0.04 0.33 0.03 †Example of calculation of W1 (weight of yield of extraction for soil, formula 4), using D1 in Table 6: 0.32 = 0.11/(0.11 + 0.00 + 0.10 + 0.05 + 0.01 + 0.08 +0.01). Table 8. Summary of normalized decision matrix data for TOPSIS method using seven decision criteria for each DNA extraction method for soil. Normalized Decision Matrix Data C1 C2 C3 C4 C5 C6 C7 Methods† Yield of extraction A260/280 ratio A260/230 ratio Degree of DNA degradation Easiness of amplification Duration of extraction Cost per extraction UltraClean Conventional 0.20‡ 0.37 0.42 0.30 0.28 0.16 0.31 UltraClean Alternative 0.14 0.34 0.39 0.15 0.28 0.18 0.31 PowerSoil Conventional 0.16 0.35 0.41 0.15 0.28 0.19 0.37 PowerSoil Alternative 0.09 0.37 0.66 0.15 0.28 0.21 0.37 FastSpin Conventional 0.43 0.36 0.08 0.46 0.42 0.22 0.43 FastSpin Alternative 0.56 0.36 0.11 0.46 0.42 0.24 0.43 E.Z.N.A. Conventional 0.10 0.35 0.14 0.46 0.42 0.61 0.29 E.Z.N.A. Alternative 0.63 0.33 0.17 0.46 0.42 0.62 0.29 †UltraClean: UltraClean™ Soil DNA Isolation Kit; PowerSoil: PowerSoil® DNA Isolation Kit; FastSPIN: FastDNA® SPIN Kit for Soil; E.Z.N.A.: E.Z.N.A.® Soil DNA Isolation Kit. ‡Example of calculation: Yield of extraction criterion for soil (using Table 3): 0.20 = 8.21/[(8.21)2 + (5.59)2 + (6.76)2 + (3.78)2 + (17.70)2 + (23.29)2 + (4.33)2 + (25.98)2 + (5.24)2 + (5.49)2]0.5. Copyright © 2013 SciRes. OPEN ACCESS  S. Pakpour et al. / American Journal of Molecular Biology 3 (2013) 215-228 225 Table 9. Summary of the weighted normalized decision matrix data for the TOPSIS method using seven decision criteria for each DNA extraction method for soil. Vij C1 C2 C3 C4 C5 C6 C7 Methods† Yield of extraction A260/280 ratio A260/230 ratio Degree of DNA degradation Easiness of amplification Duration of extraction Cost per extraction UltraClean Conventional 0.06‡ 0.00 0.12 0.04 0.01 0.03 0.01 UltraClean Alternative 0.04 0.00 0.11 0.02 0.01 0.04 0.01 PowerSoil Conventional 0.05 0.00 0.11 0.02 0.01 0.04 0.01 PowerSoil Alternative 0.03 0.00 0.19 0.02 0.01 0.04 0.01 FastSpin Conventional 0.14 0.00 0.02 0.06 0.01 0.05 0.01 FastSpin Alternative 0.18 0.00 0.03 0.06 0.01 0.05 0.01 E.Z.N.A. Conventional 0.03 0.00 0.04 0.06 0.01 0.13 0.01 E.Z.N.A. Alternative 0.20 0.00 0.05 0.06 0.01 0.13 0.01 Sum 0.74 0.00 0.67 0.36 0.08 0.51 0.06 V+ § 0.20 0.00 0.19 0.06 0.01 0.13 0.01 V- ¶ 0.03 0.00 0.02 0.02 0.01 0.03 0.01 †UltraClean: UltraClean™ Soil DNA Isolation Kit; PowerSoil: PowerSoil® DNA Isolation Kit; FastSPIN: FastDNA® SPIN Kit for Soil; E.Z.N.A.: E.Z.N.A.® Soil DNA Isolation Kit. ‡Example of calculation: 0.06 = 0.20 (normalized data for UltraClean Conventional under the yield of extraction criterion, Table 8) × 0.32 (weight of yield of extraction criterion for soil, Table 7). §Ideal positive solution. ¶Ideal negative solution. Table 10. Summary of the positive and negative distances and the final TOPSIS scores of DNA extractions methods for soil. i d i d TOPSIS Score : Ci + Rank Methods† Value Value Value UltraClean Conventional 0.156‡ 0.140§ 0.474¶ 4 UltraClean Alternative 0.175 0.134 0.433 6 PowerSoil Conventional 0.165 0.136 0.452 5 PowerSoil Alternative 0.172 0.189 0.522 1 FastSpin Conventional 0.181 0.136 0.429 7 FastSpin Alternative 0.164 0.171 0.511 2 E.Z.N.A. Conventional 0.247 0.018 0.068 8 E.Z.N.A. Alternative 0.176 0.174 0.496 3 †UltraClean: UltraClean™ Soil DNA Isolation Kit; PowerSoil: PowerSoil® DNA Isolation Kit; FastSPIN: FastDNA® SPIN Kit for Soil; E.Z.N.A.: E.Z.N.A.® Soil DNA Isolation Kit. Example of calculation ‡using Table 9: 0.156 = (0.06 − 0.20)2 + (0.00 − 0.00)2 + (0.12 − 0.19)2 + (0.04 − 0.06)2 + (0.01 − 0.01)2 + (0.03 − 0.013)2 + (0.01 − 0.01)2; §0.140 = (0.06 − 0.03)2 + (0.00 − 0.00)2 + (0.12 − 0.02) 2 + (0.04 − 0.02)2 + (0.01 − 0.01)2 + (0.03 − 0.03)2 + (0.01 − 0.01)0.5; ¶0.474 = 0.140/(0.140 + 0.156). the application of an alternative lysis step for most of the extraction methods did not improve their performance significantly, except for the E.Z.N.A. method (Ta b le 3 ). This method, both its conventional and alternative ver- sions, resulted in high values of DNA purity. However, the E.Z.N.A. conventional method provided much lower yields of extraction in comparison to its alternative method, as was also observed in other investigations [32,33]. Because of the demonstrated conflicts among different Table 11. Summary of the positive and negative distances and the final TOPSIS scores of DNA extractions methods for SM [soil:manure, 99:1(w/w)]. i d i d TOPSIS Score : Ci + Rank Methods† ValueValue Value UltraClean Conventional0.0560.176 0.757 2 UltraClean Alternative0.0870.160 0.647 3 PowerSoil Conventional0.0550.184 0.770 1 PowerSoil Alternative0.0860.153 0.640 4 FastSpin Conventional0.1250.138 0.524 6 FastSpin Alternative 0.1190.133 0.529 5 E.Z.N.A. Conventional0.1680.095 0.362 7 E.Z.N.A. Alternative 0.1830.067 0.268 8 †UltraClean: UltraClean™ Soil DNA Isolation Kit; PowerSoil: PowerSoil® DNA Isolation Kit; FastSPIN: FastDNA® SPIN Kit for Soil; E.Z.N.A.: E.Z.N.A.® Soil DNA Isolation Kit. extraction methods and criteria, the selection of the op- timum method for different types of soil was not strai- ghtforward (Table 4). For this reason, for the first time in the field, the application of a systematic MCDM ap- proach was proposed and implemented to select overall the optimum DNA extraction method for each type of soil. The PowerSoil method was systematically defined as the best performing method for extracting DNA from soil samples; more specifically, for soil, the alternative version of the PowerSoil method gained the first rank (Table 10), while for SM and SMB its conventional ver- Copyright © 2013 SciRes. OPEN ACCESS  S. Pakpour et al. / American Journal of Molecular Biology 3 (2013) 215-228 226 Table 12. Summary of the positive and negative distances and the final TOPSIS scores of DNA extraction methods for SMB [soil:manure:biochar, 98:1:1(w/w)]. i d i d TOPSIS Score : Ci + Rank Methods† Value Value Value UltraClean Conventional 0.065 0.162 0.714 2 UltraClean Alternative 0.080 0.160 0.666 4 PowerSoil Conventional 0.059 0.172 0.744 1 PowerSoil Alternative 0.072 0.153 0.681 3 FastSpin Conventional 0.108 0.141 0.567 5 FastSpin Alternative 0.116 0.132 0.531 6 E.Z.N.A. Conventional 0.176 0.088 0.333 7 E.Z.N.A. Alternative 0.193 0.030 0.134 8 †UltraClean: UltraClean™ Soil DNA Isolation Kit; PowerSoil: PowerSoil® DNA Isolation Kit; FastSPIN: FastDNA® SPIN Kit for Soil; E.Z.N.A.: E.Z.N.A.® Soil DNA Isolation Kit. sion performed best (Tables 11 and 12, respectively). The performances of the DNA extraction kits assessed in the present study (Table 3) were similar or better than those reported in the literature. For the PowerSoil kit, which ranked first in the present work, the yields of ex- traction ranged between 3.78 and 11.97 µg of DNA/g of soil, while the A260/280 and A260/230 ratios varied from 1.55 to 1.96 and 0.86 to 2.07, respectively. Previous studies reported yields of extraction of 0.12 to 23.0 µg of DNA/g of soil, as well as A260/280 and A260/230 ratios of 1.34 - 1.65 and 0.55 - 0.61, respectively [10,14,32,33]. Using the UltraClean kit, we obtained yields of extrac- tion ranging from 5.59 to 14.21 µg of DNA/g of soil, A260/280 ratios between 1.50 and 1.77, and A260/230 ratios between 0.81 and 1.43. Other authors presented yields of extraction between 0.31 and 2.81 µg of DNA/g of soil, an average A260/280 ratio of 1.33, and A260/230 ratios be- tween 0.67 and 2.20 [10,29,31,34]. In the present study, the yields of extraction with the FastSpin kit ranged between 17.70 and 23.87 µg of DNA/g of soil, whereas the A260/280 and A260/230 ratios were 1.70 - 1.84 and 0.25 - 0.60, respectively. The lit- erature indicates lower yields of extraction (0.80 to 9.12 µg of DNA/g of soil), A260/280 ratios (1.53 to 1.64) and A260/230 ratios (0.24 to 0.28) [10,29-31,33]. Regarding the E.Z.N.A. kit, Table 3 indicates yields of extraction of 4.33 to 25.98 µg of DNA/g of soil (with significant improvements using the alternative method), A260/280 ratios of 1.56 to 1.87, and A260/230 ratios of 0.30 to 1.70. Previous publications included similar or lower yields of extraction (between 0.60 to 12.5 µg of DNA/g of soil), similar A260/280 ratios ranging from 1.75 to 1.87, and generally higher A260/230 ratios varying from 1.59 to 1.87 [32,33]. 5. CONCLUDING REMARK In summary, the choice of a DNA extraction method for microbial ecology studies is critical to obtain reliable results since each method can affect the composition and the richness of microbial communities of tested samples. Hence, in selecting a suitable extraction method, it is necessary to take into account the type of the environ- mental sample (in our case, soil, SM, and SMB), quanti- tative and qualitative characteristics of extracted DNA (e.g., yield of extraction, purity, degradation degree, quality of PCR products), and downstream molecular analyses such as competitive PCR, real-time PCR, dena- turing gradient gel electrophoresis (DGGE) and large-scale parallel-pyrosequencing. Based on the results of the per- formed case study, overall we recommend the Power- Soil® DNA Isolation Kit as an optimum method for ob- taining total bacterial DNA from soil and soil-containing mixtures such as soil:manure and soil:manure:biochar. The standardization/selection of DNA extraction techni- ques in the field is a current problem, and hence the po- werful MCDM approaches such as entropy/TOPSIS which were used in this study are recommended as a first step towards comparing similar methods in other studies. 6. ACKNOWLEDGEMENTS This work was supported by the National Sciences and Engineering Research Council of Canada (NSERC—Discovery Grant) and the Fonds de recherche du Quebec sur la Nature et les Technologies (FRQNT—Team Research Grant Project) for operating funds, and by the Canada Foundation for Innovation (CFI—Leaders Opportunity Fund) for infrastructure funds to Martin R. Chénier. Snizhana V. Oli- shevska benefited from the CFI—Infrastructure Operating Fund for personal support. The financial support by UBC’s Work-Study Pro- gram to Sepideh Pakpour is also greatly acknowledged. REFERENCES [1] Robe, P., Nalin, R., Capellano, C., Vogel, T.A. and Simo- net, P. (2003) Extraction of DNA from soil. European Journal of Soil Biology, 39, 183-190. http://dx.doi.org/10.1016/S1164-5563(03)00033-5 [2] Verheijen, F.G.A., Jeffery, S., Bastos, A.C., van der Vel- de, M. and Diafas, I. (2009) Biochar application to soils - a critical scientific review of fffects on soil properties, processes and functions. EUR 24099 EN, Office for the Official Publications of the European Communities, Lu- xembourg. [3] Amann, R.I., Ludwig, W. and Schleifer, K.H. (1995) Phylogenetic identification and in situ detection of indi- vidual microbial cells without cultivation. Microbiology Reviews, 59, 143-169. [4] Roose-Amsaleg, C.L., Garnier-Sillam, E. and Harry, M. (2001) Extraction and purification of microbial DNA from soil and sediment samples. Applied Soil Ecology, 18, Copyright © 2013 SciRes. OPEN ACCESS  S. Pakpour et al. / American Journal of Molecular Biology 3 (2013) 215-228 227 47-60. http://dx.doi.org/10.1016/S0929-1393(01)00149-4 [5] Torsvik, V., Goksoyr, J. and Daae, F.L. (1990) High di- versity in DNA of soil bacteria. Applied and Environ- mental Microbiology, 56, 782-787. [6] Ritz, K. (2007) The plate debate: Cultivable communities have no utility in contemporary environmental microbial ecology. Fems Microbiology Ecology, 60, 358-362. http://dx.doi.org/10.1111/j.1574-6941.2007.00331.x [7] Morris, C.E., Bardin, M., Berge, O., Frey-klett, P., Fro- min, N., Girardin, H., Guinebretiére, M.H., Lebaron, P., Thiéry, J.M. and Trousselier, M. (2002) Microbial bio- diversity: Approaches to experimental design and hypo- thesis testing in primary scientific literature from 1975 to 1999. Microbiology and Molecular Biology Reviews, 66, 592-616. http://dx.doi.org/10.1128/MMBR.66.4.592-616.2002 [8] Dorigo, U., Volatier, L. and Humbert, J.F. (2005) Mole- cular approaches to the assessment of biodiversity in aqu- atic microbial communities. Water Research, 39, 2207- 2218. http://dx.doi.org/10.1016/j.watres.2005.04.007 [9] De Lipthay, J.R., Enzinger, C., Johnsen, K., Aamand, J., and Sorensen, S.J. (2004) Impact of DNA extraction method on bacterial community composition measured by denaturing gradient gel electrophoresis. Soil Biology & Biochemistry, 36, 1607-1614. http://dx.doi.org/10.1016/j.soilbio.2004.03.011 [10] Ning, J., Liebich, J., Kastner, M., Zhou, J.Z., Schaffer, A. and Burauel, P. (2009) Different influences of DNA pu- rity indices and quantity on PCR-based DGGE and func- tional gene microarray in soil microbial community study. Applied Microbiology and Biotechnology, 82, 983-993. http://dx.doi.org/10.1007/s00253-009-1912-0 [11] Carrigg, C., Rice, O., Kavanagh, S., Collins, G. and O’Flaherty, V. (2007) DNA extraction method affects microbial community profiles from soils and sediment. Applied Microbiology and Biotechnology, 77, 955-964. http://dx.doi.org/10.1007/s00253-007-1219-y [12] Roh, C., Villatte, F., Kim, B.G. and Schmid, R.D. (2006) Comparative study of methods for extraction and pu- rification of environmental DNA from soil and sludge samples. Applied Biochemistry and Biotechnology, 134, 97-112. http://dx.doi.org/10.1385/ABAB:134:2:97 [13] Arbeli, Z. and Fuentes, C.L. (2007) Improved purification and PCR amplification of DNA from environmental samples. Fems Microbiology Letters, 272, 269-275. http://dx.doi.org/10.1111/j.1574-6968.2007.00764.x [14] Rosa, M.M., Tornisielo, S.M.T. and Ceccato-Antonini, R. (2010) Evaluation of different techniques for DNA direct extraction from Brazilian agricultural soil. HOLOS Envi- ronment, 10, 12-25. [15] Burgmann, H., Pesaro, M., Widmer, F. and Zeyer, J. (2001) A strategy for optimizing quality and quantity of DNA extracted from soil. Journal of Microbiological Me- thods, 45, 7-20. http://dx.doi.org/10.1007/s11104-007-9193-9 [16] Steiner, C., Teixeira, W.G., Lehmann, J., Nehls, T., de Macedo, J.L.V., Blum, W.E.H. and Zech, W. (2007) Long term effects of manure, charcoal and mineral fer- tilization on crop production and fertility on a highly weathered Central Amazonian upland soil. Plant and Soil, 291, 275-290. http://dx.doi.org/10.1007/s11104-007-9193-9 [17] Mathews, J.A. (2008) Carbon-negative biofuels. Energy Policy, 36, 940-945. http://dx.doi.org/10.1016/j.enpol.2007.11.029 [18] Laird, D.A. (2008) The charcoal vision: A win-win-win scenario for simultaneously producing bioenergy, perma- nently sequestering carbon, while improving soil and water quality. Agronomy Journal, 100, 178-181. http://dx.doi.org/10.2134/agrojnl2007.0161 [19] Sohi, S., Loez-Capel, E., Krull, E. and Bol, R. (2009) Biochar’s roles in soil and climate change: A review of research needs. Okehampton, UK. [20] Tebbe, C.C. and Vahjen, W. (1993) Interference of humic acids and DNA extracted directly from soil in detection and transformation of recombinant-DNA from bacteria and a yeast. Applied and Environmental Microbiology, 59 , 2657-2665. [21] Sørensen, S.J., Müller, A.K., Hansen, L.H., Rasmussen, L.D., Lipthay, J.R. and Barkay, T. (2002) Molecular me- thods for assessing and manipulating the diversity of microbiological populations and processes. In: Burns RG, Dick RP, Eds., Enzymes in the Environment, Marcel Dekker, New York. http://dx.doi.org/10.1201/9780203904039.ch14 [22] Fortin, N., Beaumier, D., Lee, K. and Greer, C.W. (2004) Soil washing improves the recovery of total community DNA from polluted and high organic content sediments. Journal of Microbiological Methods, 56, 181-191. http://dx.doi.org/10.1016/j.mimet.2003.10.006 [23] Wu, L.Y., Thompson, D.K., Li, G.S., Hurt, R.A., Tiedje, J.M. and Zhou, J. (2001) Development and evaluation of functional gene arrays for detection of selected genes in the environmental. Applied and Environmental Micro- biology, 67, 5780-5790. http://dx.doi.org/10.1128/AEM.67.12.5780-5790.2001 [24] Zhou, J.Z. and Thompson, D.K. (2002) Challenges in applying microarrays to environmental studies. Current Opinion in Biotechnology, 13, 204-207. http://dx.doi.org/10.1016/S0958-1669(02)00319-1 [25] Holben, W.E., Jansson, J.K., Chelm, B.K. and Tiedje, J.M. (1988) DNA probe method for the detection of specific microorganisms in the soil bacterial community. Applied and Environmental Microbiology, 54, 703-711. [26] Jacobsen, C.S. and Rasmussen, O.F. (1992) Development and application of a new method to extract bacterial- DNA from soil based on separation of bacteria from soil with cation-exchange resin. Applied and Environmental Microbiology, 58, 2458-2462. [27] Yeates, C., Gillings, M.R., Davison, A.D., Altavilla, N. and Veal, D.A. (1998) Methods for microbial DNA ex- traction from soil for PCR amplification. Biological Pro- cedures Online, 14, 1-8. http://dx.doi.org/10.1251/bpo6 [28] Kumar, P.P. (2011) An improved method for extraction of heterologous DNA from environmental samples for the construction of metagenomic libreries. International Jour- nal of Pharma and Bio Sciences, 2, 368-373. Copyright © 2013 SciRes. OPEN ACCESS  S. Pakpour et al. / American Journal of Molecular Biology 3 (2013) 215-228 Copyright © 2013 SciRes. 228 OPEN ACCESS [29] Martin-Laurent, F., Philippot, L., Hallet, S., Chaussod, R., Germon, J.C., Soulas, G., and Catroux, G. (2001) DNA extraction from soils: Old bias for new microbial diver- sity analysis methods. Applied and Environmental Micro- biology, 67, 2354-2359. http://dx.doi.org/10.1128/AEM.67.5.2354-2359.2001 [30] Park, J.W. and Crowley, D.E. (2005) Normalization of soil DNA extraction for accurate quantification real-time PCR and of target genes by DGGE. Biotechniques, 38, 579-586. http://dx.doi.org/10.2144/05384ST04 [31] Klerks, M.M., van Bruggen, A.H.C, Zijlstra, C. and Donnikov, M. (2006) Comparison of methods of extrac- ting Salmonella enterica serovar enteritidis DNA from Model Based on Aras-G and AHP Methods for Multiple environmental substrates and quantification of organisms by using a general internal procedural control. Applied and Environmental Microbiology, 72, 3879-3886. http://dx.doi.org/10.1128/AEM.02266-05 [32] Huang, B., Zu, T. and Guo, Q. (2007) Extract PCR-ready soil DNA with the new E.Z.N.A.® soil DNA isolation kit. The Market Source for Life Science VWR biomarker International, 26-27. [33] Dineen, S.M., Aranda, R., Anders, D.L., and Robertson, J.M. (2010) An evaluation of commercial DNA extrac- tion kits for the isolation of bacterial spore DNA from soil. Journal of Applied Microbiology, 109, 1886-1896. http://dx.doi.org/10.1111/j.1365-2672.2010.04816.x [34] Fitzpatrick, K.A., Kersh, G.J. and Massung, R.F. (2010) Practical Method for Extraction of PCR-Quality DNA from Environmental Soil Samples. Applied and Environ- mental Microbiology, 76, 4571-4573. http://dx.doi.org/10.1128/AEM.02825-09 [35] Roy, B. (1993) Aide Multicritère à la Décision: Méthodes et Cas. Economica, Paris. [36] Roy, B. (1990) Decision-aid and decision-making. In: Bana, E. and Costa, C.A., Eds., Readings in Multiple Criteria De- cision-Aid. Springer-Verlag, Heidelberg, 17-35. http://dx.doi.org/10.1007/978-3-642-75935-2_2 [37] Collette, Y. and Siarry, P. (2003) Multiobjective opti- mization. Springer-Verlag, New York. [38] Pakpour, S., Milani, A. and Chénier, M. (2012) A multi- criteria decision-making approach for comparing sample preservation and DNA extraction methods from swine feces. American Journal of Molecular Biology, 2, 159- 169. http://dx.doi.org/10.4236/ajmb.2012.22018 [39] Putrus, P. (1990) Accounting for intangibles in integrated manufacturing-nonfinancial justification based on the analytical hierarchy process. Information Strategy, 6, 25- 30. [40] Boucher, T.O. and McStravic, E.L. (1991) Multi-attribute evaluation within a present value framework and its re- lation to the analytic hierarchy process. The Engineering Economist, 37, 55-71. http://dx.doi.org/10.1080/00137919108903055 [41] Pohekar, S.D. and Ramachandran, M. (2004) Application of multi-criteria decision making to sustainable energy planning—A review. Renewable and Sustainable Energy Reviews, 8, 365-381. http://dx.doi.org/10.1016/j.rser.2003.12.007 [42] Turskis, Z., Zavadskas, K.E. and Kutut, V. (2013) A criteria prioritizing of heritage value. International Jour- nal of Information Technology and Decision Making, 12, 45. http://dx.doi.org/10.1142/S021962201350003X [43] Hwang, C.L. and Yoon, K. (1981) Multiple attribute deci- sion making: Methods and applications. Springer-Verlag, New York. http://dx.doi.org/10.1007/978-3-642-48318-9 [44] Ewa, R. (2011) Multi-criteria decision making models by applying the TOPSIS method to crisp and interval data. In: Trzaskalik, T. and Wachowicz, T., Eds., Multiple Cri- teria Decision Making, The University of Economics, Katowice, pp. 200-230. [45] Muyzer, G., Dewaal, E.C. and Uitterlinden, A.G. (1993) Profiling of complex microbial-populations by denaturing gradient gel-electrophoresis analysis of polymerase chain reaction-amplified genes-coding for 16s ribosomal-RNA. Applied and Environmental Microbiology, 59, 695-700. [46] Chenier, M.R. and Juteau, P. (2009) Fate of chlorte- tracycline- and tylosin-resistant bacteria in an aerobic thermophilic sequencing batch reactor treating swine waste. Microbial Ecology, 58, 86-97. http://dx.doi.org/10.1007/s00248-008-9478-4 [47] Thermo Fisher Scientific (2009) NanoDrop 2000/2000c spectrophotometer, V1.0 user manual. [48] Ahn, B.S. (2011) Compatible weighting method with rank order centroid: Maximum entropy ordered weighted averaging approach. European Journal of Operational Research, 212, 552-559. http://dx.doi.org/10.1016/j.ejor.2011.02.017 [49] Zou, Z.H., Yan, Y. and Sun, J.N. (2006) Entropy method for determination of weight of evaluating indicators in fuzzy synthetic evaluation for water quality assessment. Journal of Environmental Sciences-China, 18, 1020-1023. http://dx.doi.org/10.1016/S1001-0742(06)60032-6 [50] Lemarchand, K., Berthiaume, F., Maynard, C., Harel, J., Payment, P., Bayardelle, P., Masson, L. and Brousseau, R. (2005) Optimization of microbial DNA extraction and purification from raw wastewater samples for down- stream pathogen detection by microarrays. Journal of Microbiological Methods, 63, 115-126. http://dx.doi.org/10.1016/j.mimet.2005.02.021
|