B. SUN ET AL.
420
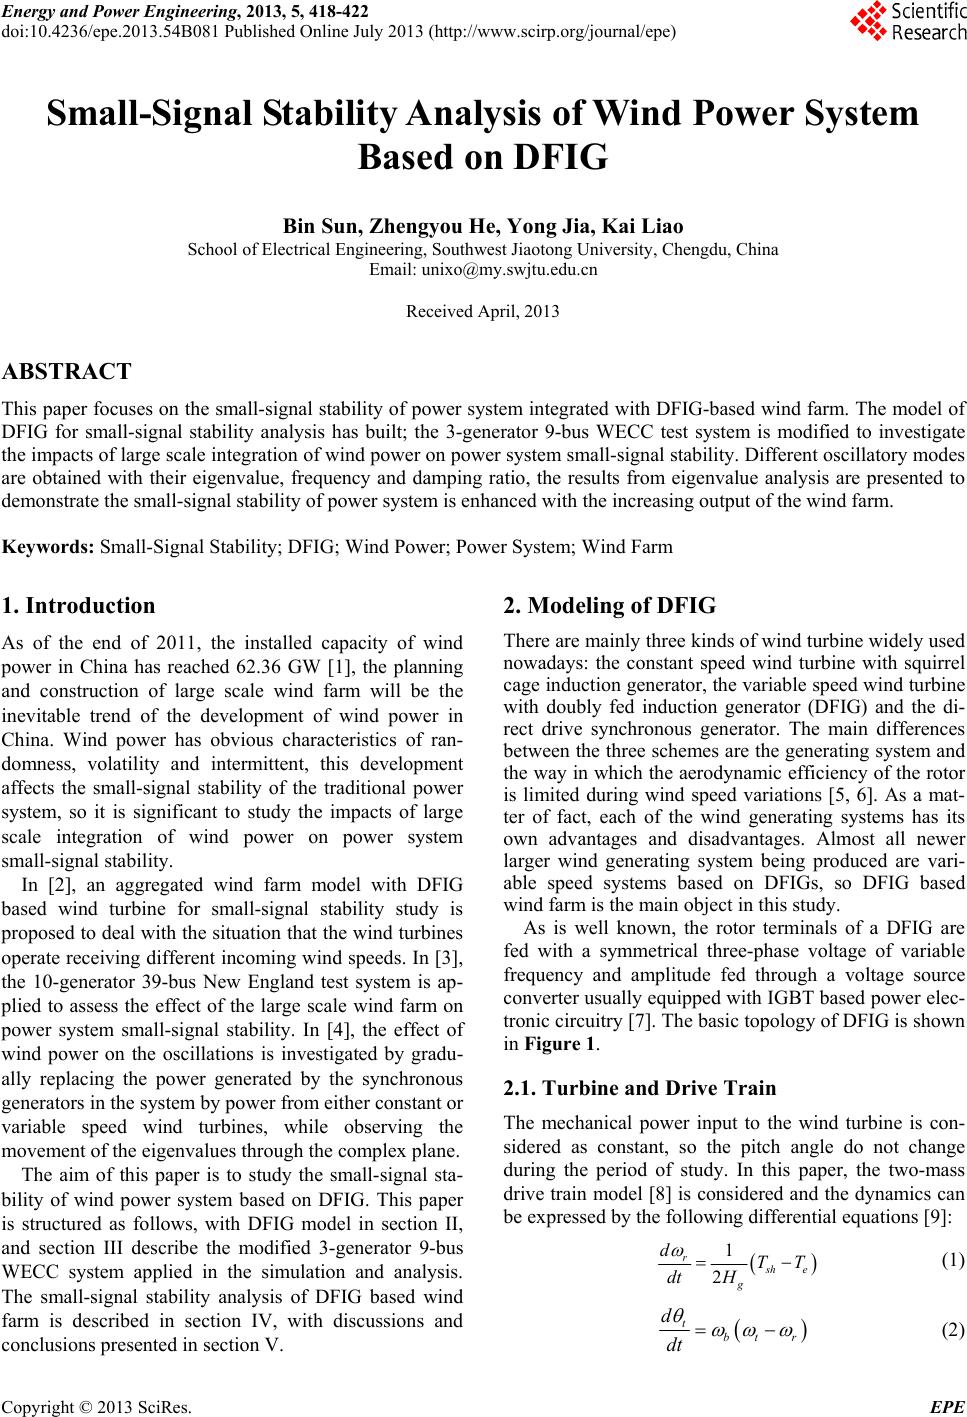
Figure 2. Single line diagram of the analyzed case network.
analysis consists of 50 DFIG-based wind turbines and the
capacity of each turbine is 1.5 MW, so the total capacity
of this wind farm is 75 MW. Here, a single equivalent
model was used to represent all individual units within
the wind power plant in order to avoid increasing com-
putation time, so the modified WECC test system con-
tains 3 synchronous generators and a wind turbine repre-
sented by a DFIG.
The base capacity and frequency of the system are 100
MVA and 50 Hz. The active power and reactive power of
3 loads are adjusted, the active power and reactive power
of bus 5 are 1.200 and 0.075 pu respectively, the active
power and reactive power of bus 6 are 0.700 and 0.070
pu respectively, the active power and reactive power of
bus 8 are 2.250 and 0.350 pu respectively. In order to
ensure the power flow of the system unchanged, the out-
put of synchronous generator G3 should be adjusted at
the same time when increasing the output of wind farm.
The single wind turbine parameters are as follows:
UN=0.69 kV, SN=1.5 MW, f=50 Hz, Rs=0.01 pu, Xs=0.10
pu, Rr=0.01 pu, Xr=0.08 pu, Xm=4 pu, Hm=3 kWs/kVA,
Kp=10, Tp=3 s, Kv=10, TE=0.01s.
4. Small-Signal Stability Analysis
Small-signal stability is the ability of the power system to
maintain synchronism when subjected to small distur-
bances [12]. The disturbance is considered small enough
to permit the equations that describe the resulting re-
sponse of the system to be linearized and expressed in
state-space form. Then, by calculating the eigenvalues of
the linearized model, the small-signal stability character-
istics of the system can be evaluated. In today’s practical
power systems, the small-signal stability problem is usu-
ally on of insufficient damping of system oscillations.
Small-signal stability analysis using linear techniques
provides valuable information about the inherent dy-
namic charateristic of the power system and assists in its
design.
The most direct way to assess small-signal stability of
the model of power system is via eigenvalue analysis.
When the wind farm output is 60% of its total capacity,
i.e., the output of wind farm is 45 MW, at the same time,
adjust the output of G3 to 40 MW in order to keep the
power flow constant. The eigenvalues associated with
this case are given in Table 1. We can get 8 oscillatory
modes, most of their oscillatory frequencies are between
0.1 Hz and 2.5 Hz, so most of them are belong to low-
frequency modes. As a matter of fact, the low-frequency
oscillation is of great harm to the safe and stable opera-
tion of the power system, so these low-frequency oscilla-
tion modes must be suppressed or eliminate by taking
some efficient measures.
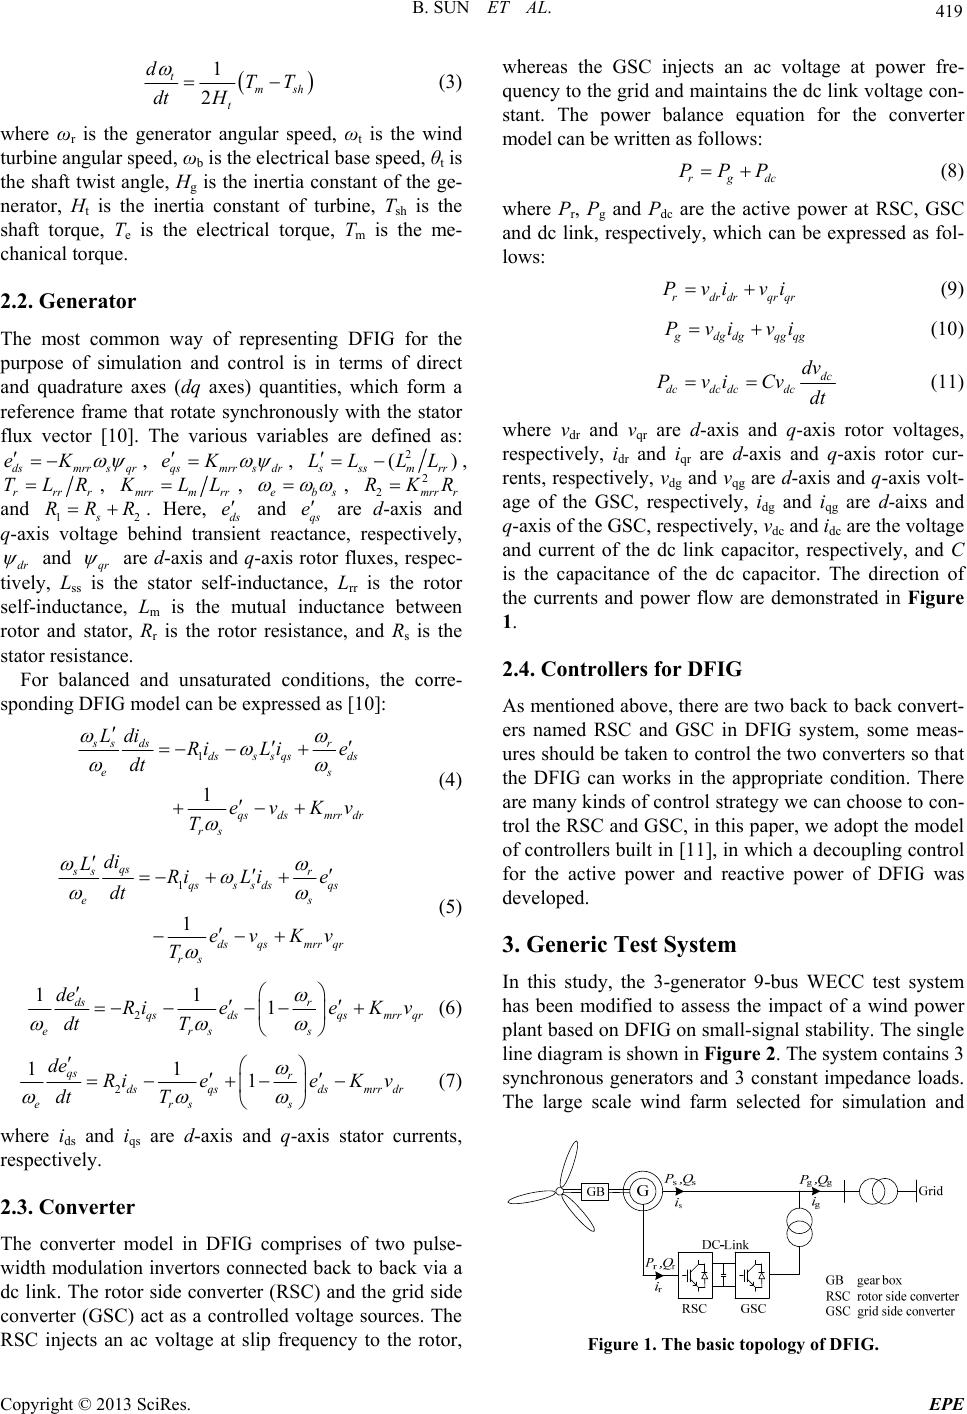
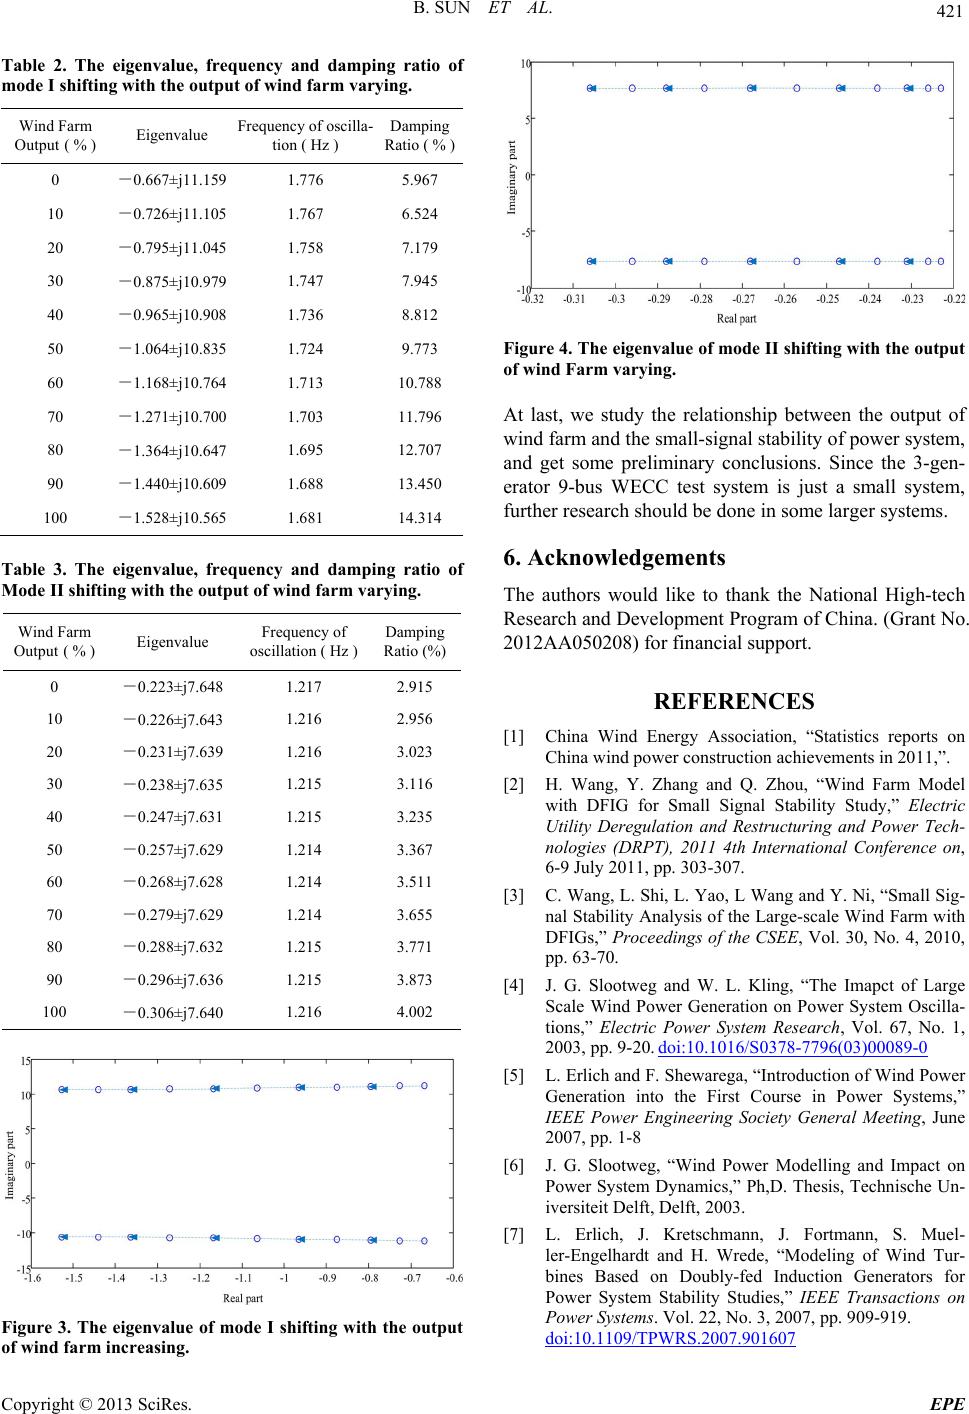
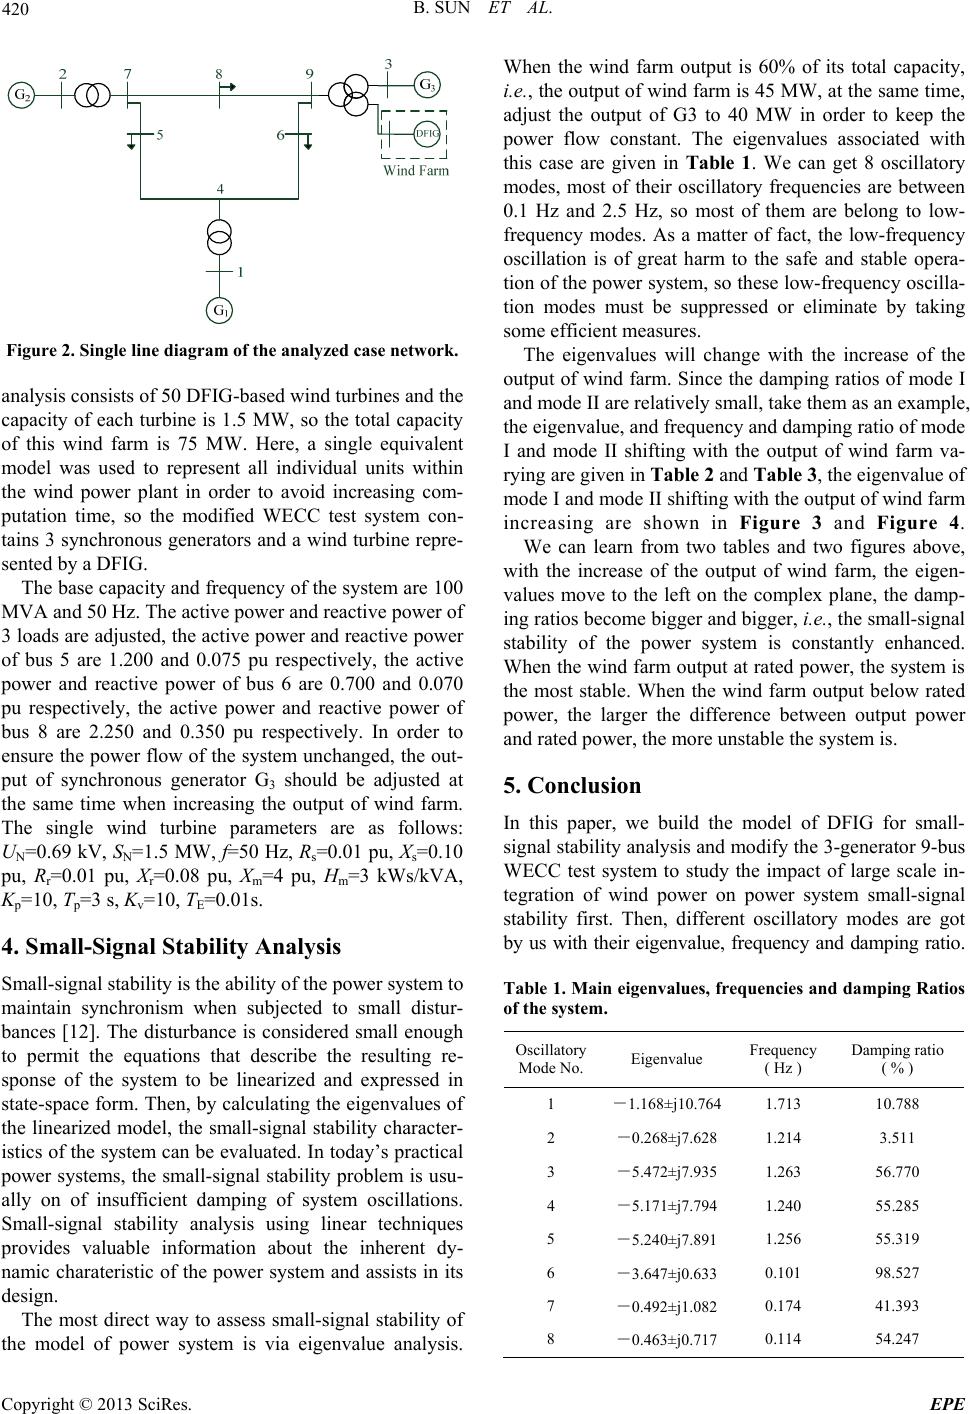
The eigenvalues will change with the increase of the
output of wind farm. Since the damping ratios of mode I
and mode II are relatively small, take them as an example,
the eigenvalue, and frequency and damping ratio of mode
I and mode II shifting with the output of wind farm va-
rying are given in Table 2 and Table 3, the eigenvalue of
mode I and mode II shifting with the output of wind farm
increasing are shown in Figure 3 and Figure 4.
We can learn from two tables and two figures above,
with the increase of the output of wind farm, the eigen-
values move to the left on the complex plane, the damp-
ing ratios become bigger and bigger, i.e., the small-signal
stability of the power system is constantly enhanced.
When the wind far m output at rated power, the system is
the most stable. When the wind farm output below rated
power, the larger the difference between output power
and rated power, the more unstable the system is.
5. Conclusion
In this paper, we build the model of DFIG for small-
signal stability an alysis and modify the 3-generator 9-bus
WECC test system to study the impact of large scale in-
tegration of wind power on power system small-signal
stability first. Then, different oscillatory modes are got
by us with their eigenvalue, frequency and damping ratio.
Table 1. Main eigenvalues, frequenc ies and damping Ratios
of the system.
Oscillatory
Mode No.Eigenvalue Frequency
( Hz ) Damping ratio
( % )
1 -1.168±j10.764 1.713 10.788
2 -0.268±j7.628 1.214 3.511
3 -5.472±j7.935 1.263 56.770
4 -5.171±j7.794 1.240 55.285
5 -5.240±j7.891 1.256 55.319
6 -3.647±j0.633 0.101 98.527
7 -0.492±j1.082 0.174 41.393
8 -0.463±j0.717 0.114 54.247
Copyright © 2013 SciRes. EPE