Paper Menu >>
Journal Menu >>
 iBusiness, 2013, 5, 7-10 doi:10.4236/ib.2013.52B002 Published Online June 2013 (http://www.scirp.org/journal/ib) Copyright © 2013 SciRes. IB 7 Performance Measurement of the Fourth Part y Logi stics Provider s Yu-Wei Chang Department of Air Transportation Management, Aletheia University, Tainan 721. Email: uwchang@mt.au.edu.tw Received April, 2013 ABSTRACT This paper presents a multicriterica decision making method (MCDM) to evaluate the performance of the fourth-party logistics providers. The four indexes of balanced scorecard (BSC) are used as the evaluation indexes. AHP (ana-lytical hierarchy process) is used fo r rating the we ights of criteria and alternatives. MCDM method of SAW (Simple Additive Weighting) is used for ranking the companies. Results show that the approach is applicable for the performance me a- surement problem. Keywords: MCDM; AHP; S AW 1. Introduction To cost down and increase core competence, many com- panies deal with their logistics activities by the third- party logistics provider (3 PL). With the developme nt o f electronic commercial, a new logistics provider which is called the fourth party logistics (4 PL) is more and more popular in Taiwan. The concept of the 4PL is that it integrates the resources, capabilities, and technology of its own organization and other organizations to design, build, and run comprehensive supply chain solutions. The main difference between the 3 PL and 4 PL lies in that firms o wn t heir o wn a sset s in t he 3 P L, a nd th ey per- form more than one or more logistic s service s. However, firms do not own any type of assets in the 4 PL. The 4 PL only arrange the logistics services and serve as an inter- mediar y between the firm and the service provider. With the help of the 4 PL, the companies can manage the 3 PLs, truckers, forwarders, custom house agents, and others, essentially taking responsibility of a complete process for the customer . Many traditional methods nowadays are used for the performance evaluation (i.e. data envelopment analysis, DEA; regression method and ration analysis). The dra w- back of the traditional methods focuses on the financial performance and ignores the non-financial performance. To solve the disadvantages of the above approaches, Kaplan and Norton (1992) proposed the Balanced Scored Card (BSC) concept to evaluate the performance of a company by four perspectives [1]. The four perspectives include financial, customer, internal business pr oc ess and learning and growth. With the help of BSC evaluation, both financial and non-financial performance can be overall measured. Analytic Hierarchy Process (AHP) is a multi-attribute decision making method proposed by Satty in 1971 [2]. It is a widely used method, providing a rational frame- work for solving a complex decision problem. The ma in ideal of the AHP is that it derives ratio scales by pairwis e comparisons of attrubutes. It is a popular method utilized in a multicriteria de c ision making (MCDM) problem. Many methods have been developed for solving the MCDM problems (i.e. Weighting Product, WP; Simple Additive Weighting, SAW; Technique for Order Pre- ference by Similarity to Ideal Solution, TOPSIS) . Each method has its own aim and advantages. For example, the concept of SAW is to obtain a weighted sum of the performance ratings of each alternative over all attributes. The concept of W eighte d P rod uct method is to obtain the performance ratings by multiplying contributions from attributes. The concept of TOPSIS is to obtain the per- formance rating by the concept that the alternative to be chose n sho ul d have t he ne ar e s t d ist anc e fr o m the p o siti ve ideal solution and the farthest distance from the negative ideal solution. This paper presents a hybrid model that combines both AHP and BSC for performance measurement of the fourth-party logistics providers. In the model, the four indexes of BSC will be used as evaluation criteria. AHP is used for the weights of criteria, sub-criteria and alter- natives. Rank of the fourth-party logistics providers is determined by the help of SAW. The advantage of the  Performance Measurement of the Fourth Party Logistics Providers Copyright © 2013 SciRes. IB 8 method is that both final and non-final perspectives are considered for the performance measurement problem of the fourth-party logistics provider at the same time. 2. Methodology 2.1. AHP Analytic Hierarchy process (AHP) is originall y proposed by Saaty in 1971 to deal with complex problems by de- composing a complex problem into a structured decision hierarchy. The first step of AHP is to establish hierar- chial structure and decompose into different levels (i.e. the goal) and each level is further decomposed into sub- levels (i.e. criteria) until the lowest levels of the hierar- chy. After the hierarchial structure of the problem is fin- ished, the next step is to use pairwise comparison to de- te rmin e the priority. T he decision maker uses a nine point scale to assess the priority score. The procedure focuses on two factors at a time and their relation to each other with the scores 1, 3, 5, 7, a nd 9. The score 1 refers to equal importance, 3 refers to slight more importance, 5 refers to strong more importance, 7 refers to very strong importance and 9 denotes extremely more importance. The scores of 2, 4, 6, and 8 are intermediate scores be- tween the two judgments. If there are n attributes and m alternatives, the matrix judgment will lead to an n × m matrix and there are n * m (m − 1)/2 pairwise compari- sons to be performed. The pairwise comparison maxtrix has t he following form: 11 1 12 22 2 12 12 ... ... ... n n nn n n ww w ww w ww w ww w A ww w ww w = (1) where 1 2 w w is the relative importance of the 1-th crite- rion over the 2-th attribute. After the pairwise compari- son matrix is obtained, the we ights need to be calculated. Satty (1977) ustilizes the maximal eigenvalue method to find the va lue vecto r of w. The exact values of w1, w2, …, wn are computed and fi nally normalized as follows: w1 + w2 + … + wn =1 (2) The consistency property of the matrix needs to be checked to ensure the consistency of judgments in the pairwise comparison. Both the consistency index (C.I.) and consistency ratio (C.R.) are defined as follows: max 1 C.I () 1n n λ = − − (3) max λ : The maximal e igenvalue n: The number of items being compared in the matrix The closer the C.I. val ue is to 0, the greater the consis- tency and acceptable. The C.I. value less than 0.1 is ge n- erally acceptable. After checking the consistency index, the consiste ncy ratio is t hen examined. C.R. = .. .. CI RI (4) R.I. = The average consistency index. when C.R. ≤ 0.1, the weights obtained by the eigen- val- ue method are acceptable. 2.2. The Simp le Ad d i tiv e We ightin g (SAW) The SAW method is one of the mo st widely used MADM method [3]. The basic concept of the SAW is to obtain a weighted sum of the performance ratings of each alternative over all attributes. One need to scale the scores, apply weights and sum up the values for each alternative. The SAW method requires normalizing the decision matrix (y) to allow a comparable scale for all ratings in X by , if is a benefit attribute max min , if is a cost attribute 1, 2,,;1, 2,, ij ij i ij ij i ij yj y ryj y i mj n =…=… = (5) where rij (0 ≤ rij ≤ 1) is defined as the normalized per- formance rating of alternative Ai on attribute Cj. This normalization process transforms all the ratings in a pro- portional way, so that the relative order of magnitude of the ratings remains equal. The overall preference value of each alternative (Vi) is obtained by 1 1,2,, ij ij n j Vwr im = == … ∑ (6) The greater the value (Vi), the more preferred the al- ternative (Ai). Rese ar ch r e s ul ts ha ve s hown t hat t he l i near form of trade-offs between attributes used by the SAW method produces extremely close approximations to com- plicated nonlinear forms, while maintaining far easier to use and understand (Hwang and Yoon 1981). 3. Empirical Results To illustrate how the proposed method can be used to evaluate the performance measurement of the fourth- party logistics, an empirical case will be used to explain it. In the case, five decision makers (D1, D2, …, D5) are formulated as a team to evaluate the performance of 6 logistics providers. The DMs decide to evaluate the per- fo rman ce of logistics providers based on BSC. The best 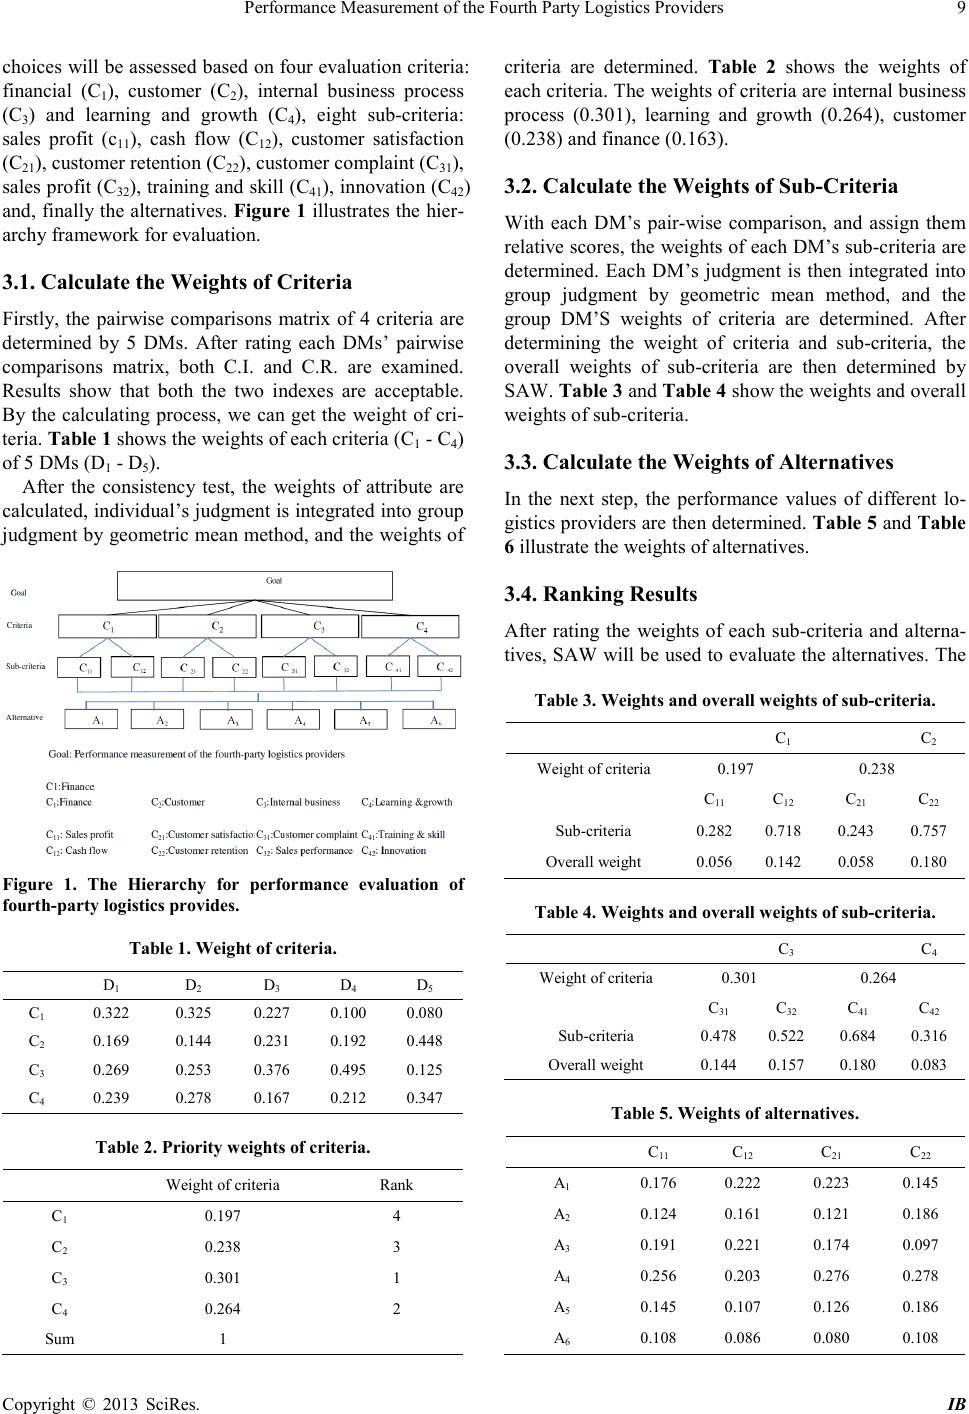 Performance Measurement of the Fourth Party Logistics Providers Copyright © 2013 SciRes. IB 9 choices will be assessed based on four evaluation criteria: financial (C1), customer (C2), internal business process (C3) and learning and growth (C4), eight sub-criteria: sales profit (c11), cash flow (C12), customer satisfaction (C21), customer rete ntion (C22), customer complaint (C31), sales profit (C32), training and skill (C41), in novatio n (C42) and, finally the alternatives. Figure 1 illustrates the hier- archy framework for evaluation. 3.1. Calculate the Weights of Criteria Firstly, the pairwise comparisons matrix of 4 criteria are determined by 5 DMs. After r ating each DMs’ pairwise comparisons matrix, both C.I. and C.R. are examined. Results show that both the two indexes are acceptable. By the calculating process, we can get the weight of cri- teria. Table 1 shows the weights of each criteria (C1 - C4) of 5 DMs (D 1 - D5). After the consistency test, the weights of attribute are calculated, individual’s judgment is integrated into group judgment by geometric mean method, and the weights o f Figure 1. The Hierarchy for performance evaluation of fourth-party logisti cs provides. Table 1. Weight of criteria. D1 D2 D3 D4 D5 C1 0.322 0.325 0.227 0.100 0.080 C2 0.169 0.144 0.231 0.192 0.448 C3 0.269 0.253 0.376 0.495 0.125 C4 0.239 0.278 0.167 0.212 0.347 Table 2. Priority wei ghts of criteri a. Weight of criteria Rank C1 0.197 4 C2 0.238 3 C3 0.301 1 C4 0.264 2 Sum 1 criteria are determined. Table 2 shows the weights of each criteria. The weight s of criteria are inter nal b usi ness process (0.301), learning and growth (0.264), customer (0.238) and finance (0.163). 3.2. Calculate the Weights of Sub-Criteria With each DM’s pair-wise comparison, and assign them relative scores, the weights of each DM’s sub-criteria are determined. Each DM’s j udgment is then integrated into group judgment by geometric mean method, and the group DM’S weig h ts of criteria are determined. After determining the weight of criteria and sub-criteria, the overall weights of sub-criteria are then determined by SAW. Table 3 and Table 4 s ho w the weights and overall weights of sub-criteria. 3.3. Calculate the Weights of Alternatives In the next step, the performance values of different lo- gistics provid ers are then deter mined. Table 5 and Table 6 illustrate the wei ght s of alternatives. 3.4. Ranking Results After rating the weights of each sub-criteria and alterna- tives, SAW will be used to evaluate the alternatives. T he Table 3. We ights and ov erall weights o f sub-criteria. C1 C2 Weight of criteria 0.197 0.238 C11 C12 C21 C22 Sub-criteria 0.282 0.718 0.243 0.757 Overal l wei gh t 0.056 0.142 0.058 0.180 Table 4. Weights and o v erall weights of su b-criteria. C3 C4 Weight of criteria 0.301 0.264 C31 C32 C41 C42 Sub-criteria 0.478 0.522 0.684 0.316 Overal l wei gh t 0.144 0.157 0.180 0.083 Table 5. Weights o f alternatives. C11 C12 C21 C22 A1 0.176 0.222 0.223 0.145 A2 0.124 0.161 0.121 0.186 A3 0.191 0.221 0.174 0.097 A4 0.256 0.203 0.276 0.278 A5 0.145 0.107 0.126 0.186 A6 0.108 0.086 0.080 0.108  Performance Measurement of the Fourth Party Logistics Providers Copyright © 2013 SciRes. IB 10 Table 6. Weights of alternat ives. C31 C32 C41 C42 A1 0.169 0.193 0.164 0.196 A2 0.121 0.208 0.141 0.224 A3 0.288 0.220 0.194 0.172 A4 0.259 0.206 0.264 0.184 A5 0.090 0.091 0.149 0.131 A6 0.074 0.081 0.088 0.093 final score for each alternative is as follows, 1 A0.056*0.176 0.142*0.222 0.058*0.223 0.180*0.145 0.144*0.169 0.157*0.193 0.180*0.1640.083 *0.196 0.181 =++ +++ ++= 2 A0.056*0.1240.142*0.161 0.058*0.121 0.180*0.1860.144*0.121 0.157*0.208 0.180*0.1410.083 *0.224 0.073 = ++ +++ ++= 3 A0.056*0.191 0.142*0.221 0.058*0.174 0.180*0.0970.144*0.288 0.157*0.220 0.180*0.1940.083 *0.172 0.069 =++ +++ ++= 4 A0.056*0.256 0.142*0.203 0.058*0.276 0.180*0.278 0.144*0.259 0.157*0.206 0.180*0.264 0.083*0.1860.184 =++ +++ ++= 5 A0.056*0.145 0.142*0.107 0.058*0.126 0.180*0.186 0.144*0.090 0.157*0.091 0.180*0.149 0.083*0.1310.131 =++ +++ ++= 6 A0.056*0.1080.142*0.086 0.058*0.080 0.180*0.1080.144*0.074 0.157*0.081 0.180*0.088 0.083*0.0930.093 =++ +++ ++= Based on the results of S AW, we can conclude that the ranki ng o rd er o f six c o mpanie s is A4, A1, A5, A6, A2, and A3. In the case, the A4 is the best one. 4. Conclusions This paper proposes an effective method that combines both the AHP and SAW for the performance measure- ment of the fourth party logistics provider. In the evalu- ate context, t he AHP is utilized to rate the weight of cri- teria, sub-criteria and alternatives. The SAW is used to rank the performance order. We can observe that the ranking of the six logistic providers is A4(0.184) > A1(0.181) > A5(0.131) > A6(0 . 093) > A2(0.073) > A3(0.069). Results show that the proposed model is comprehensible for the problem. Future research can use this model for evaluatio n of other ind ustries. REFERENCES [1] R. S . Kap lan and D. P. Norton, “The Balanced Scorecard: Measures the Drive Performance, In Harvard Business School,” Harvard Business Review on Measuring Corpo- rate Performance, Boston, MA: Harvard Business School Press, 19 92. [2] T. L. Saat y, “The Anal ytic Hiera rchy Process, ” NY: New York,” McGraw-Hill, 1980. [3] K. P. Yoon and C. L. Hwang, “Multiple attribute decision making: An introduction,” Sage publication, 1995. |