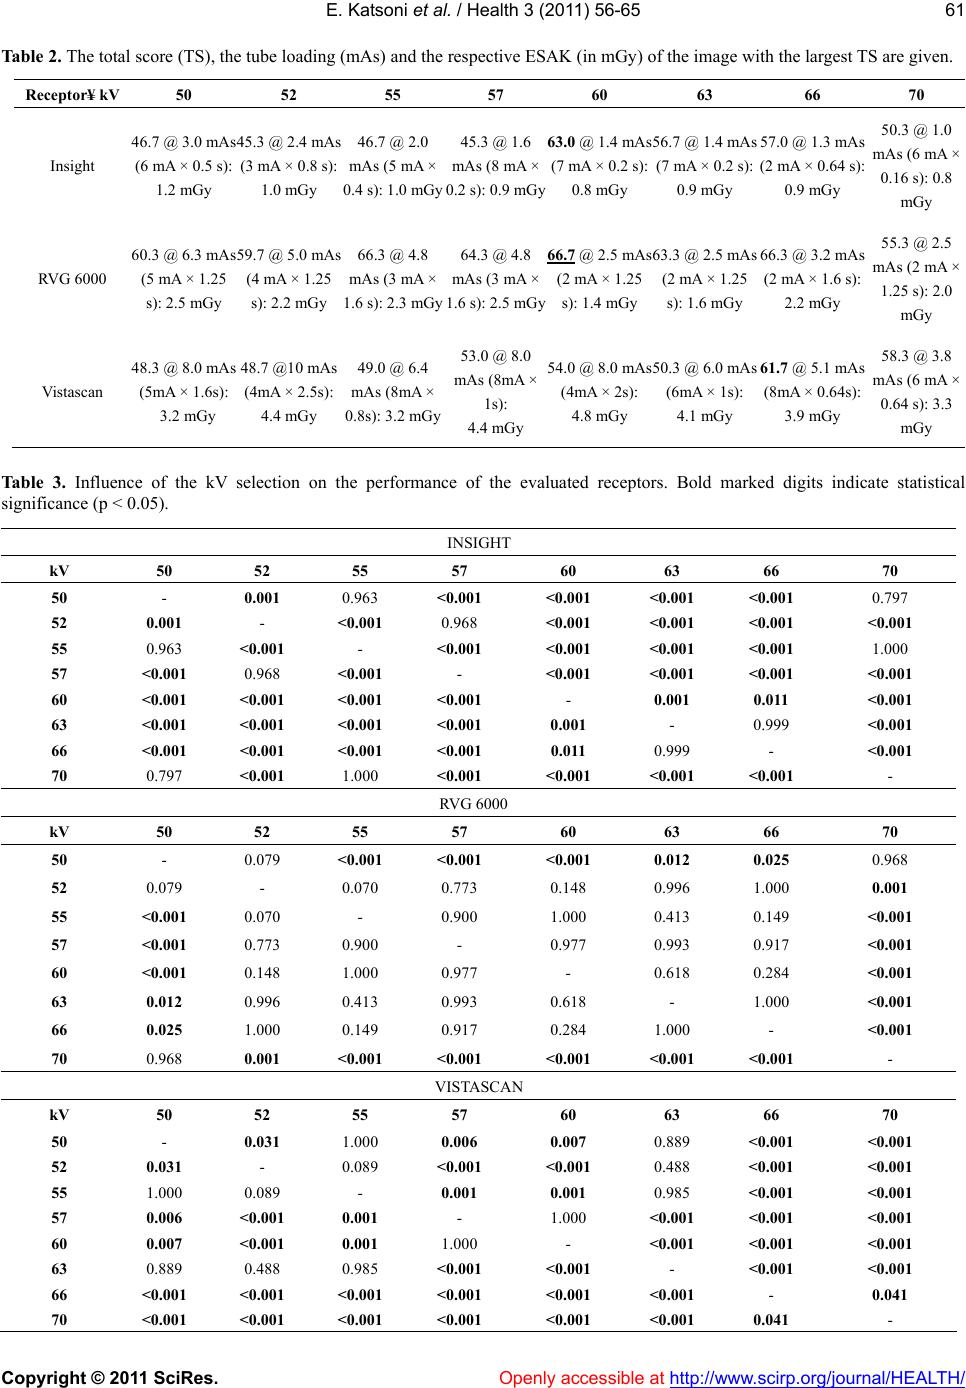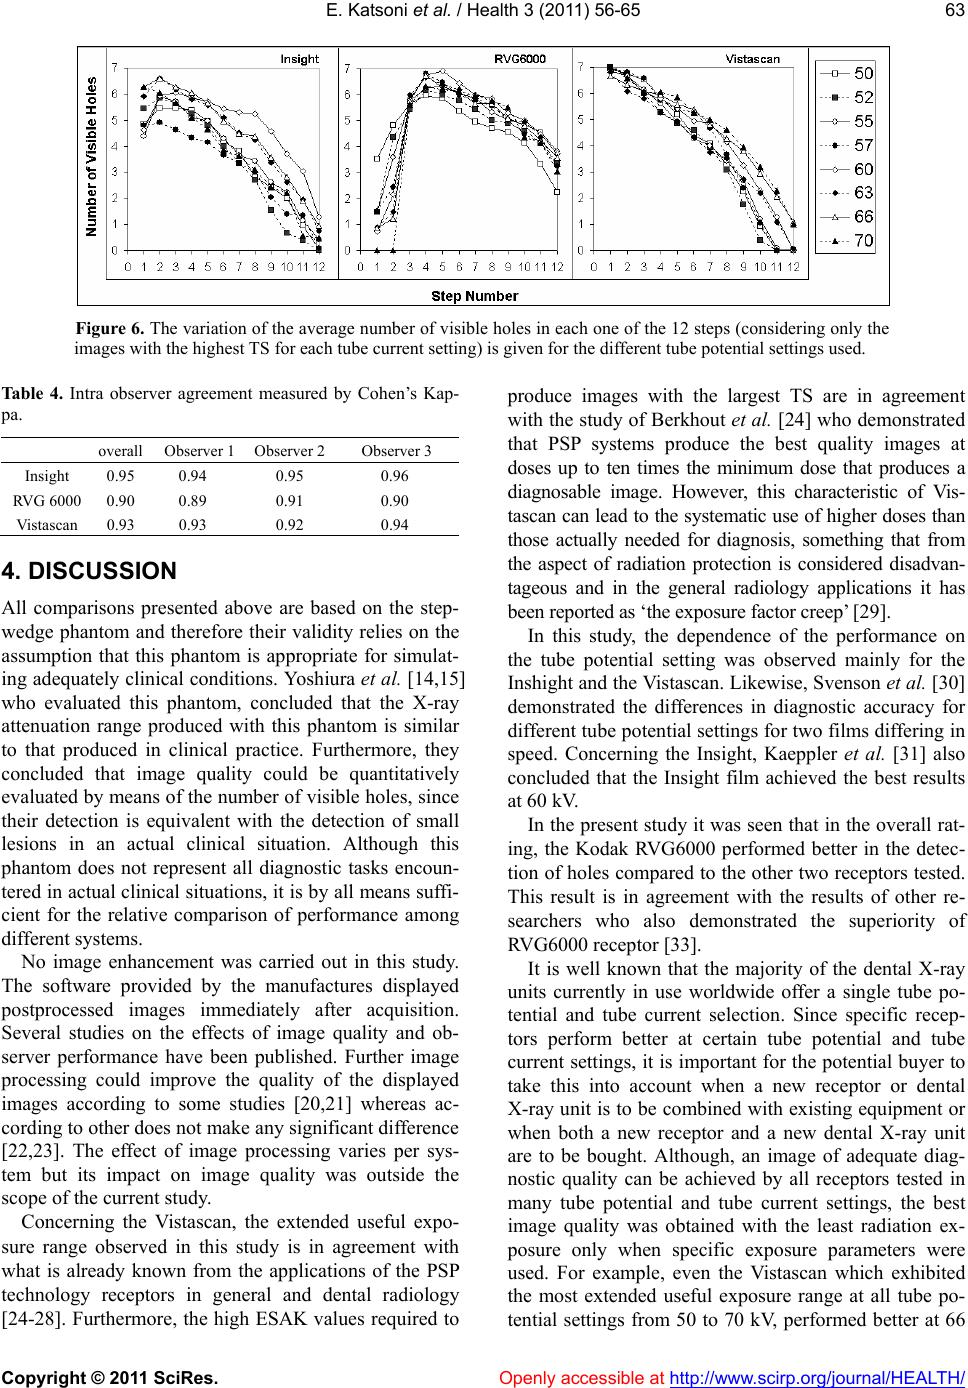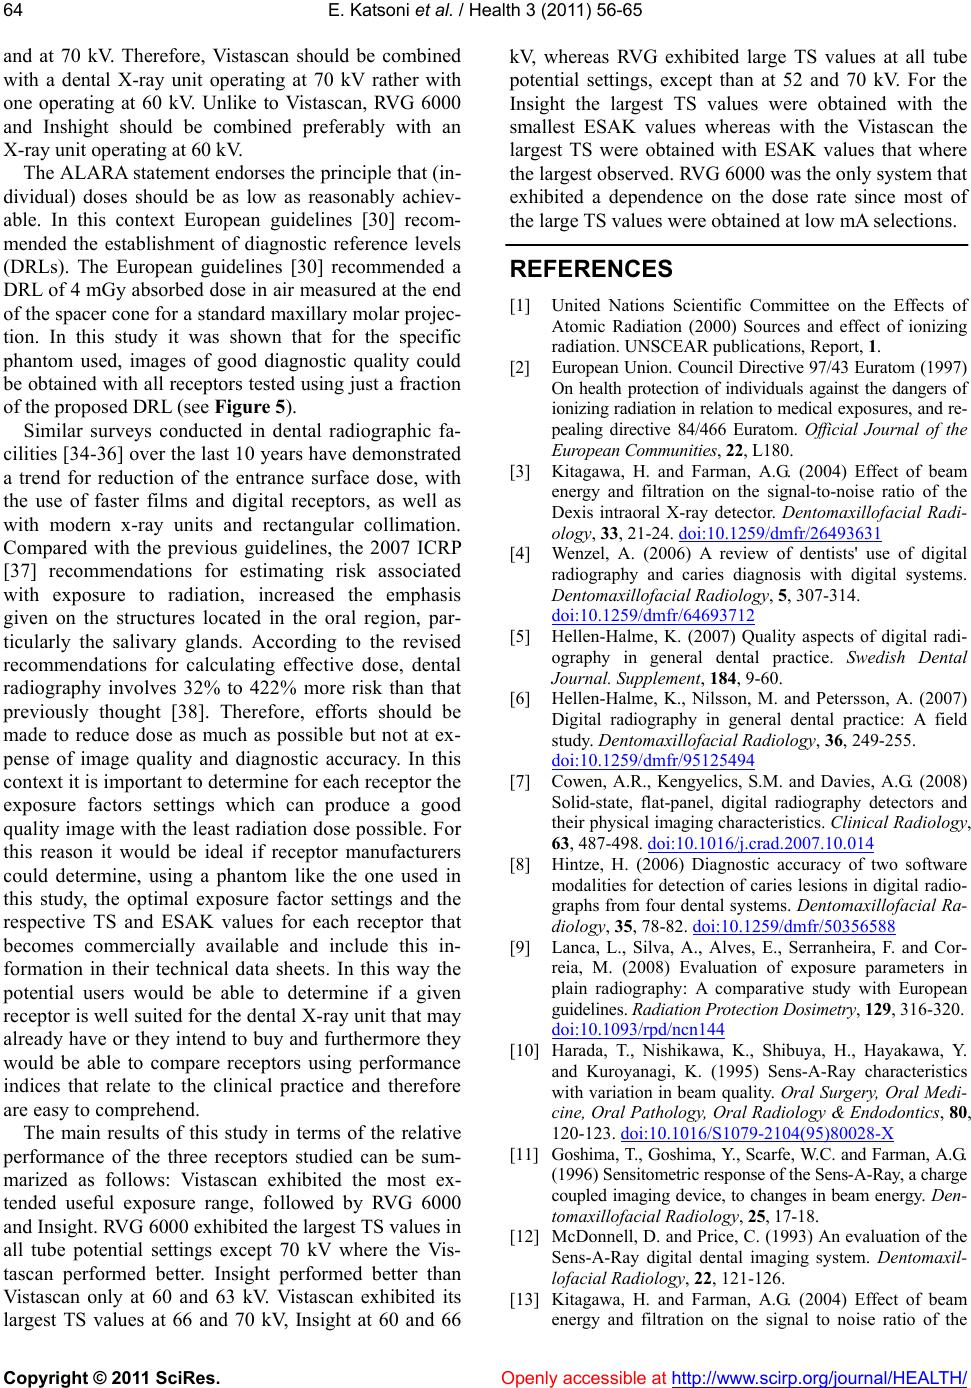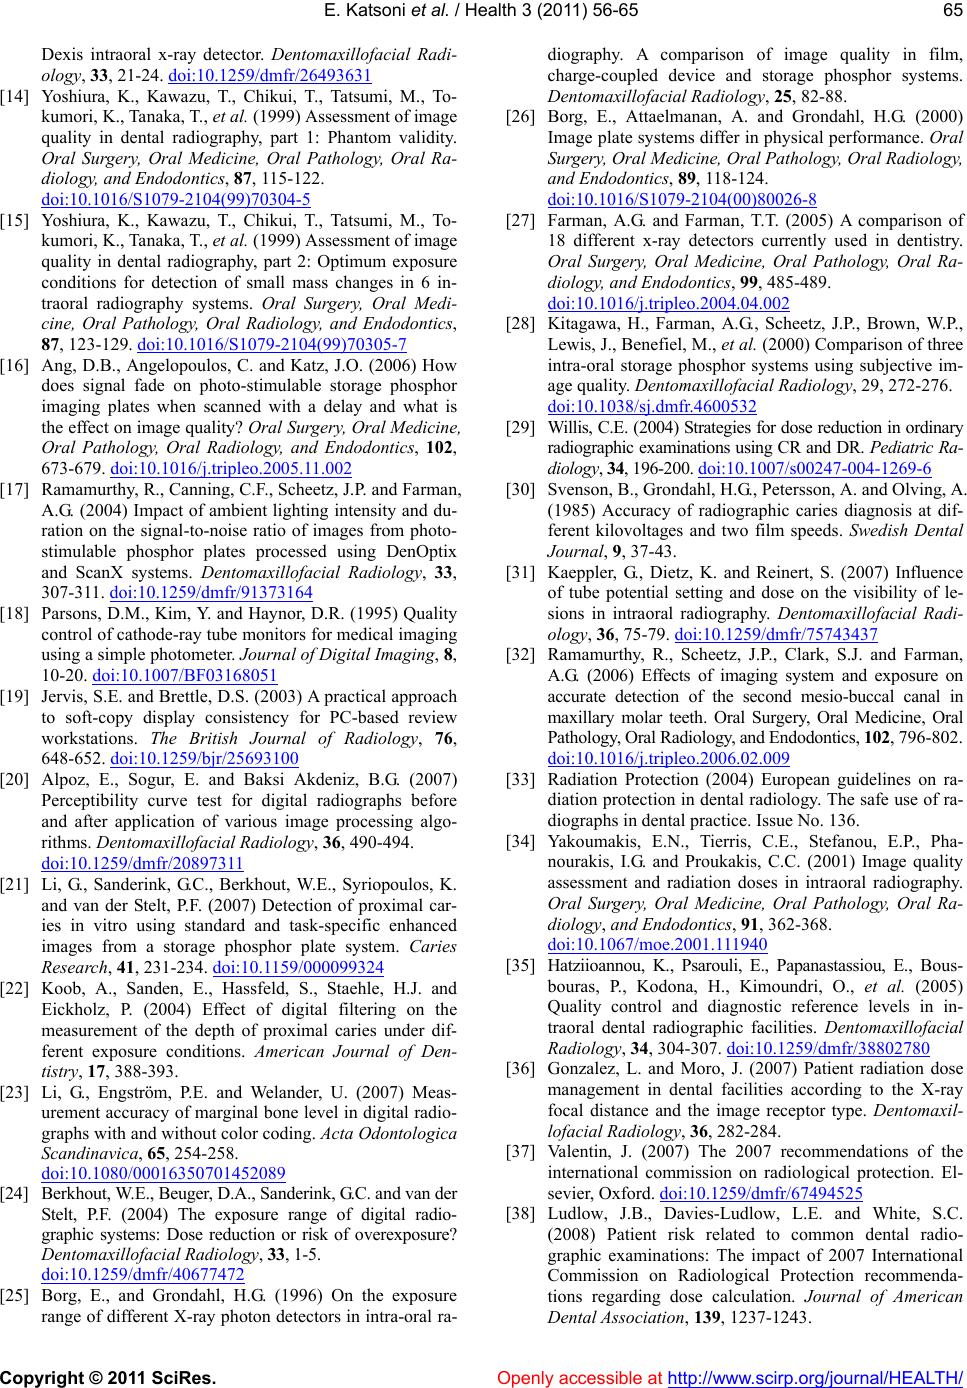
E. Katsoni et al. / Health 3 (2011) 56-65
Copyright © 2011 SciRes. http://www.scirp.org/journal/HEALTH/Openly accessible at
65
Dexis intraoral x-ray detector. Dentomaxillofacial Radi-
ology, 33, 21-24. doi:10.1259/dmfr/26493631
[14] Yoshiura, K., Kawazu, T., Chikui, T., Tatsumi, M., To-
kumori, K., Tanaka, T., et al. (1999) Assessment of image
quality in dental radiography, part 1: Phantom validity.
Oral Surgery, Oral Medicine, Oral Pathology, Oral Ra-
diology, and Endodontics, 87, 115-122.
doi:10.1016/S1079-2104(99)70304-5
[15] Yoshiura, K., Kawazu, T., Chikui, T., Tatsumi, M., To-
kumori, K., Tanaka, T., et al. (1999) Assessment of image
quality in dental radiography, part 2: Optimum exposure
conditions for detection of small mass changes in 6 in-
traoral radiography systems. Oral Surgery, Oral Medi-
cine, Oral Pathology, Oral Radiology, and Endodontics,
87, 123-129. doi:10.1016/S1079-2104(99)70305-7
[16] Ang, D.B., Angelopoulos, C. and Katz, J.O. (2006) How
does signal fade on photo-stimulable storage phosphor
imaging plates when scanned with a delay and what is
the effect on image quality? Oral Surgery, Oral Medicine,
Oral Pathology, Oral Radiology, and Endodontics, 102,
673-679. doi:10.1016/j.tripleo.2005.11.002
[17] Ramamurthy, R., Canning, C.F., Scheetz, J.P. and Farman,
A.G. (2004) Impact of ambient lighting intensity and du-
ration on the signal-to-noise ratio of images from photo-
stimulable phosphor plates processed using DenOptix
and ScanX systems. Dentomaxillofacial Radiology, 33,
307-311. doi:10.1259/dmfr/91373164
[18] Parsons, D.M., Kim, Y. and Haynor, D.R. (1995) Quality
control of cathode-ray tube monitors for medical imaging
using a simple photometer. Journal of Digital Imaging, 8,
10-20. doi:10.1007/BF03168051
[19] Jervis, S.E. and Brettle, D.S. (2003) A practical approach
to soft-copy display consistency for PC-based review
workstations. The British Journal of Radiology, 76,
648-652. doi:10.1259/bjr/25693100
[20] Alpoz, E., Sogur, E. and Baksi Akdeniz, B.G. (2007)
Perceptibility curve test for digital radiographs before
and after application of various image processing algo-
rithms. Dentomaxil lofacial Radiology, 36, 490-494.
doi:10.1259/dmfr/20897311
[21] Li, G., Sanderink, G.C., Berkhout, W.E., Syriopoulos, K.
and van der Stelt, P.F. (2007) Detection of proximal car-
ies in vitro using standard and task-specific enhanced
images from a storage phosphor plate system. Caries
Research, 41, 231-234. doi:10.1159/000099324
[22] Koob, A., Sanden, E., Hassfeld, S., Staehle, H.J. and
Eickholz, P. (2004) Effect of digital filtering on the
measurement of the depth of proximal caries under dif-
ferent exposure conditions. American Journal of Den-
tistry, 17, 388-393.
[23] Li, G., Engström, P.E. and Welander, U. (2007) Meas-
urement accuracy of marginal bone level in digital radio-
graphs with and without color coding. Acta Odontologica
Scandinavica, 65, 254-258.
doi:10.1080/00016350701452089
[24] Berkhout, W.E., Beuger, D.A., Sanderink, G.C. and van der
Stelt, P.F. (2004) The exposure range of digital radio-
graphic systems: Dose reduction or risk of overexposure?
Dentomaxillofacial Radiology, 33, 1-5.
doi:10.1259/dmfr/40677472
[25] Borg, E., and Grondahl, H.G. (1996) On the exposure
range of different X-ray photon detectors in intra-oral ra-
diography. A comparison of image quality in film,
charge-coupled device and storage phosphor systems.
Dentomaxillofacial Radiology, 25, 82-88.
[26] Borg, E., Attaelmanan, A. and Grondahl, H.G. (2000)
Image plate systems differ in physical performance. Oral
Surgery, Oral Medicine, Oral Pathology, Oral Radiology,
and Endodontics, 89, 118-124.
doi:10.1016/S1079-2104(00)80026-8
[27] Farman, A.G. and Farman, T.T. (2005) A comparison of
18 different x-ray detectors currently used in dentistry.
Oral Surgery, Oral Medicine, Oral Pathology, Oral Ra-
diology, and Endodontics, 99, 485-489.
doi:10.1016/j.tripleo.2004.04.002
[28] Kitagawa, H., Farman, A.G., Scheetz, J.P., Brown, W.P.,
Lewis, J., Benefiel, M., et al. (2000) Comparison of three
intra-oral storage phosphor systems using subjective im-
age quality. Dentomaxillofacial Radiology, 29, 272-276.
doi:10.1038/sj.dmfr.4600532
[29] Willis, C.E. (2004) Strategies for dose reduction in ordinary
radiographic examinations using CR and DR. Pediat ric Ra-
diolog y, 34, 196-200. doi:10.1007/s00247-004-1269-6
[30] Svenson, B., Grondahl, H.G., Petersson, A. and Olving, A.
(1985) Accuracy of radiographic caries diagnosis at dif-
ferent kilovoltages and two film speeds. Swedish Dental
Journal, 9, 37-43.
[31] Kaeppler, G., Dietz, K. and Reinert, S. (2007) Influence
of tube potential setting and dose on the visibility of le-
sions in intraoral radiography. Dentomaxillofacial Radi-
ology, 36, 75-79. doi:10.1259/dmfr/75743437
[32] Ramamurthy, R., Scheetz, J.P., Clark, S.J. and Farman,
A.G. (2006) Effects of imaging system and exposure on
accurate detection of the second mesio-buccal canal in
maxillary molar teeth. Oral Surgery, Oral Medicine, Oral
Pathology, Oral Radiology, and Endodontics, 102, 796-802.
doi:10.1016/j.tripleo.2006.02.009
[33] Radiation Protection (2004) European guidelines on ra-
diation protection in dental radiology. The safe use of ra-
diographs in dental practice. Issue No. 136.
[34] Yakoumakis, E.N., Tierris, C.E., Stefanou, E.P., Pha-
nourakis, I.G. and Proukakis, C.C. (2001) Image quality
assessment and radiation doses in intraoral radiography.
Oral Surgery, Oral Medicine, Oral Pathology, Oral Ra-
diology, and Endodontics, 91, 362-368.
doi:10.1067/moe.2001.111940
[35] Hatziioannou, K., Psarouli, E., Papanastassiou, E., Bous-
bouras, P., Kodona, H., Kimoundri, O., et al. (2005)
Quality control and diagnostic reference levels in in-
traoral dental radiographic facilities. Dentomaxillofacial
Radiology, 34, 304-307. doi:10.1259/dmfr/38802780
[36] Gonzalez, L. and Moro, J. (2007) Patient radiation dose
management in dental facilities according to the X-ray
focal distance and the image receptor type. Dentomaxil-
lofacial Radiology, 36, 282-284.
[37] Valentin, J. (2007) The 2007 recommendations of the
international commission on radiological protection. El-
sevier, Oxford. doi:10.1259/dmfr/67494525
[38] Ludlow, J.B., Davies-Ludlow, L.E. and White, S.C.
(2008) Patient risk related to common dental radio-
graphic examinations: The impact of 2007 International
Commission on Radiological Protection recommenda-
tions regarding dose calculation. Journal of American
Dental Association, 139, 1237-1243.