Open Journal of Applied Sciences, 2013, 3, 35-40
doi:10.4236/ojapps.2013.32B007 Published Online June 2013 (http://www.scirp.org/journal/ojapps)
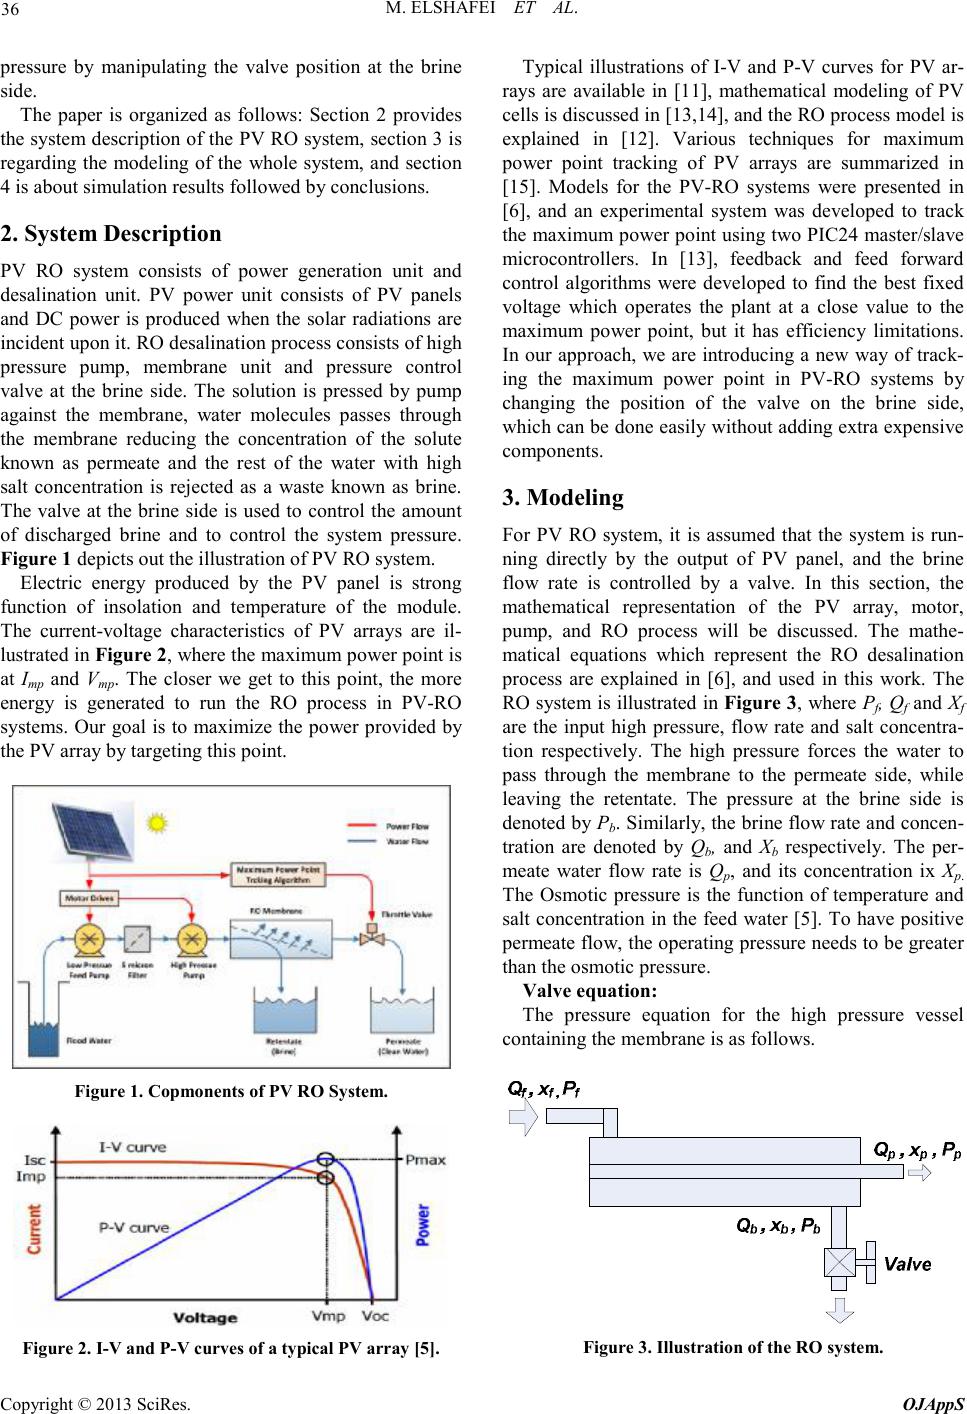
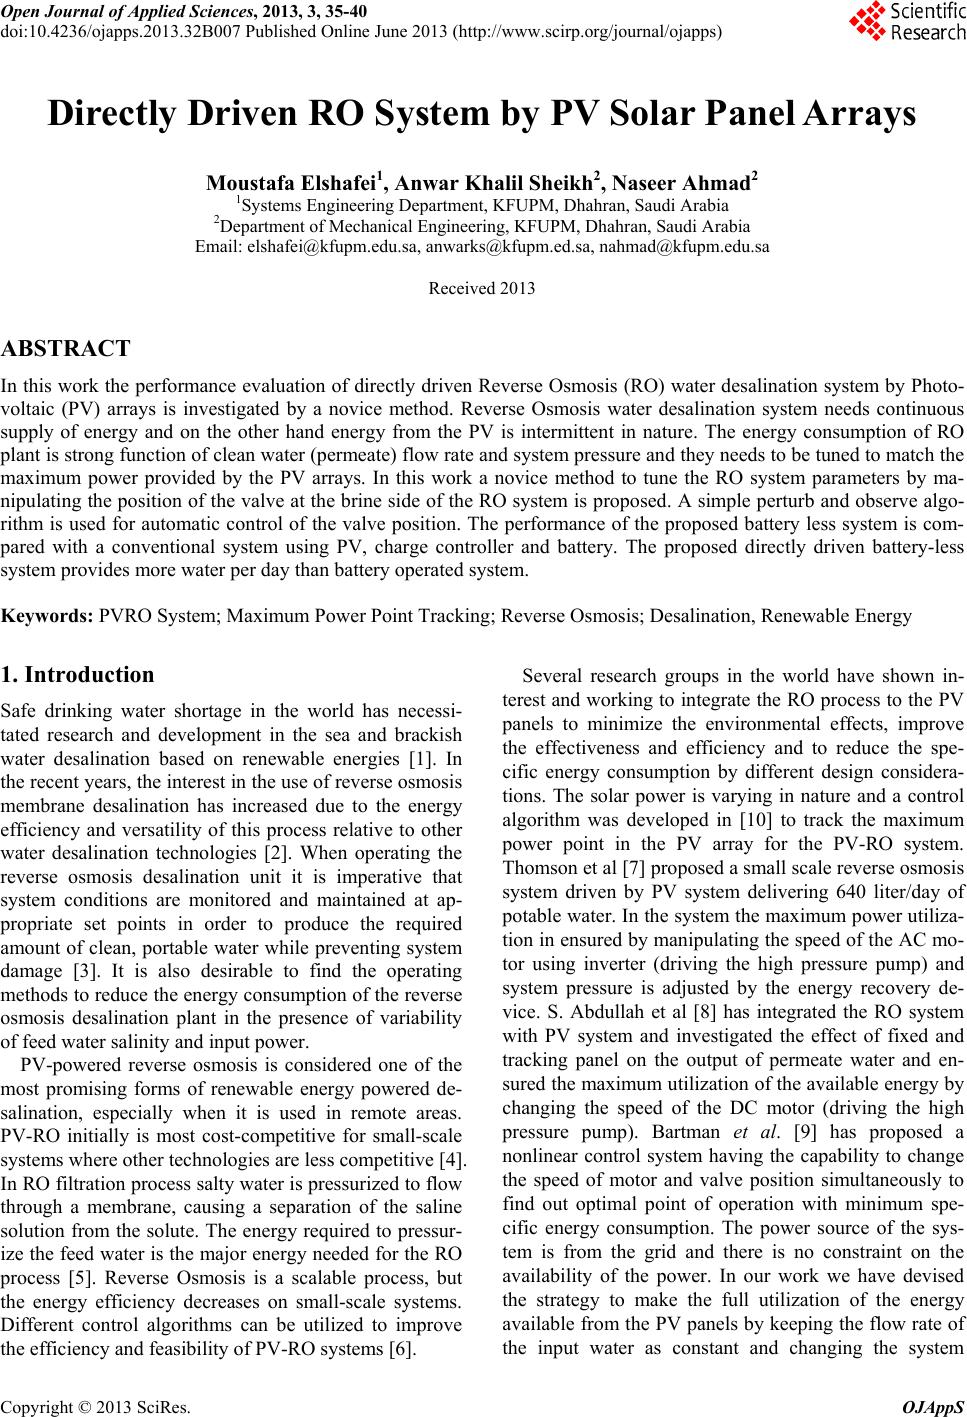
Directly Driven RO System by PV Solar Panel Arrays
Moustafa Elshafei1, Anwar Khalil Sheikh2, Naseer Ahmad2
1Systems Engineering Department, KFUPM, Dhahran, Saudi Arabia
2Department of Mechanical Engineering, KFUPM, Dhahran, Saudi Arabia
Email: elshafei@kfupm.edu.sa, anwarks@kfupm.ed.sa, nahmad@kfupm.edu.sa
Received 2013
ABSTRACT
In this work the performance evaluation of directly driven Reverse Osmosis (RO) water desalination system by Photo-
voltaic (PV) arrays is investigated by a novice method. Reverse Osmosis water desalination system needs continuous
supply of energy and on the other hand energy from the PV is intermittent in nature. The energy consumption of RO
plant is strong function of clean water (permeate) flow rate and system pressure and they needs to be tuned to match the
maximum power provided by the PV arrays. In this work a novice method to tune the RO system parameters by ma-
nipulating the position of the valve at the brine side of the RO system is proposed. A simple perturb and observe algo-
rithm is used for automatic control of the valve position. The performance of the proposed battery less system is com-
pared with a conventional system using PV, charge controller and battery. The proposed directly driven battery-less
system provides more water per day than battery operated system.
Keywords: PVRO System; Maximum Power Point Tracking; Reverse Osmosis; Desalination, Renewable Energy
1. Introduction
Safe drinking water shortage in the world has necessi-
tated research and development in the sea and brackish
water desalination based on renewable energies [1]. In
the recent years, the interest in the use of reverse osmosis
membrane desalination has increased due to the energy
efficiency and versatility of this process relative to other
water desalination technologies [2]. When operating the
reverse osmosis desalination unit it is imperative that
system conditions are monitored and maintained at ap-
propriate set points in order to produce the required
amount of clean, portable water while preventing system
damage [3]. It is also desirable to find the operating
methods to reduce the energy consumption of the reverse
osmosis desalination plant in the presence of variability
of feed water salinity and input power.
PV-powered reverse osmosis is considered one of the
most promising forms of renewable energy powered de-
salination, especially when it is used in remote areas.
PV-RO initially is most cost-competitive for small-scale
systems where other technologies are less competitive [4].
In RO filtration process salty water is pressurized to flow
through a membrane, causing a separation of the saline
solution from the solute. The energy required to pressur-
ize the feed water is the major energy needed for the RO
process [5]. Reverse Osmosis is a scalable process, but
the energy efficiency decreases on small-scale systems.
Different control algorithms can be utilized to improve
the efficiency and feasibility of PV-RO systems [6].
Several research groups in the world have shown in-
terest and working to integrate the RO process to the PV
panels to minimize the environmental effects, improve
the effectiveness and efficiency and to reduce the spe-
cific energy consumption by different design considera-
tions. The solar power is varying in nature and a control
algorithm was developed in [10] to track the maximum
power point in the PV array for the PV-RO system.
Thomson et al [7] proposed a small scale reverse osmosis
system driven by PV system delivering 640 liter/day of
potable water. In the system the maximum power utiliza-
tion in ensured by manipulating the speed of the AC mo-
tor using inverter (driving the high pressure pump) and
system pressure is adjusted by the energy recovery de-
vice. S. Abdullah et al [8] has integrated the RO system
with PV system and investigated the effect of fixed and
tracking panel on the output of permeate water and en-
sured the maximum utilization of the available energy by
changing the speed of the DC motor (driving the high
pressure pump). Bartman et al. [9] has proposed a
nonlinear control system having the capability to change
the speed of motor and valve position simultaneously to
find out optimal point of operation with minimum spe-
cific energy consumption. The power source of the sys-
tem is from the grid and there is no constraint on the
availability of the power. In our work we have devised
the strategy to make the full utilization of the energy
available from the PV panels by keeping the flow rate of
the input water as constant and changing the system
Copyright © 2013 SciRes. OJAppS
M. ELSHAFEI ET AL.
Copyright © 2013 SciRes. OJAppS
36
pressure by manipulating the valve position at the brine
side.
The paper is organized as follows: Section 2 provides
the system description of the PV RO system, section 3 is
regarding the modeling of the whole system, and section
4 is about simulation results followed by conclusions.
2. System Description
PV RO system consists of power generation unit and
desalination unit. PV power unit consists of PV panels
and DC power is produced when the solar radiations are
incident upon it. RO desalination process consists of high
pressure pump, membrane unit and pressure control
valve at the brine side. The solution is pressed by pump
against the membrane, water molecules passes through
the membrane reducing the concentration of the solute
known as permeate and the rest of the water with high
salt concentration is rejected as a waste known as brine.
The valve at the brine side is used to control the amount
of discharged brine and to control the system pressure.
Figure 1 depicts out the illustration of PV RO system.
Electric energy produced by the PV panel is strong
function of insolation and temperature of the module.
The current-voltage characteristics of PV arrays are il-
lustrated in Figure 2, where the maximum power point is
at Imp and Vmp. The closer we get to this point, the more
energy is generated to run the RO process in PV-RO
systems. Our goal is to maximize the power provided by
the PV array by targeting this point.
Figure 1. Copmonents of PV RO System.
Figure 2. I-V and P-V curves of a typical PV array [5].
Typical illustrations of I-V and P-V curves for PV ar-
rays are available in [11], mathematical modeling of PV
cells is discussed in [13,14], and the RO process model is
explained in [12]. Various techniques for maximum
power point tracking of PV arrays are summarized in
[15]. Models for the PV-RO systems were presented in
[6], and an experimental system was developed to track
the maximum power point using two PIC24 master/slave
microcontrollers. In [13], feedback and feed forward
control algorithms were developed to find the best fixed
voltage which operates the plant at a close value to the
maximum power point, but it has efficiency limitations.
In our approach, we are introducing a new way of track-
ing the maximum power point in PV-RO systems by
changing the position of the valve on the brine side,
which can be done easily without adding extra expensive
components.
3. Modeling
For PV RO system, it is assumed that the system is run-
ning directly by the output of PV panel, and the brine
flow rate is controlled by a valve. In this section, the
mathematical representation of the PV array, motor,
pump, and RO process will be discussed. The mathe-
matical equations which represent the RO desalination
process are explained in [6], and used in this work. The
RO system is illustrated in Figure 3, where Pf, Qf and Xf
are the input high pressure, flow rate and salt concentra-
tion respectively. The high pressure forces the water to
pass through the membrane to the permeate side, while
leaving the retentate. The pressure at the brine side is
denoted by Pb. Similarly, the brine flow rate and concen-
tration are denoted by Qb, and Xb respectively. The per-
meate water flow rate is Qp, and its concentration ix Xp.
The Osmotic pressure is the function of temperature and
salt concentration in the feed water [5]. To have positive
permeate flow, the operating pressure needs to be greater
than the osmotic pressure.
Valve equation:
The pressure equation for the high pressure vessel
containing the membrane is as follows.
Figure 3. Illustration of the RO system.
M. ELSHAFEI ET AL.
Copyright © 2013 SciRes. OJAppS
37
bfPm
PPD
=− (1)
where DPm is pressure drop along the membrane. The
brine discharge rate through the valve is given by
()
bvbatm
QKuPP=− (2)
where u is the valve opening on a scale from 0 to 1, Kv is
the valve flow coefficient, and Patm is the atmospheric
pressure.
Membrane Modeling:
The membrane mass balance equation is given by
ffbbpp
QQQ
ρρρ=+ (3)
Neglecting the change in density, equation (3) be-
comes simple
fbp
QQQ
=+ (4)
Salt balance equation
ffbbpp
=+ (5)
From (4) and (5)
bf
pb
fp
XX
QQ
XX
= (6)
Membrane water permeability
()
pwm
QPKA
π=−∆ (7)
where; 0.5()
0.5()
0.5()
and 75.85*(/300)Pa/ppm
fbp
fbp
fbp
PPPP
XXX
T
ππππ
ααα
α
=+−
=+−
=+−
=
Substituting (6) in (7), we get
()(2)
2
()
2
fpwmfpbf
b
bfpwm
XXKAPXXQX
X
QXXKA
α
α

−−+


=

+−


(8)
The membrane salt permeability is given by
()
pppSm
QXXXKA
=− (9)
where Am is the area of the membrane, and
ffpp
pf
QXQX
XQQ
+
=+ (10)
Then from (5), we can write (10) as
2
2
bbpp
pb
QXQX
XQQ
+
=+ (11)
Equation (9) can now be written as
()0
ppppSm
fXQXXXKA

=−=
 (12)
Equation (12) may be solved for X
p
using bisection
method in the interval [0, 0.95Xf], Where Qp
is substi-
tuted by Equation (6), and Xb by Equation (8). Next, Xb
can be found from (8), Qp from (5), and Qf from (3).
Motor:
The following relation represents the torque of the
motor when its resistance is constant:
0
m
t
II
TK
= (13)
where T is the torque in newton-meter, I and Im0 are the
motor current and the current related to the friction, re-
spectively, and Kt is the torque constant in A/Nm. The
motor angular velocity is represented as follows:
()
mom
VRK
ω=− (14)
where
ω
is the angular velocity, V is the motor voltage,
Rmo is the resistance of the motor in ohms, and Km is the
motor speed constant in rev/Vs.
Pump:
The feed water volumetric flow in the following rela-
tion is the output of the pump, which is related to the
angular velocity of the motor.
2
f
D
Q
ω
π
= (15)
D
is the pump displacement per revolution. The hy-
draulic pressure of the feed in Pascal can be found using
the following relation:
2
fin
T
PP
D
ηπ
=+
(16)
where η is the efficiency of the pump.
PV array model
The five parameters model for PV array can be used to
represent the relation between the cell current and volt-
age [13,14]:
0(1)
s
t
VIR
aV
s
Lsh
VIR
IIIe R
++
=−− (17)
where IL is the light generated current, I and V are the
cell current and voltage, respectively, Io is the dark satu-
ration current, Rs and Rsh are the cell series and shunt
resistances, respectively, a is the quality factor for the
diode, and Vt is the thermal voltage, which is defined as
follows:
/
ts
VNkTq
= (18)
where k is Boltzmann's constant (1.38 x 10⁻²³ J/K), T is
the ambient temperature in Kelvin, q is the electronic
charge (1.6 x 10⁻¹⁹ C), and Ns is the number of cells con-
nected in series. The above relations (1-18) are a set of
non-linear equations which are solved in MATLAB. In
our method, we are introducing a new simple approach to
M. ELSHAFEI ET AL.
Copyright © 2013 SciRes. OJAppS
38
Figure 4. Illustration of the PV-RO system.
track the maximum power given by the PV array by ma-
nipulating the valve position. As in eq. (12), manipulat-
ing the valve opening is related to the volumetric flow of
the brine water. Additionally, since the volumes and the
masses must be balanced, this has a direct impact on the
flow of feed water, which is related to the output of the
pump (eq. 17). Furthermore, the output of the pump is
driven by the angular velocity of the motor (eq. 17),
which is related to the input voltage and current coming
from the PV array (eq. 16). Finally, since the valve
opening is related to the voltage and current of the PV
array, manipulating it can also change the input power
going to the motor.
4. Simulation Results and Discussion
All of the above equations were programmed in the
MATLAB environment to simulate the system. Feed
water temperature of 300 K, a salinity of 5000 ppm was
taken and other parameters for PV array, motor, and
pump are from [3] and are below.
6
5
63
8
832
1.5
2.510
1.91110
1296
6.252(/)
5.5(/)
0.65
0.1546
2.610/
2.010
101
1.948110(/sec)
t
o
s
sh
t
m
mo
mo
v
atm
s
aVV
IA
R
R
KANm
KrevVs
IAmp
R
Dmrev
K
PkPa
Kmm
=
=×Ω
=Ω
=
=
=
=Ω
=
The solar insolation for a typical day in May in Dhah-
ran, Saudi Arabia is given in Figure 5. Figures 6 show
the simulation results when only the valve position is
changed from 10% to 80%. Manipulating the brine valve
position changes the load line of the motor pump. This
I-V relation represents the load curve to be matched by
the PV. Figure 6 shows the I-V curve of the PV array
and the load curves for two different valve positions (U =
0.1(10% open) and U = 0.8 (80% open)). It is evident
that as we close the valve position, system pressure in-
creases and load line becomes steeper showing that more
power is consumed from the PV array. If the load line is
passing through maximum power point in the IV curve
then maximum power is harvested from the PV array and
this point can be tracked by changing the valve opening.
A simple hill-climbing (Perturb & Observer) algorithm
was developed to manipulate the position of the valve in
order to track the maximum power point. The system
operation is simulated from 6:00 am to 6:00 pm and the
current and voltage are measured every 15 minutes and
the change of power is monitored.
Figure 7 shows the power delivered by the PV com-
pared with the consumed power. At low power the valve
will not operate until the pressure in the membrane ex-
ceeds the osmotic pressure. Figures 8(a) and (b) illus-
trates the feed pressure and the permeate water flow rate.
The total water flow rate came to about 324 liters/day.
Conventional Battery-Operated System
051015 20
0
200
400
600
800
1000
Time in hours
Solar Energy Watts/m2
Figure 5. Typical 24 hours solar insolation in May at
KFUPM.
0510 1520 25
0
5
10
15
20
25
30
Current in Amp
Voltage
U =0.1
PV
U =0.8
RO Load
curve
Figure 6. I-V curve and RO load curves for different valve
positions.
M. ELSHAFEI ET AL.
Copyright © 2013 SciRes. OJAppS
39
05 1015 20 25
0
50
100
150
200
Time of the day
PV power
Figure 7. Dotted: available power; solid: used power.
05 10 15 2025
0
0.5
1
1.5
2
2.5 x 10
6
Input Pressure
(a)
During the Day
05 10 15 20 25
0
0.2
0.4
0.6
0.8
1
Permeate Flow Rate Litters/min
Time of the day
(b)
Figure 8. (a) Variation of Feed pressure (Pa); (b) Permeate
water flow rate in L/min.
The performance of the proposed system is compared
with a commercial system delivered with an electronic
MPPT system and a battery. The MPPT utilizes the solar
energy during the day to charge the battery. The RO sys-
tem then operates directly from the battery at almost
constant battery voltage of 24 volts (+- 2 volts). In this
case the brine valve is kept at a fixed position (0.5). The
efficiency of the electronic MPPT is 97%, and the battery
efficiency is assumed to be 85%. The total energy deliv-
ered by the MPPT to the battery is calculated as follows.
Es=Total Radiation energy = 6.76 kWh/m2
Energy available from the PV panel
= Es*(panel area)*(panel efficiency)
= (6.76)*(1.25)*(0.16)
=1.352 kWh
Assuming MPPT efficiency 97% is used to capture the
entire solar energy to a 24 volt battery. During RO op-
eration at a constant voltage of 24 volts, the battery cur-
rent is about 17 Ampere, and the permeate flow rate is
1.727 litters/min. The total desalinated water depends
now in the battery efficiency. For example at battery ef-
ficiency is 0.85, the total operating time will be about
169 minutes, and the total produced permeate water Qtotal
= 292 litters/day, that is less than the water volume pro-
duced by the proposed battery less system. In fact, to
produce the same amount of water per day, the battery
efficiency should be at least 94%.
5. Conclusions
In this work detailed mathematical model of a battery-
less PV RO system is explained and a simple design ap-
proach to track the maximum power point of the PV
module is introduced. The perturb and observe (P&O)
algorithm is used to find and track and maximum power
point by manipulating the position of the brine valve in
the RO system. The whole system was simulated by
making use of typical values of the process parameters.
Power consumed in the RO process is closely tracking
the available power from the panel. The proposed
scheme is a simple low-cost approach since changing the
position of the valve can be done by a cheap microcon-
troller. Further improvements needs to be done to reduce
the repetitive fluctuations in the valve position. It is
shown that the proposed battery-less system provides
more water per day than battery operated system.
6. Acknowledgements
The authors would like to acknowledge the support of
King Fahd University of Petroleum and Minerals through
the Center for Clean Water and Clean Energy at KFUPM
(DSR project # R6-DMN-08) and MIT.
REFERENCES
[1] A. M. K. El-Ghonemy, Water Desalination Systems
Powered by Renewable Energy Sources: Review, Re-
newable and Sustainable Energy Reviews, Vol. 16, 2012,
M. ELSHAFEI ET AL.
Copyright © 2013 SciRes. OJAppS
40
pp.1537-1556. doi:10.1016/j.rser.2011.11.002
[2] A. Rahardianto, J. Gao, C. J. Gabelich, M. D. Williams
and Y. Cohen, High Recovery Membrane Desalting of
Low-salinity Brackish Water: Integration of Accelerated
Precipitation Softening with Membrane RO, Journal of
Membrane Science, Vol. 289, 2007, pp. 123-137.
doi:10.1016/j.memsci.2006.11.043
[3] A. R. Bartmana, A. Zhua, P. D. Christofidesa and Y.
Cohena, Minimizing Energy Consumption in Reverse
Osmosis Membrane Desalination Using Optimiza-
tion-based Control, Journal of Process Control, 2010.
[4] A. Al-Karaghouli, D. Renne and L. L. Kazmerski, Re-
newable Energy Technical and Economic Assessment of
Photovoltaic-driven Desalination Systems,Vol. 35, 2010.
[5] O. K. Buros, The ABCs of Desalting, Published by the
International Desalination Association, Topsfield, Mas-
sachusetts, USA, 2000.
[6] A. M. Bilton, L. Kelley and S. Dubowsky, Photovoltaic
Reverse Osmosis Feasibility and A Pathway to De-
velop Technology, Desalination and Water Treatment,
Vol. 31, 2011, pp. 24-34. doi:10.5004/dwt.2011.2398
[7] A. M. Thomson, Reverse-osmosis Desalination of Sea-
water Powered by Photovoltaics without Batteries, A
Doctoral Thesis, Loughborough University, 2003.
[8] S. Abdallaha, M. Abu-Hilala and M. S. Mohsen, Per-
formance of A Photovoltaic Powered Reverse Osmosis
System under Local Climatic Conditions, Desalination
Vol.183, 2005, pp. 95-104.
doi:10.1016/j.desal.2005.03.030
[9] A. R. Bartman, P. D. Christofides and Y. Cohen,
Non-linear Model-based Control of An Experimental
Reverse-osmosis Water Desalination System, Industrial
& Engineering Chemistry Research, Vol. 48, 2009, pp.
6126-6136. doi:10.1021/ie900322x
[10] P. C. M de Capvalho, R. S. T. Pontes, D. S. Oliveira Jr,
D. B. Riffel, R. G. V. de Oliveria and S. B. Mesquita,
Control Method of A Photovoltaic Powered Reverse
Osmosis Plant without Batteries Based on Maximum
Power Point Tracking, IEEE/PES Transmission & Dis-
tribution Conference & Exposition: Latin America, 2004.
[11] Solmetric Corporation, Guide To Interpreting I-V Curve
Measurements of PV Arrays, Solmetric Corporation,
March 2011.
[12] H. T. El-Dessouky and H. M. Ettouney, Fundamentals of
Salt Water Desalination, Elsevier Science B.V., 2002, p.
429.
[13] J. A. Gow and C. D. Manning, Development of A Photo-
voltaic Array Model for Use in Power-electronics Simu-
lation Studies, Proceedings of the 14th IEE Electric
Power Applications Conference, APEC, UK, Vol. 146,
No. 2, 1999, pp. 193-200.
[14] A. El Tayyan, PV System Behavior Based on Data-
sheet, Journal of Electron Devices, Vol. 9, 2011, pp.
335-341.
[15] T. Esram and P. L. Chapman, Comparison of Photo-
voltaic Array Maximum Power Point Tracking Tech-
niques.