 Vol.5, No.10, 1667-1680 (2013) Health http://dx.doi.org/10.4236/health.2013.510225 Utilization effects of Rx-OTC switches and implications for future switches* Chris Stomberg1, Tomas Philipson2, Margaret Albaugh1, Neeraj Sood3# 1Bates White, Washington DC, USA 2The Harris School, University of Chicago, Chicago, USA 3Leonard D. Schaeffer Center for Health Policy and Economics, University of Southern California, Los Angeles, USA; #Corresponding Author: nsood@usc.edu Received 6 August 2013; revised 6 September 2013; accepted 24 September 2013 Copyright © 2013 Chris Stomberg et al. This is an open access article distributed under the Creative Commons Attribution License, which permits unrestricted use, distribution, and reproduction in any medium, provided the original work is properly cited. ABSTRACT We examined the effect of over-the-counter (OTC) conversion of prescription drugs on utili- zation at the drug class lev el using monthly drug utilization data from the US for the period 1999- 2010 for 9 drug classes: antihistamines, benign prostatic hyperplasia medication, cholesterol control drugs (statins), analgesics (triptans), contraception medications (emergency contra- ception), antiulcerants (proton pump inhibitors) non-sedating antihistamines, weight-loss reme- dies and erectile dysfunction remedies. We per- formed interrupted time series analy sis to detect a break in the trend of drug utilization following OTC introduction. We found that the introduc- tion of the first OTC drug increased drug utiliza- tion at the class level by an average of 30% or more. We concluded that OTC switches can be an important policy tool for improving public health in drug classes where a significant pro- portion of the population is untreated and where consumers can effectively manage treatment with limited physician supervision. Keyw ords: Over-the-Counter; Prescription Drugs; Health Care Costs; Utilization; Spending 1. INTRODUCTION The availability of over-the-counter (OTC) drug products in the United States over the past 30 years has been an integral part of a quiet revolution in health care. Effective pharmaceutical treatments for a wide variety of conditions have moved not just from lab to market, but in a number of cases to store shelves where consumers have ready access to them. In fact, according to Consumer Healthcare Products Association (CHPA), “More than 700 OTC products on the market today use ingredients or dosages available only by prescription less than 30 years ago [1].” This has fundamentally changed how many common health problems are treated. However, little is known about how OTC conversion of pharmaceutical products affects access to drugs and what impact it has on health and health care costs. Despite the OTC revolution, the majority of drugs in the United States remain available only with a phy- sician’s prescription. For some drugs, this barrier to access has indisputable advantages. The prescrip- tion-only status ensures physician’s supervision and decreases the incidence of incorrect self-diagnosis and potential misuse of drugs. However, on the other hand, the monetary and time cost of physician visits required for access to prescription drugs decreases access to drugs. Thus, for some medicines, where consumers can effectively manage treatment on their own, the benefits of requiring a physician prescription might be offset by the reduced access to drugs. Unlike prescription drugs, OTC drugs are freely available for consumers at pharmacies, supermarkets, and other retail outlets. This ensures increased con- venience and rapid access to effective medicine and with appropriate labeling and consumer education, this ease of access of OTC drugs can lead to increase in use of drugs and better health. OTC drugs also keep consumers engaged and allow them to take responsi- bility for their own health. In addition, since OTC drugs do not require a prescription, they could poten- tially reduce time, travel and monetary costs related to physician office visits. Although OTC drugs are sometimes cheaper than their prescription-only coun- terparts, they are typically not covered by insurance [2]. Thus, the out of pocket price of the drug for the *Funding source: This research was funded by a grant from Pfizer Inc. The views expressed herein are those of the authors and do not neces- sarily reflect the views of the funding source. Copyright © 2013 SciRes. OPEN ACCESS  C. St omberg et al. / Health 5 (2013) 1667-1680 1668 consumer after the conversion can be higher. There- fore, lifting a barrier to access, i.e. allowing a drug to be purchased over the counter may or may not in- crease drug utilization. The association between financial barriers to access— such as cost sharing features of prescription drug benefits —and drug utilization is studied extensively (see to Goldman, Joyce and Zheng (2007) for a review [3]), but less is known about the impact of prescription status on access and overall health. Several papers have investigated the impact of OTC conversion on utilization of a single molecule. Pierce and Gilpin (2002) and Reed et al. (2005) examine the OTC conversion of nicotine replacement therapy and find a significant increase in utilization [4,5]. Moreau et al. (2006) look at this question for emergency contraception and find an increase in utilization of approximately 60% following OTC conversion [6]. Sood et al. (2008) and Sood et al. (2012) examined multiple molecules that experienced a switch, both in the US and all over the world [7,8]. They found mixed results on utilization. This is not surprising as the effects of OTC conversion on uti- lization might depend on the nature of treatment. For ex- ample, whether the drug is intended to change behavior (e.g smoking cessation medicines) or whether the drug is intended to relive symptoms (e.g. medicines for prevent- ing heartburn). Other papers have shown that OTC conversion de- creases prescription utilization of alternate therapies. Gurwitz et al. (1995) investigates such effect on pre- scription only vaginal antifungal medication and finds that the number of prescriptions for alternate therapies indeed decreased [9]. A similar question is studied in Sullivan et al. (2005) and Furler et al. (2002) in the con- text of the antihistamine class, in Filion et al. (2007) in the context of the statin class, in Pierce and Gilpin (2002) and Reed et al. (2005) in the context of nicotine re- placement therapies and in Walker and Hinchliffe (2010) for eye drops and eye ointment [4,5,10-13]. These au- thors all find that the utilization of prescription only al- ternative(s) decreases with the introduction of an OTC drug. Essentially, all the studies above investigate the degree of substitution between prescription-only and OTC drugs. Thus, it is unclear from prior studies whether OTC conversion increases access to drugs, that is, whether increase in use of OTC drugs is more than offset by decrease in use of prescription-only substitute treat- ments. In this study we add to this literature by estimating the effects of OTC conversion on changes in drug utilization at the drug class level. In particular, we are interested in measuring the effects of OTC conversion on use of the OTC drug itself as well as that of the prescription-only alternative(s). Once a drug becomes available over the counter, it is more accessible than other similar therapies requiring prescription. Thus, a straightforward conse- quence of an OTC switch is a simple substitution from the restricted drugs to the over-the-counter alternative, i.e. an increase in utilization of the OTC drug at the expense of the other drugs in the same drug class. A drop in the number of prescriptions after an OTC conversion is well-documented in several studies (see references above). By contrast, we estimate the effect of an OTC switch on utilization beyond this simple substitution ef- fect. We intend to study the extent to which removing a regulatory barrier contributes to the more widespread use of a therapy class. To our best knowledge, this is the first study to investigate the impacts of a prescription status change for the entire drug class—including both OTC and prescription only alternatives. In addition to reviewing the impact of OTC conver- sion on utilization, we then take the projected utilization increase and discuss possible implications for health and cost outcomes for potential future OTC switch candi- dates. Prior studies document significant public health and quality of life impacts of OTC medications in drug classes such as allergy medications and smoking cessa- tion products. For example, Sullivan et al. (2003) simu- late the health effects of OTC non-sedating antihista- mines and predict a significant level of annual savings in time-discounted, quality-adjusted life years due to de- creasing risks of injuries and fatalities associated with sedation [14]. Studying the class of nicotine replacement therapies (NRT), Reed et al. (2005) document an in- crease in the proportion of smokers using NRT as well as in the reported abstinence immediately after the OTC switch in 1996 [5]. Using data from randomized trials, Stead et al. (2008) confirm the result that NRT products increase the chance of successful cessation [15]. Finally, several studies find that easier access to emergency con- traception increases utilization but has no effect on the pregnancy rates (see meta-studies conducted by Ray- mond et al. (2007) and Polis et al. (2007)) [16,17]. In summary, increased availability of drugs in an OTC set- ting can lead to significant increase in access to drug with a potential for significant public health benefits. This article proceeds as follows: Sections 2 and 3 describe our data and methods, respectively. Section 4 presents the results of our empirical estimation. We conclude in Section 5 with a discussion of our findings, which we relate to potential health outcomes and cost impacts. 2. DATA We studied the effect of moving a drug to OTC status on total utilization of the relevant drug class. Our data are from the MIDAS database maintained by IMS Health Copyright © 2013 SciRes. OPEN ACCESS 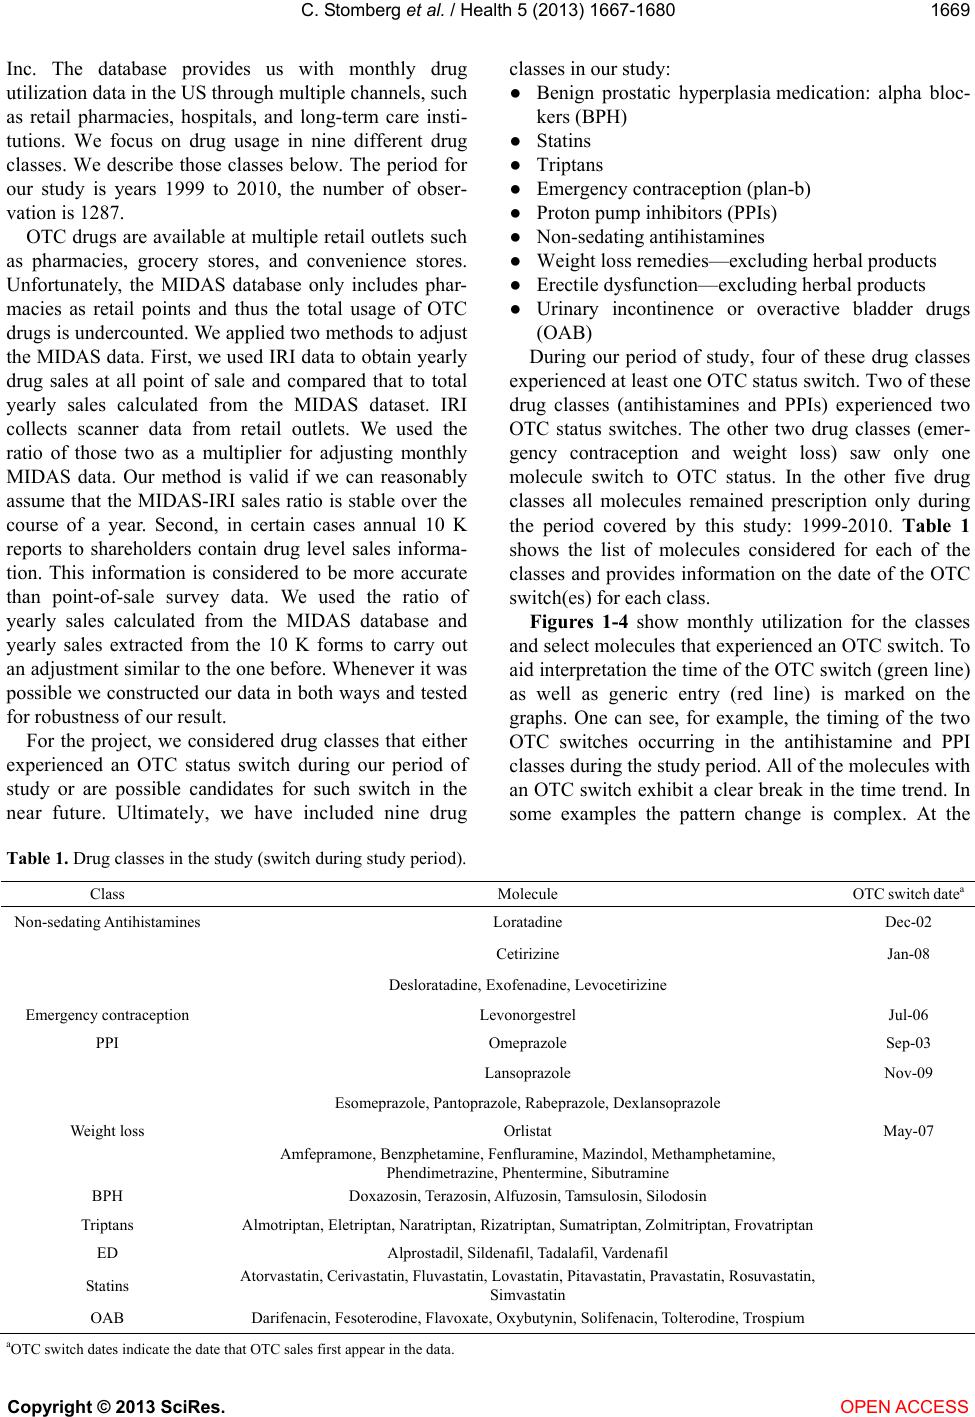 C. St omberg et al. / Health 5 (2013) 1667-1680 Copyright © 2013 SciRes. OPEN ACCESS 1669 Inc. The database provides us with monthly drug utilization data in the US through multiple channels, such as retail pharmacies, hospitals, and long-term care insti- tutions. We focus on drug usage in nine different drug classes. We describe those classes below. The period for our study is years 1999 to 2010, the number of obser- vation is 1287. OTC drugs are available at multiple retail outlets such as pharmacies, grocery stores, and convenience stores. Unfortunately, the MIDAS database only includes phar- macies as retail points and thus the total usage of OTC drugs is undercounted. We applied two methods to adjust the MIDAS data. First, we used IRI data to obtain yearly drug sales at all point of sale and compared that to total yearly sales calculated from the MIDAS dataset. IRI collects scanner data from retail outlets. We used the ratio of those two as a multiplier for adjusting monthly MIDAS data. Our method is valid if we can reasonably assume that the MIDAS-IRI sales ratio is stable over the course of a year. Second, in certain cases annual 10 K reports to shareholders contain drug level sales informa- tion. This information is considered to be more accurate than point-of-sale survey data. We used the ratio of yearly sales calculated from the MIDAS database and yearly sales extracted from the 10 K forms to carry out an adjustment similar to the one before. Whenever it was possible we constructed our data in both ways and tested for robustness of our result. For the project, we considered drug classes that either experienced an OTC status switch during our period of study or are possible candidates for such switch in the near future. Ultimately, we have included nine drug classes in our study: ● Benign prostatic hyperplasia medication: alpha bloc- kers (BPH) ● Statins ● Triptans ● Emergency contraception (plan-b) ● Proton pump inhibitors (PPIs) ● Non-sedating antihistamines ● Weight loss remedies—excluding herbal products ● Erectile dysfunction—excluding herbal products ● Urinary incontinence or overactive bladder drugs (OAB) During our period of study, four of these drug classes experienced at least one OTC status switch. Two of these drug classes (antihistamines and PPIs) experienced two OTC status switches. The other two drug classes (emer- gency contraception and weight loss) saw only one molecule switch to OTC status. In the other five drug classes all molecules remained prescription only during the period covered by this study: 1999-2010. Table 1 shows the list of molecules considered for each of the classes and provides information on the date of the OTC switch(es) for each class. Figures 1-4 show monthly utilization for the classes and select molecules that experienced an OTC switch. To aid interpretation the time of the OTC switch (green line) as well as generic entry (red line) is marked on the graphs. One can see, for example, the timing of the two OTC switches occurring in the antihistamine and PPI classes during the study period. All of the molecules with an OTC switch exhibit a clear break in the time trend. In some examples the pattern change is complex. At the Table 1. Drug classes in the study (switch during study period). Class Molecule OTC switch datea Non-sedating Antihistamines Loratadine Dec-02 Cetirizine Jan-08 Desloratadine, Exofenadine, Levocetirizine Emergency contraception Levonorgestrel Jul-06 PPI Omeprazole Sep-03 Lansoprazole Nov-09 Esomeprazole, Pantoprazole, Rabeprazole, Dexlansoprazole Weight loss Orlistat May-07 Amfepramone, Benzphetamine, Fenfluramine, Mazindol, Methamphetamine, Phendimetrazine, Phentermine, Sibutramine BPH Doxazosin, Terazosin, Alfuzosin, Tamsulosin, Silodosin Triptans Almotriptan, Eletriptan, Naratriptan, Rizatriptan, Sumatriptan, Zolmitriptan, Frovatriptan ED Alprostadil, Sildenafil, Tadalafil, Vardenafil Statins Atorvastatin, Cerivastatin, Fluvastatin, Lovastatin, Pitavastatin, Pravastatin, Rosuvastatin, Simvastatin OAB Darifenacin, Fesoterodine, Flavoxate, Oxybutynin, Solifenacin, Tolterodine, Trospium aOTC switch dates indicate the date that OTC sales first appear in the data.  C. St omberg et al. / Health 5 (2013) 1667-1680 1670 (a) (b) Figure 1. Effect of OTC switch and generic entry on antihista- mine utilization. (a) Antihistamine class; (b) Loratadine mole- cule. class level, changes are apparent but somewhat attenu- ated—which is to be expected as the switching mole- cules often represent a fraction of total class utilization. The differences between the observable molecule and class-level effects, however, are not fully explained by market share of the switching drug, which suggests that there may also be within-class substitution effects. 3. METHOD 3.1. Overview Although primary interest is directed toward class- level utilization effects of OTC switches as this has the greatest policy implications, our empirical approach also addresses the effect of OTC switch on utilization for the molecule. By doing this, we are able to shed some light on the effect of a switched drug’s market share on its class-wide impact as well as potential substitution effects that may occur among drugs within a class. Our approach focuses mainly on identifying a break in Figure 2. Effect of OTC switch and generic entry on emer- gency contraception utilization. Note: Levonorgestrel was the only drug in emergency contraception class drug class. the pattern of utilization for the molecule or class post OTC switch without necessarily benchmarking directly against other classes or molecules, i.e. we use an inter- rupted time-series approach. The essence of this ap- proach is to build a model that predicts utilization with- out accounting for the OTC switch, and then to compare that model against an alternative model that takes the timing of the OTC switch into account. The difference between these models can be used to estimate the sig- nificance and magnitude of the OTC effect. We also ex- plore a variant based on a predictive approach that com- pares actual post-OTC switch utilization to forecasts from a model fit to pre-switch data. These designs are quite flexible, and encompass a wide variety of potential specifications for the baseline and comparison models. A difference-in-difference method is not employed due to the difficulties in finding appropriate benchmarks. For example, utilization of other molecules within a class may change due to an OTC switch in their class and thus create a moving target for comparison. Similarly, bench- marks drawn from other product classes or countries are likely confounded by differences such as product de- mand, lifecycle status, and regulatory/reimbursement en- vironment. 3.2. The Models The plots in Figures 1-4 illustrate the complexity of dynamics that can occur both before and after OTC switch. This complexity underscores several important modeling considerations: ● Product life-cycle is important to take into account as products can have accelerating, decelerating, or de- clining growth depending on where in the life-cycle they are at the time of OTC switch. ● Utilization dynamics can change in a number of ways (e.g., intercept, slope, curvature) after OTC switch. Copyright © 2013 SciRes. OPEN ACCESS 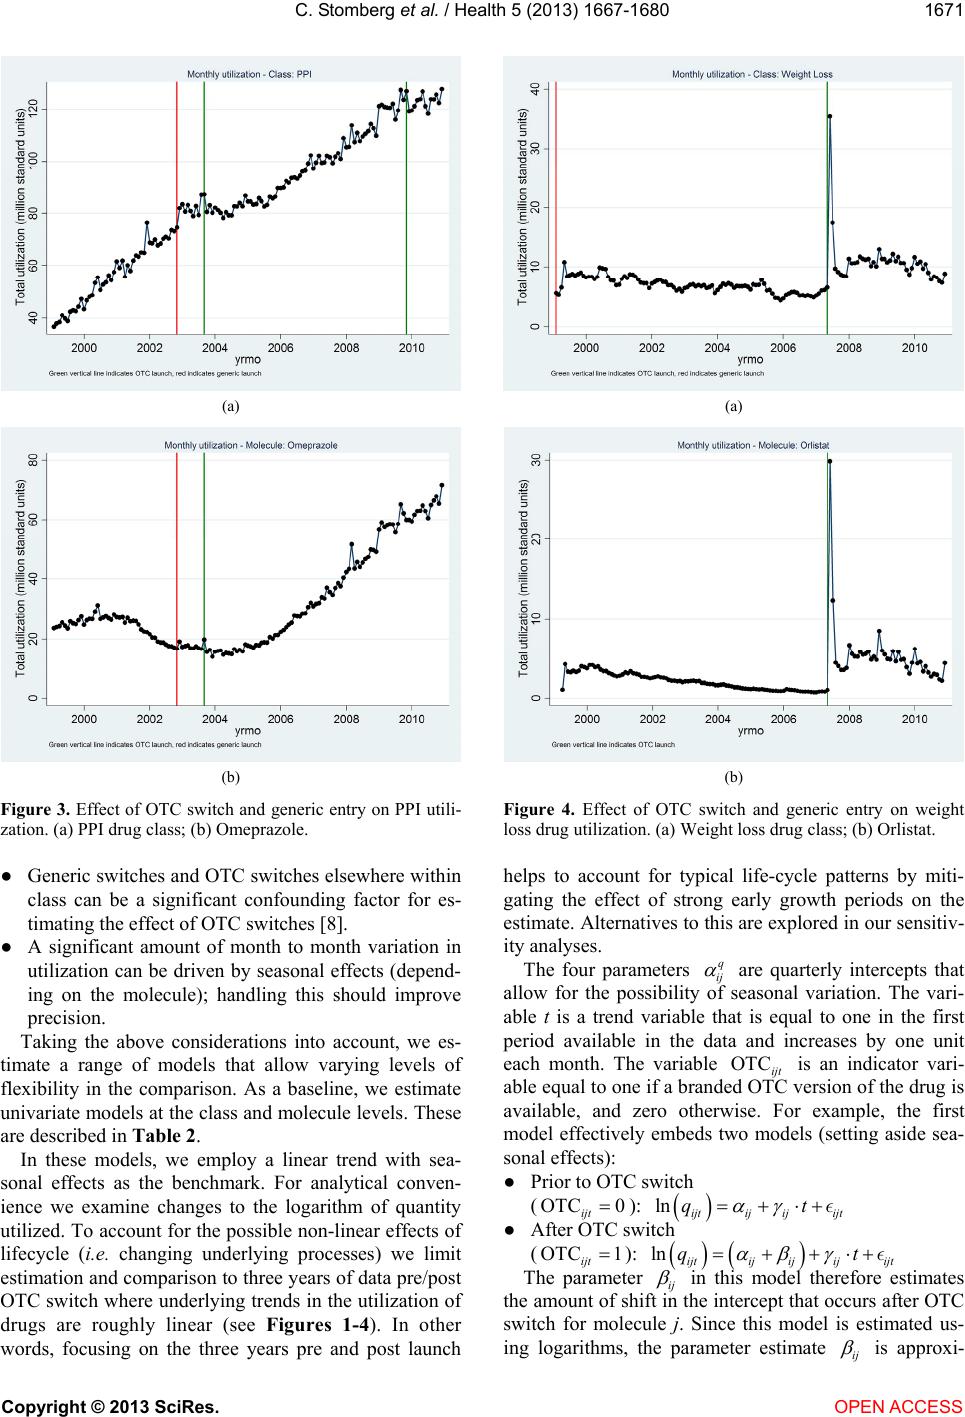 C. St omberg et al. / Health 5 (2013) 1667-1680 1671 (a) (b) Figure 3. Effect of OTC switch and generic entry on PPI utili- zation. (a) PPI drug class; (b) Omeprazole. ● Generic switches and OTC switches elsewhere within class can be a significant confounding factor for es- timating the effect of OTC switches [8]. ● A significant amount of month to month variation in utilization can be driven by seasonal effects (depend- ing on the molecule); handling this should improve precision. Taking the above considerations into account, we es- timate a range of models that allow varying levels of flexibility in the comparison. As a baseline, we estimate univariate models at the class and molecule levels. These are described in Table 2. In these models, we employ a linear trend with sea- sonal effects as the benchmark. For analytical conven- ience we examine changes to the logarithm of quantity utilized. To account for the possible non-linear effects of lifecycle (i.e. changing underlying processes) we limit estimation and comparison to three years of data pre/post OTC switch where underlying trends in the utilization of drugs are roughly linear (see Figures 1-4). In other words, focusing on the three years pre and post launch (a) (b) Figure 4. Effect of OTC switch and generic entry on weight loss drug utilization. (a) Weight loss drug class; (b) Orlistat. helps to account for typical life-cycle patterns by miti- gating the effect of strong early growth periods on the estimate. Alternatives to this are explored in our sensitiv- ity analyses. The four parameters q ij are quarterly intercepts that allow for the possibility of seasonal variation. The vari- able t is a trend variable that is equal to one in the first period available in the data and increases by one unit each month. The variable is an indicator vari- able equal to one if a branded OTC version of the drug is available, and zero otherwise. For example, the first model effectively embeds two models (setting aside sea- sonal effects): OTC ijt ● Prior to OTC switch (OTC 0 ijt ): ln ijt ijij ijt qt ● After OTC switch (OTC 1 ijt ): ln ijtij ijijijt qt The parameter ij in this model therefore estimates the amount of shift in the intercept that occurs after OTC switch for molecule j. Since this model is estimated us- ing logarithms, the parameter estimate ij is approxi- Copyright © 2013 SciRes. OPEN ACCESS 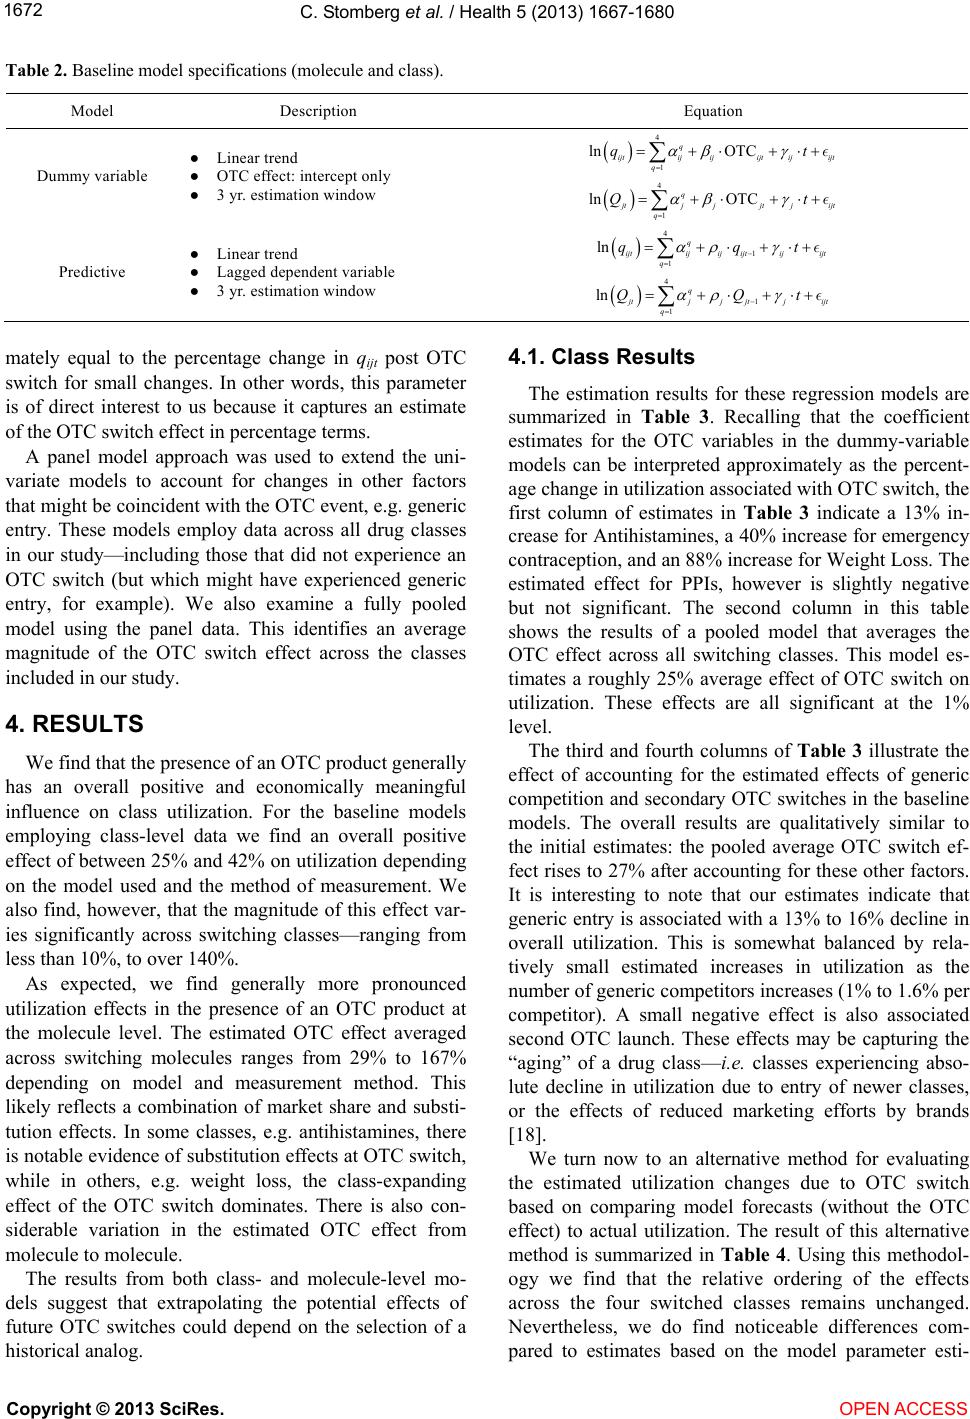 C. St omberg et al. / Health 5 (2013) 1667-1680 Copyright © 2013 SciRes. 1672 Table 2. Baseline model specifications (molecule and class). Model Description Equation Dummy variable ● Linear trend ● OTC effect: intercept only ● 3 yr. estimation window 4 1 ln OTC q ijtijijijt ijijt q qt 4 1 ln OTC q jtjjjt jijt q Qt Predictive ● Linear trend ● Lagged dependent variable ● 3 yr. estimation window 4 1 1 ln q ijtijij ijtijijt q qq t 4 1 1 ln q jtjj jtjijt q QQ t 4.1. Class Results mately equal to the percentage change in qijt post OTC switch for small changes. In other words, this parameter is of direct interest to us because it captures an estimate of the OTC switch effect in percentage terms. The estimation results for these regression models are summarized in Table 3. Recalling that the coefficient estimates for the OTC variables in the dummy-variable models can be interpreted approximately as the percent- age change in utilization associated with OTC switch, the first column of estimates in Table 3 indicate a 13% in- crease for Antihistamines, a 40% increase for emergency contraception, and an 88% increase for Weight Loss. The estimated effect for PPIs, however is slightly negative but not significant. The second column in this table shows the results of a pooled model that averages the OTC effect across all switching classes. This model es- timates a roughly 25% average effect of OTC switch on utilization. These effects are all significant at the 1% level. A panel model approach was used to extend the uni- variate models to account for changes in other factors that might be coincident with the OTC event, e.g. generic entry. These models employ data across all drug classes in our study—including those that did not experience an OTC switch (but which might have experienced generic entry, for example). We also examine a fully pooled model using the panel data. This identifies an average magnitude of the OTC switch effect across the classes included in our study. 4. RESULTS The third and fourth columns of Table 3 illustrate the effect of accounting for the estimated effects of generic competition and secondary OTC switches in the baseline models. The overall results are qualitatively similar to the initial estimates: the pooled average OTC switch ef- fect rises to 27% after accounting for these other factors. It is interesting to note that our estimates indicate that generic entry is associated with a 13% to 16% decline in overall utilization. This is somewhat balanced by rela- tively small estimated increases in utilization as the number of generic competitors increases (1% to 1.6% per competitor). A small negative effect is also associated second OTC launch. These effects may be capturing the “aging” of a drug class—i.e. classes experiencing abso- lute decline in utilization due to entry of newer classes, or the effects of reduced marketing efforts by brands [18]. We find that the presence of an OTC product generally has an overall positive and economically meaningful influence on class utilization. For the baseline models employing class-level data we find an overall positive effect of between 25% and 42% on utilization depending on the model used and the method of measurement. We also find, however, that the magnitude of this effect var- ies significantly across switching classes—ranging from less than 10%, to over 140%. As expected, we find generally more pronounced utilization effects in the presence of an OTC product at the molecule level. The estimated OTC effect averaged across switching molecules ranges from 29% to 167% depending on model and measurement method. This likely reflects a combination of market share and substi- tution effects. In some classes, e.g. antihistamines, there is notable evidence of substitution effects at OTC switch, while in others, e.g. weight loss, the class-expanding effect of the OTC switch dominates. There is also con- siderable variation in the estimated OTC effect from molecule to molecule. We turn now to an alternative method for evaluating the estimated utilization changes due to OTC switch based on comparing model forecasts (without the OTC effect) to actual utilization. The result of this alternative method is summarized in Table 4. Using this methodol- ogy we find that the relative ordering of the effects across the four switched classes remains unchanged. Nevertheless, we do find noticeable differences com- pared to estimates based on the model parameter esti- The results from both class- and molecule-level mo- dels suggest that extrapolating the potential effects of future OTC switches could depend on the selection of a historical analog. OPEN ACCESS 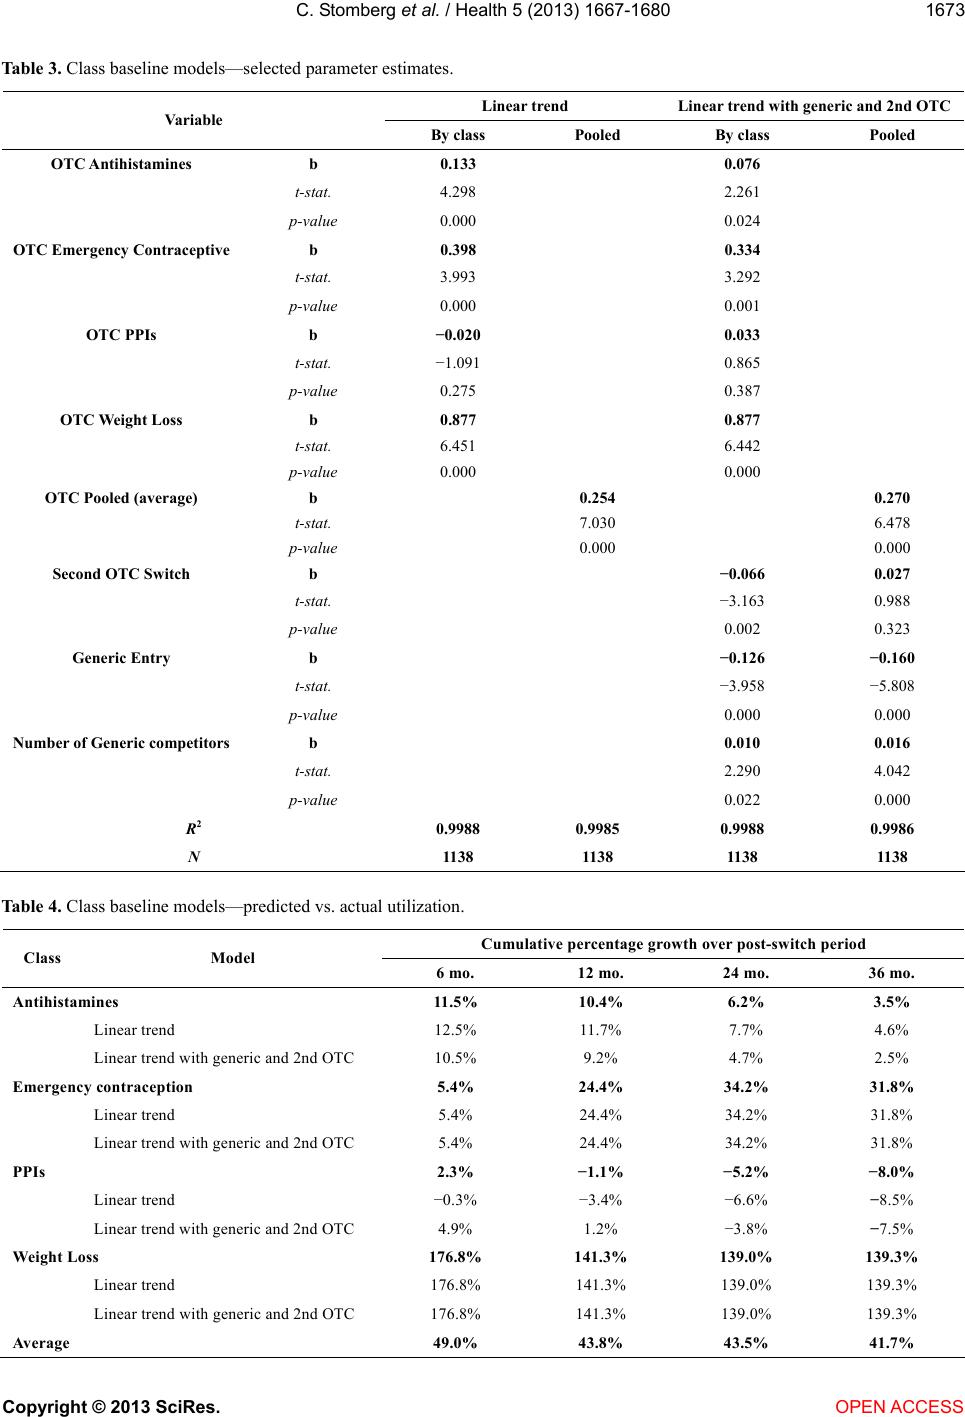 C. St omberg et al. / Health 5 (2013) 1667-1680 1673 Table 3. Class baseline models—selected parameter estimates. Linear trend Linear trend with generic and 2nd OTC Variable By class Pooled By class Pooled OTC Antihistamines b 0.133 0.076 t-stat. 4.298 2.261 p-value 0.000 0.024 OTC Emergency Contraceptive b 0.398 0.334 t-stat. 3.993 3.292 p-value 0.000 0.001 OTC PPIs b −0.020 0.033 t-stat. −1.091 0.865 p-value 0.275 0.387 OTC Weight Loss b 0.877 0.877 t-stat. 6.451 6.442 p-value 0.000 0.000 OTC Pooled (average) b 0.254 0.270 t-stat. 7.030 6.478 p-value 0.000 0.000 Second OTC Switch b −0.066 0.027 t-stat. −3.163 0.988 p-value 0.002 0.323 Generic Entry b −0.126 −0.160 t-stat. −3.958 −5.808 p-value 0.000 0.000 Number of Generic competitors b 0.010 0.016 t-stat. 2.290 4.042 p-value 0.022 0.000 R2 0.9988 0.9985 0.9988 0.9986 N 1138 1138 1138 1138 Table 4. Class baseline models—predicted vs. actual utilization. Cumulative percentage growth over post-switch period Class Model 6 mo. 12 mo. 24 mo. 36 mo. Antihistamines 11.5% 10.4% 6.2% 3.5% Linear trend 12.5% 11.7% 7.7% 4.6% Linear trend with generic and 2nd OTC 10.5% 9.2% 4.7% 2.5% Emergency contraception 5.4% 24.4% 34.2% 31.8% Linear trend 5.4% 24.4% 34.2% 31.8% Linear trend with generic and 2nd OTC 5.4% 24.4% 34.2% 31.8% PPIs 2.3% −1.1% −5.2% −8.0% Linear trend −0.3% −3.4% −6.6% −8.5% Linear trend with generic and 2nd OTC 4.9% 1.2% −3.8% −7.5% Weight Loss 176.8% 141.3% 139.0% 139.3% Linear trend 176.8% 141.3% 139.0% 139.3% Linear trend with generic and 2nd OTC 176.8% 141.3% 139.0% 139.3% Average 49.0% 43.8% 43.5% 41.7% Copyright © 2013 SciRes. OPEN ACCESS  C. St omberg et al. / Health 5 (2013) 1667-1680 1674 mates. For example, the estimated three-year cumulative percentage change for the Antihistamine class ranges from 3% to 5% when estimated via this method versus 8% to 13% based on examination of parameter estimates. The OTC effect for Weight Loss moves from 88% to close to 139%. Overall, the average 3-year OTC switch effect on class-level utilization computed via this method is about 42%. 4.2. Molecule Results The estimation results for these regression models are summarized in Table 5. Once again we find that the es- timated effects of OTC switch vary considerably from molecule to molecule, ranging from apparently negative estimated effects on utilization for the omeprazole switch, to 212% for Orlistat. Pooling across the molecules that switch we find an average utilization change of 29% in the presence of an OTC switch if generic entry and other OTC switches are not accounted for, and 46% if they are. The estimated effect of generic entry is supported in part by events that occur outside the switching molecules. As a result, it is possible to separate the estimated effect of generic entry within molecule from that of other molecules within class. Both effects are significant and have opposing signs suggesting entry of a generic within the molecule is associated with a drop in utilization of the molecule while generic entry elsewhere in the class is associated with the opposite effect. This may be captur- ing the effects of follow-on product introductions. In Table 6, we compute average percentage changes in utilization in the presence of an OTC switch based on a comparison of forecast utilization (without OTC effect) to actual utilization. As with the class models, the esti- mated 36 month changes are of a magnitude comparable to those derived from model parameter estimates in the individual molecules. The main deviation from this gen- eral rule is Orlistat, where the OTC effect is estimated to be over 750% as opposed to 212%. The larger estimate appears more realistic upon inspection of Figure 4. In 2006, the last full year before OTC switch, average monthly utilization was approximately 0.9 million units. By 2008, the first full year after OTC switch, utilization of Orlistat had jump to 5.75 million units—a 540% jump from 2006. This does not take into account the large spike in utilization in 2007 and the general downward trend in pre-OTC utilization, both of which are captured by the models. The overall average percentage change estimate (167%) is dominated by the Orlistat result. Comparison of these molecule-level results with the overall class results suggests the presence of substitution effects. For example, the loratidine (Claritin) OTC switch appears to have resulted in a 40% increase in loratidine utilization. However, class-wide utilization of non-sedating antihistamines changed only marginally post Claritin switch—perhaps between 3% and 5%. Claritin market share was roughly 30% at this time, so less of a change in class-level utilization occurred than would be predicted if other products in class were unaf- fected by the Claritin OTC switch (i.e. 30% × 40% = 12%). This suggests that other molecules in this class were treated as substitutes by some patients and saw de- clines after Claritin’s switch. In other cases, such as weight loss, however, the OTC switch is clearly class- expanding. 4.3. Sensitivity Analyses It is important to recognize that the quality of the overall estimate of the OTC effect can be affected by the quality of the estimated models. If the explanatory vari- ables do not properly account for important factors that affect utilization, then the estimation may be confounded by omitted variables, or lead to omitted variables bias. Similarly, functional form misspecification of our esti- mates could also lead to improper inference. To validate our results, we thus estimate a variety of alternative specifications and examine the sensitivity of our results to these alternative specifications. The alternatives we explored are summarized in Table 7. In particular, we considered the following alternatives to the baseline models: ● Change in trend: Allow slope of trend to change post OTC switch ● Flexible OTC dummies: Estimate 4 separate, non- overlapping, post OTC switch dummies (0 - 6 m., 6 - 12 m., 12 - 24 m., 24+ m.) ● Alternative life-cycle model: Estimate quadratic trend and use full pre-OTC switch period ● Predictive model: Estimate forecast model over pre OTC-switch data only, compare forecasts to actual utilization We generally find that the baseline models deliver ro- bust estimates. For example, in both Weight Loss and Emergency Contraception classes (and molecules), vir- tually all specifications identify large, significant, and persistent positive impacts on utilization attributable to OTC switch. The main exception to this rule is omeprazole where estimates of the OTC effect vary wildly across alterna- tive specifications—switching signs and changing levels of significance. Omeprazole has an unusually large up- swing in utilization driven largely by generic utilization post OTC switch (and generic launch). This is likely driven by formulary incentives put in place by payors after Prilosec lost exclusivity (and an OTC became available). In this case, it is not clear that generic and OTC effects are separately identified at the molecule level. Copyright © 2013 SciRes. OPEN ACCESS 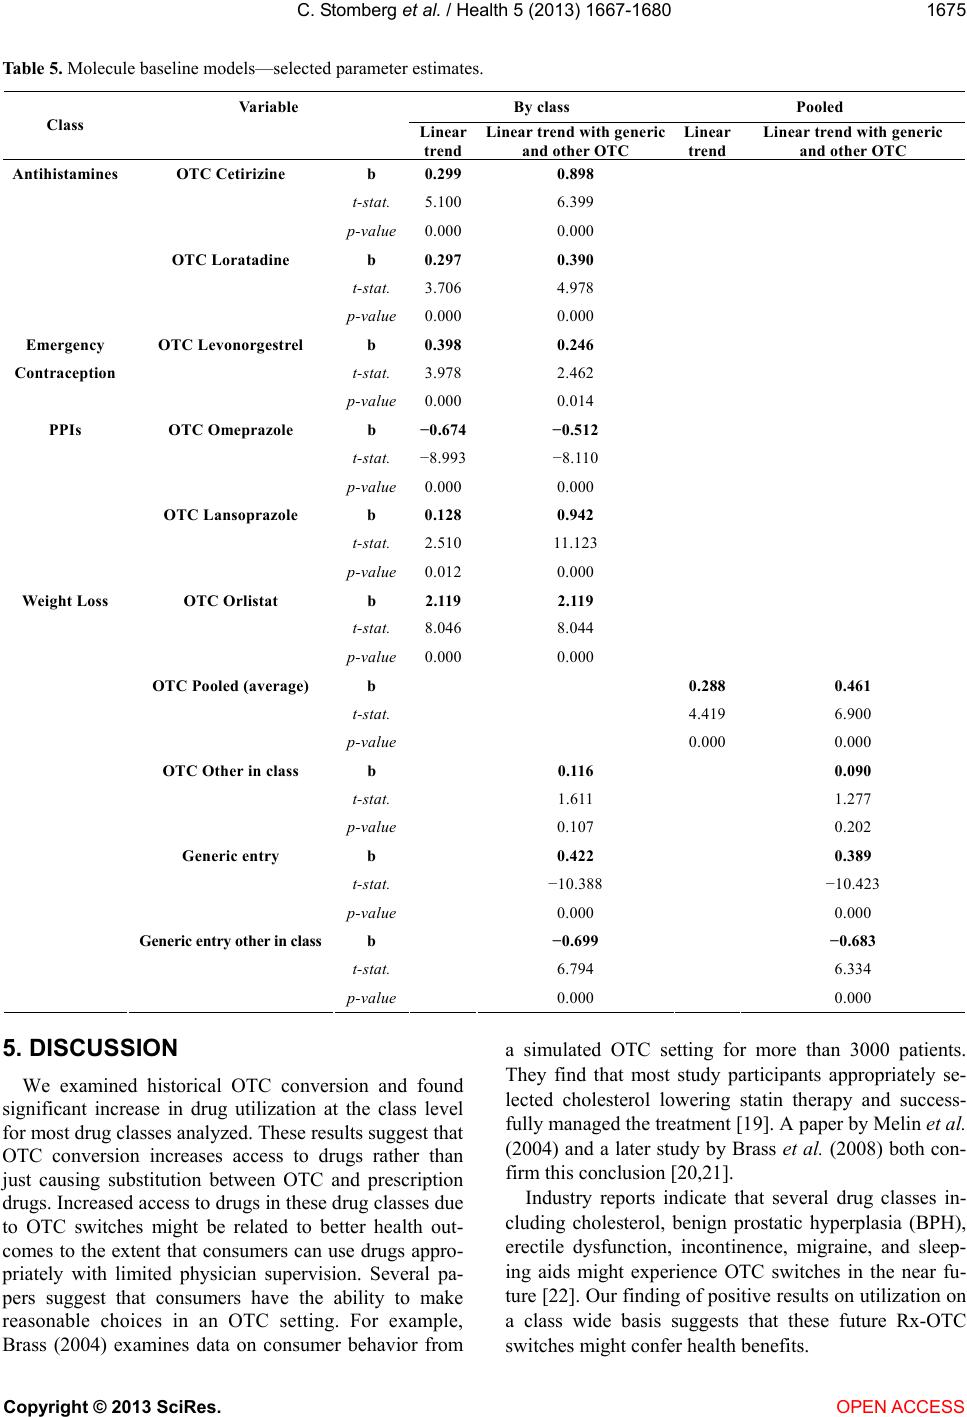 C. St omberg et al. / Health 5 (2013) 1667-1680 1675 Table 5. Molecule baseline models—selected parameter estimates. Vari ab le By class Pooled Class Linear trend Linear trend with generic and other OTC Linear trend Linear trend with generic and other OTC Antihistamines OTC Cetirizine b 0.2990.898 t-stat. 5.1006.399 p-value 0.0000.000 OTC Loratadine b 0.2970.390 t-stat. 3.7064.978 p-value 0.0000.000 Emergency OTC Levonorgestrel b 0.3980.246 Contraception t-stat. 3.9782.462 p-value 0.0000.014 PPIs OTC Omeprazole b −0.674 −0.512 t-stat. −8.993 −8.110 p-value 0.0000.000 OTC Lansoprazole b 0.1280.942 t-stat. 2.51011.123 p-value 0.0120.000 Weight Loss OTC Orlistat b 2.1192.119 t-stat. 8.0468.044 p-value 0.0000.000 OTC Pooled (average) b 0.2880.461 t-stat. 4.4196.900 p-value 0.0000.000 OTC Other in class b 0.116 0.090 t-stat. 1.611 1.277 p-value 0.107 0.202 Generic entry b 0.422 0.389 t-stat. −10.388 −10.423 p-value 0.000 0.000 Generic entry other in class b −0.699 −0.683 t-stat. 6.794 6.334 p-value 0.000 0.000 5. DISCUSSION We examined historical OTC conversion and found significant increase in drug utilization at the class level for most drug classes analyzed. These results suggest that OTC conversion increases access to drugs rather than just causing substitution between OTC and prescription drugs. Increased access to drugs in these drug classes due to OTC switches might be related to better health out- comes to the extent that consumers can use drugs appro- priately with limited physician supervision. Several pa- pers suggest that consumers have the ability to make reasonable choices in an OTC setting. For example, Brass (2004) examines data on consumer behavior from a simulated OTC setting for more than 3000 patients. They find that most study participants appropriately se- lected cholesterol lowering statin therapy and success- fully managed the treatment [19]. A paper by Melin et al. (2004) and a later study by Brass et al. (2008) both con- firm this conclusion [20,21]. Industry reports indicate that several drug classes in- cluding cholesterol, benign prostatic hyperplasia (BPH), erectile dysfunction, incontinence, migraine, and sleep- ing aids might experience OTC switches in the near fu- ture [22]. Our finding of positive results on utilization on a class wide basis suggests that these future Rx-OTC switches might confer health benefits. Copyright © 2013 SciRes. OPEN ACCESS 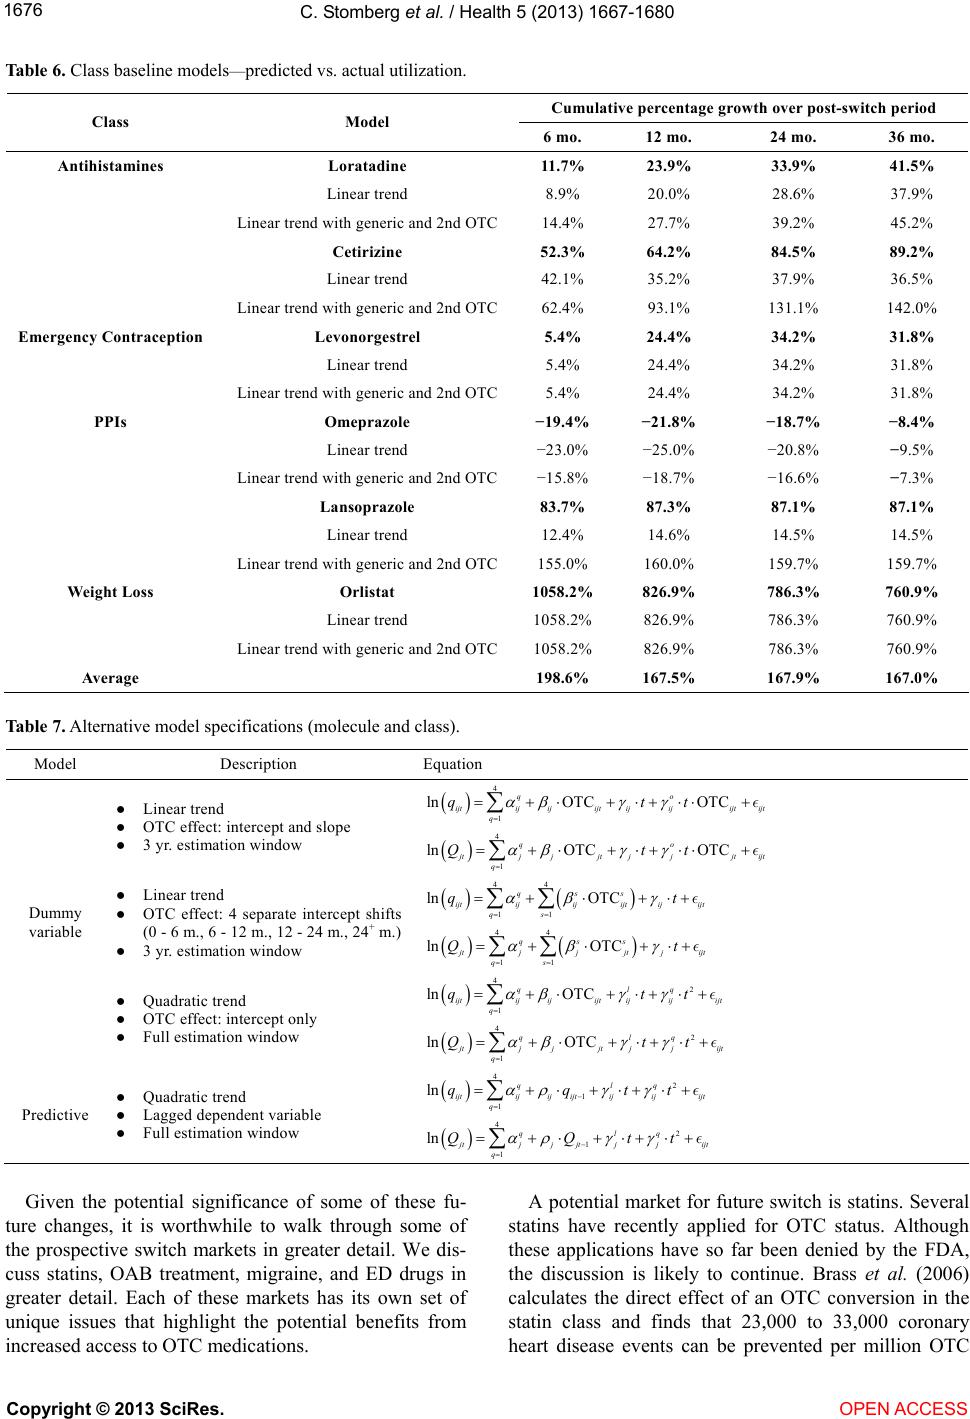 C. St omberg et al. / Health 5 (2013) 1667-1680 1676 Table 6. Class baseline models—predicted vs. actual utilization. Cumulative percentage growth over post-switch period Class Model 6 mo. 12 mo. 24 mo. 36 mo. Antihistamines Loratadine 11.7% 23.9% 33.9% 41.5% Linear trend 8.9% 20.0% 28.6% 37.9% Linear trend with generic and 2nd OTC 14.4% 27.7% 39.2% 45.2% Cetirizine 52.3% 64.2% 84.5% 89.2% Linear trend 42.1% 35.2% 37.9% 36.5% Linear trend with generic and 2nd OTC 62.4% 93.1% 131.1% 142.0% Emergency Contraception Levonorgestrel 5.4% 24.4% 34.2% 31.8% Linear trend 5.4% 24.4% 34.2% 31.8% Linear trend with generic and 2nd OTC 5.4% 24.4% 34.2% 31.8% PPIs Omeprazole −19.4% −21.8% −18.7% −8.4% Linear trend −23.0% −25.0% −20.8% −9.5% Linear trend with generic and 2nd OTC −15.8% −18.7% −16.6% −7.3% Lansoprazole 83.7% 87.3% 87.1% 87.1% Linear trend 12.4% 14.6% 14.5% 14.5% Linear trend with generic and 2nd OTC 155.0% 160.0% 159.7% 159.7% Weight Loss Orlistat 1058.2%826.9% 786.3% 760.9% Linear trend 1058.2%826.9% 786.3% 760.9% Linear trend with generic and 2nd OTC 1058.2%826.9% 786.3% 760.9% Average 198.6%167.5% 167.9% 167.0% Table 7. Alternative model specifications (molecule and class). Model Description Equation ● Linear trend ● OTC effect: intercept and slope ● 3 yr. estimation window 4 1 lnOTC OTC qo ijtijijijtijijijtijt q qt t 4 1 lnOTC OTC qo jtjjjtjjjt ijt q Qt t ● Linear trend ● OTC effect: 4 separate intercept shifts (0 - 6 m., 6 - 12 m., 12 - 24 m., 24+ m.) ● 3 yr. estimation window 44 11 ln OTC qss ijtijijijt ijijt qs qt 44 11 ln OTC qss jtjjjt jijt qs Qt Dummy variable ● Quadratic trend ● OTC effect: intercept only ● Full estimation window 4 2 1 ln OTC qlq ijtijijijt ijijijt q qt t 4 2 1 ln OTC qlq jtjjjt jjijt q Qt t Predictive ● Quadratic trend ● Lagged dependent variable ● Full estimation window 4 2 1 1 ln qlq ijtijij ijtijijijt q qqt t 4 2 1 1 ln qlq jtjj jtjjijt q QQt t Given the potential significance of some of these fu- ture changes, it is worthwhile to walk through some of the prospective switch markets in greater detail. We dis- cuss statins, OAB treatment, migraine, and ED drugs in greater detail. Each of these markets has its own set of unique issues that highlight the potential benefits from increased access to OTC medications. A potential market for future switch is statins. Several statins have recently applied for OTC status. Although these applications have so far been denied by the FDA, the discussion is likely to continue. Brass et al. (2006) calculates the direct effect of an OTC conversion in the statin class and finds that 23,000 to 33,000 coronary heart disease events can be prevented per million OTC Copyright © 2013 SciRes. OPEN ACCESS  C. St omberg et al. / Health 5 (2013) 1667-1680 1677 statin users [23]. Juxtaposing this result with the fact that a large proportion of adults with high levels of choles- terol remain untreated suggests that increased access to statins in an OTC setting can have significant public health benefits. Using our results of a 30% average mar- ket increase and an estimate of 36.5 million statin users calculated from NHANES (2007-2008) a nationally rep- resentative sample, even the conservative estimate of 23,000 averted heart disease events per million statin users from Brass et al. (2006) could result in as many as 250,000 averted events due to increased utilization fol- lowing OTC conversion of statins. When measuring the cost savings from the availability of OTC statins, one of the biggest savings follows di- rectly from averted events. Cardiac events cost approxi- mately $35,000 to treat [24]. This results in a savings of over $8 billion dollars over a ten year period due to averted events alone. Data on the source of payments demonstrate that these savings would accrue primarily to private insurers and to Medicare, each of whom currently pay for approximately 35% of costs related to MCE events. Insurers, including Medicare, would also save on drug costs. New users would presumably buy through the OTC channel, which is typically not covered by the in- surer. Additionally, some previous prescription users would likely switch to purchasing statins OTC, relieving the insurer of existing costs. New consumers of statins would incur the increased cost of purchasing the statin OTC. While statins have a significant impact on expected mortality and heart events, many of the other prospective OTC drug classes have a significant impact on health related quality of life. For over active bladder (OAB) drugs, availability to consumers without requiring a doc- tor visit may be particularly beneficial in improving health related quality of life. An estimated 50% to 70% of women with urinary incontinence fail to seek medical evaluation because of social stigma. Access to effective drugs in an OTC setting could result in a significant in- crease in use of these drugs and a significant improve- ment in quality of life for women with urinary inconti- nence. Again, using our estimate of increased class wide drug utilization and the current population of OAB users of approximately 4.2 million and the increase in QALY score of 0.04 per year from Cardozo et al. (2010), we estimate an overall QALY gain of over 50,000 per year [25]. For sufferers of OAB, of primary concern is the ability to attend work and function in the work environment. According to Clemens (2011), which uses results of a self-administered, Internet-based questionnaire, the Na- tional Health & Wellness Survey, work productivity is defined as the sum of absenteeism and presenteeism [26]. The study reports the average number of days missed from work in the last 3 months (absenteeism) and the average number of days in the last 3 months where pro- ductivity at work was reduced by half or more (presen- teeism) for both Rx treated OAB sufferers and untreated OAB sufferers separately. The differences between productivity figures for treated and untreated populations can be used to measure the increased productivity gained when using OAB medications. Treatment decreases both absenteeism, which results in a 2.38% productivity gain, and presen- teeism, which results in a 1.79% productivity gain. These imply work productivity gains of $1,513/year for women and $1965/year for men when we use $36,278 as the average earnings of women and $47,127 as the average earnings of men with labor market participation rates of 60% for women and 73% for men [27]. Because most of the new users of OTC OAB medication would be women, taking the straight average of the productivity gains and assuming that gain for each new user results in over $2 billion in productivity gains per year. More than 1 in 10 people in the US suffer from mi- graines, with the highest prevalence among women and working age adults [28]. Migraine attacks not only in- crease health care costs but also severely impact quality of life and productivity at work and home. In fact, indi- rect costs due to absenteeism and lost productivity ac- count for the majority of societal burden of migraine costing US employers about $13 billion (in 1999 dollars) a year [29]. These large costs of migraine are primarily due to under treatment with the majority of migraine sufferers reporting that they had not seen a doctor within the last one year [30]. Roughly half of migraine sufferers report using OTC medications only. However, current OTC choices for treating migraine in the US are limited as the newer and more efficacious treatments (triptans) are currently available by prescription only. In 2006, sumitriptan—the first triptan, introduced in 1992—be- came available as an OTC drug in the UK and Germany. Similar OTC conversion in the US has the potential to significantly help employers by lowering health care costs, reducing absenteeism and improving productivity. For example, previous research suggests that roughly 6 million working age men and 18 million working age women suffer from migraines. Among migraine suffer- ers’ men required 3.8 days of bed rest and women re- quired 5.6 days of bed rest. If OTC availability of trip- tans provides effective migraine treatment for roughly 1 in 6 migraine sufferers, then it would reduce the number of bed days by 3.8 million for men and 16.8 million for women. This reduction in bed days valued at average wages by gender would yield savings to society of roughly 3.5 billion dollars. OTC availability will also save health care costs by reducing costs related to physi- cian visits which account for 60% of the direct costs of Copyright © 2013 SciRes. OPEN ACCESS  C. St omberg et al. / Health 5 (2013) 1667-1680 1678 migraines [29]. Finally, OTC sumitriptan would also likely result in lower prescription drug costs for employ- ers as it would cause substitution from branded prescrip- tion triptans to sumitriptan which is available as a ge- neric in the US since 2009. The ED market includes a significant grey market. Many ED sufferers turn to online pharmacies or to non- prescription alternatives, such as herbal remedies. Camp- bell et al. (2012) examined Viagra that was purchased through internet pharmacies and found that more than 75% were counterfeit [31]. While counterfeit, they did contain sildenafil citrate, but not in the dose indicated on the label. Additionally, they were frequently shipped without the corresponding safety information, including the contraindication for nitrates. Campbell et al. (2012) also found that many herbal remedies contain sildenafil or similar synthetic substances without listing them on the label. Even within products, there was significant variation in the level the prescription molecule. We be- lieve it is likely that many of these grey market users would switch to the OTC, were it available. This could have important public health benefits by switching con- sumers into a product with controlled and regulated manufacturer process and quality control. This robust grey market also indicates that the pre- scription market is not filling consumer demand. This may be driven by embarrassment when discussing medi- cation with doctors. Alternately, costs may be a factor for consumers. ED drugs are often not covered by insurance companies or have strict quantity limits imposed for coverage. Increased availability of drugs to treat erectile dysfunction in an OTC setting could result in significant improvement in quality of life for men who suffer from erectile dysfunction. Our models suggest OTC availabil- ity could result in approximately 2.5 million new users (a 30% increase from the over 8 million users of prescrip- tion and grey market ED drugs) [32]. Prior studies show that prescription ED drugs improve QALYs by 0.35 per user, for a total QALY gain of over 500,000 [33]. While we have suggested the possible magnitude of health effects for future OTC switches, it is important to note that future research will need to address this ques- tion more thoroughly. In addition to estimating the health improvements for new users of the drug class, the poten- tial decrease in health for users switching from a physi- cian monitored environment to an OTC setting must also be considered. Additionally, OTC drugs may be the lowest available dose, causing some prescription switch- ers to utilize an inadequate dose of the drug. Finally, some new users of the drug may not actually receive any benefit from it while others will suffer side effects. We discussed potential health benefits of an Rx-to- OTC switch. However, to fully understand the impact of an OTC conversion, it is essential to also learn about the consequent changes in health care costs, such as expen- ditures on drugs and physician’s services. Un-ortunately, the literature on cost consequences is sparse. Several studies use administrative claim data and conclude that OTC conversion reduces insurers’ total spending on drugs and medical services (see Sood et al. (2008) for a literature review) [7]. However, the extent to which lower spending by insurers is offset by increased con- sumer expenditure is not known. A few papers attempt to estimate social costs using decision-analytic methods and conclude that there are potential cost savings related to OTC introduction (for example Sullivan et al. (2003)) [14]. Some studies also estimate the effect of OTC switches on physician spending with mixed findings. A decrease in office visits is documented after the introduc- tion of OTC vaginal antifungal (see Gurwitz et al. (1995)) while no change was found related to the introduction of OTC H2RAs (see Shaw et al. (2001)) [9,34]. Overall, future research should consistently account for the cost effects of an Rx-to-OTC switch for different cost catego- ries and for different payers in the health care market: consumers, insurers and the government. REFERENCES [1] Consumer Healthcare Products Association (2012) Rx-to- OTC Switch. http://www.chpa-info.org/scienceregulatory/Switch_SR.a spx [2] Freudenheim, M. (2003) Claritin’s price falls, but drug costs more. The New York Times. [3] Goldman, D.P., Joyce, G.F., et al. (2007) Prescription drug cost sharing: Associations with medication and medical utilization and spending and health. JAMA, 298, 61-69. [4] Pierce, J.P. and Gilpin, E.A. (2002) Impact of over-the- counter sales on effectiveness of pharmaceutical aids for smoking. JAMA, 288, 1260-1264. [5] Reed, M.B., et al. (2005) The effect of over-the-counter sales of the nicotine patch and nicotine gum on smoking cessation in California. Cancer Epidemiology, Biomar- kers & Prevention, 14, 2131-2136. http://dx.doi.org/10.1158/1055-9965.EPI-04-0919 [6] Moreau, C., Bajos, N. and Trussell, J. (2006). The impact of pharmacy access to emergency contraceptive pills in France. Contraception, 73, 602-608. http://dx.doi.org/10.1016/j.contraception.2006.01.012 [7] Sood, N., et al. (2008) Potential effects of introducing behind the counter drugs. RAND Working Paper. [8] Sood, N., Sun, E., et al. (2012). Behind-the-counter stat- ins: A silver bullet for reducing costs and increasing ac- cess? Health Services Research, 47, 174-187. http://dx.doi.org/10.1111/j.1475-6773.2011.01315.x [9] Gurwitz, J.H., McLaughlin, T.J., et al. (1995). The effect of an Rx-to-OTC switch on medication prescribing pat- terns and utilization of physician services: The case of Copyright © 2013 SciRes. OPEN ACCESS  C. St omberg et al. / Health 5 (2013) 1667-1680 Copyright © 2013 SciRes. OPEN ACCESS 1679 vaginal antifungal products. Health Services Re sea rch, 30, 672-685. [10] Sullivan, P.W., Nair, K.V., et al. (2005) The effect of the Rx-to-OTC switch of loratadine and changes in prescrip- tion drug benefits on utilization and cost of therapy. Ame- rican Journal of Managed Care, 11, 374-382. [11] Furler, M.D., Rolnick, M.S., et al. (2002) Cost impact of switching histamine(2)-receptor antagonists to nonprescrip- tion status. The Annals of Pharmacotherapy, 36, 1135- 1141. http://dx.doi.org/10.1345/aph.1A231 [12] Filion, K., et al. (2007) The impact of over-the-counter simvastatin on the number of statin prescriptions in the United Kingdom: A view from the general practice re- search database. Pharmacology and Drug Safety, 16, 1-4. http://dx.doi.org/10.1002/pds.1314 [13] Walker, R. and Hinchliffe, A. (2010) Prescribing and sale of ophthalmic chloramphenicol following reclassification to over-the-counter availability. International Journal of Pharmacy Practice, 18, 269-274. http://dx.doi.org/10.1111/ijpp.18.05.00046.x [14] Sullivan, P.W., Follin, S.L., et al. (2003) Transitioning the second-generation antihistamines to over-the-counter status: A cost-effectiveness analysis. Medical Care, 41, 1382-1395. http://dx.doi.org/10.1097/01.MLR.0000100584.18276.C4 [15] Stead, L.F., et al. (2008) Nicotine replacement therapy for smoking cessation. Cochrane Database of Systematic Re- views, 1, Article ID: CD000146. http://dx.doi.org/10.1002/14651858.CD000146.pub3 [16] Raymond, E.G., Trussell, J., et al. (2007). Population ef- fect of increased access to emergency contraceptive pills: A systematic review. Obstetrics & Gynecology, 109, 181- 188. http://dx.doi.org/10.1097/01.AOG.0000250904.06923.4a [17] Polis, C.B., Schaffer, K., et al. (2007). Advance provision of emergency contraception for pregnancy prevention: A meta-analysis. Obstetrics & Gynecology, 110, 1379-1388. http://dx.doi.org/10.1097/01.AOG.0000295603.84568.f6 [18] Lakdawalla, D., et al. (2006) Intellectual property and marketing. NBER Working Paper. [19] Brass, E.P. (2004) Consumer behavior in the setting of over-the-counter statin availability: Lessons from the consumer use study of OTC Mevacor. American Journal of Cardiology, 94, 22F-29F. http://dx.doi.org/10.1016/j.amjcard.2004.07.051 [20] Melin, J.M., Struble, W.E., et al. (2004) A consumer use study of over-the-counter lovastatin (CUSTOM). Ameri- can Journal of Cardiology, 94, 1243-1248. http://dx.doi.org/10.1016/j.amjcard.2004.08.007 [21] Brass, E.P., et al. (2008) Can consumers self-select for appropriate use of an over-the-counter statin? The self evaluation of Lovastatin to enhance cholesterol treatment study. American Journal of Cardiology, 101, 1448-1455. http://dx.doi.org/10.1016/j.amjcard.2008.01.020 [22] Kline and Company (2010) Rx-to-OTC Forecasts USA 2010. Kline & Company, Inc., Report no. #Y406C. http://www.klinegroup.com/reports/brochures/y406c/broc hure.pdf [23] Brass, E.P., et al. (2006) Potential impact on cardiovas- cular public health of over-the-counter statin availability. American Journal of Cardiology, 97, 851-856. http://dx.doi.org/10.1016/j.amjcard.2005.10.022 [24] Straka, R., et al. (2007) Economic impacts attributable to the early clinical benefit of atorvastatin therapy—A US managed care perspective. Current Medical Research and Opinion, 23, 1517-1529. http://dx.doi.org/10.1185/030079907X199808 [25] Cardozo, L., et al. (2010) The cost-effectiveness of soli- fenacin vs fesoterodine, oxybutynin immediate-release, propiverine, tolterodine, extended-release and tolterodine immediate-release in the treatment of patients with over- active bladder in the UK National Health Service. British Journal of Urology International, 106, 506-514. http://dx.doi.org/10.1111/j.1464-410X.2009.09160.x [26] Clemens, J. (2011) Factors associated with work produc- tivity impairment in subjects with overactive bladder. Presentation, AMCP 23rd Annual Meeting, Minneapolis, 27-29 April 2011. [27] US Census Bureau (2010) Income, poverty, and health insurance coverage in the United States: 2009. Bureau of Labor Statistics, Labor Force Participation Rate Series. [28] Lipton, R., et al. (2007) Migraine prevalence, disease burden, and the need for preventative therapy. Neurology, 68, 343-350. http://dx.doi.org/10.1212/01.wnl.0000252808.97649.21 [29] Hu, X., et al. (1999) Burden of migraine in the United States—Disability and economic costs. Archives of Inter- nal M edicine, 159, 813-818. http://dx.doi.org/10.1001/archinte.159.8.813 [30] Lipton, R., et al. (2002) Migraine in the United States: Epidemiology and patterns of access to care. Neurology, 58, 885-894. http://dx.doi.org/10.1212/WNL.58.6.885 [31] Cambpell, N., et al. (2012) Internet-ordered viagra (sil- denafil citrate) is rarely genuine. Presentation, American Urological Association 2012 Annual Meeting, Atlanta, 19-23 May 2012. [32] Jackson, G., et al. (2010) Counterfeit phosphodisterase type 5 inhibitors pose significant safety risks. Interna- tional Journal of Clinical Practice, 64, 497-504. http://dx.doi.org/10.1111/j.1742-1241.2009.02328.x [33] Smith, K. and Roberts, M. (2000) The Cost-Effectiveness of Sildenafil. The Annals of Internal Medicine, 132, 933-937. http://dx.doi.org/10.7326/0003-4819-132-12-200006200- 00002 [34] Shaw, M.J., Fendrick, A.M., et al. (2001) Self-reported effectiveness and physician consultation rate in users of over-the-counter histamine-2 receptor antagonists. The American Journal of Gastroenterologyl, 96, 673-676. http://dx.doi.org/10.1111/j.1572-0241.2001.03602.x  C. St omberg et al. / Health 5 (2013) 1667-1680 1680 APPENDIX: MATHEMATICAL TREATMENT The interrupted time series approach used here is mo- tivated by the idea that utilization pre/post OTC switch can be compared after properly conditioning on other potentially predictive variables. In particular, we are in- terested in identifying a break in either the utilization of molecule i in class j at time t, qijt, or its class, tiijt coincident with OTC switch. Suppose that utilization of the molecule is governed by the following process: Q q ijtijt ijt qfX where Xijt is a vector of pre-determined variables that are potentially predictive of utilization. By pre-determined we mean that the variables in question are known at time t, and are not affected by current utilization. These could include, for example, time trends, seasonal effects, life- cycle indicators, and even past observations of utilization. The function · is possibly nonlinear, and ijt is a random disturbance with mean zero assumed to be un- correlated with Xijt. Suppose, in addition, that utilization in presence of an OTC product is governed by the fol- lowing alternative process: . O ijtijt ijt qg uX where ijt is another random disturbance that is uncor- related with ijt . Our approach to identifying the break associated with an OTC switch therefore amounts to estimating the expected difference in utilization under the two alternative regimes given the information we have in Xijt: u . O ijt ijtijtijt ijt ijt ijt EdEq q Eg f XX XX Since OTC switches occur at a point in time, the comparison of · and · is counterfactual in that one observes · before the switch, and · after- ward, but never both at the same time. The econometric question therefore boils down to a test of whether, given the observed conditioning information Xijt, there is discernible difference between · as estimated in the pre-OTC period, and · as estimated in the post-OTC period. The difference Eijt d can be estimated directly by comparison of two models. This can be achieved, for example, by use of dummy variables that allow for direct estimation of changes in slope and intercept coefficients within a linear model. But, it can also be achieved simply by comparing forecasts of utilization from an estimate of · based on data prior to switch to actual post-switch data. In other words, we can compare to O ijt q · since O ijtijt ijtijtijt Eq fEgf XXX X It is important to recognize that the interrupted time series approach employed here can be sensitive to the quality of the conditioning information in Xijt. If this in- formation set does not properly account for important factors that affect utilization, then the comparison be- tween · and · may be confounded by omitted variables, or lead to omitted variables bias. Similarly, functional form misspecification of our estimates of · and · could also lead to improper inference. Copyright © 2013 SciRes. OPEN ACCESS
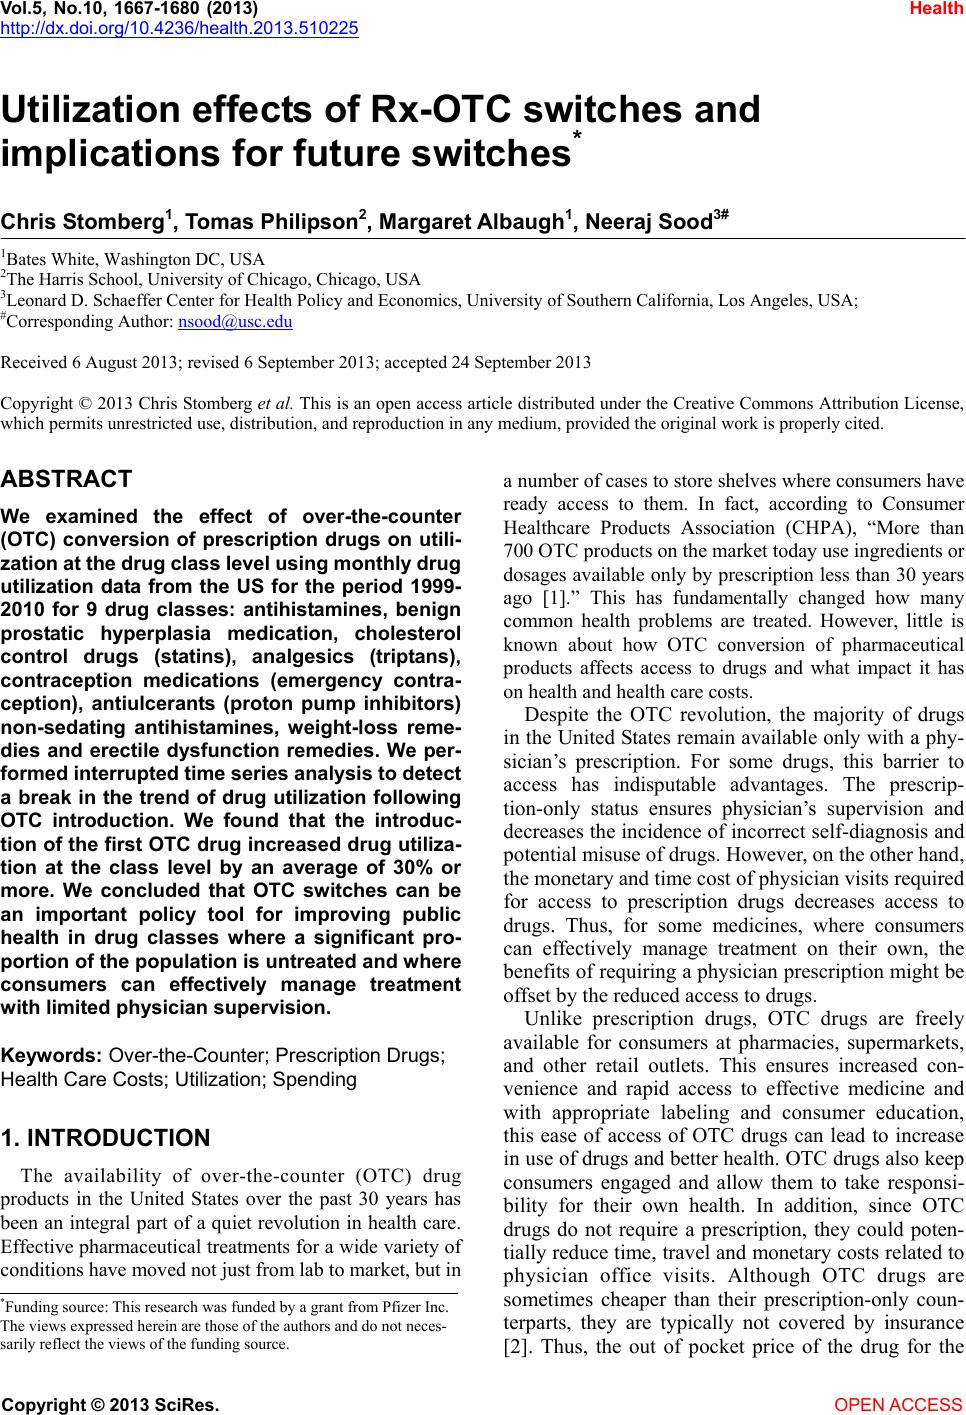
|